1.HNL is getting better every year. Since the Croatian Football Federation decided to decrease the number of clubs in the 1st league from 12 to 10, the quality of football significantly increased over time. This year is no different, the table looks exciting and there are a few teams with just a few points difference between them, with some having fewer matches because their games were postponed. Croatia has two representatives in European competitions with Dinamo Zagreb and Rijeka playing in the Europa League. Dinamo Zagreb won their group and qualified for the knockout phase, while Rijeka ended last in a tough group playing against Serie A side Napoli and La Liga side Real Sociedad.
This data analysis will point out certain statistics which indicate the performance of the teams so far this season. By looking at the data visualizations through this analysis, we will try to connect data to the situations on the pitch and explain why teams overperform or underperform in certain fields.
Overview
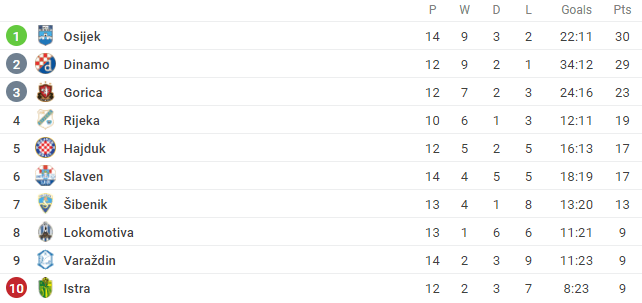
[image: Sofascore]
Osijek sit at the top of the table, but they have played two matches more than Dinamo who is a point behind and four matches more than Rijeka who mathematically could be above them if they win all the postponed games. Gorica had a fantastic start to the season and it will be interesting to see if they will be able to keep their level of performances through the whole season.
Lokomotiva, Varaždin and Istra have collected only nine points so far and they are at the bottom of the table. Varaždin sacked their coach Samir Toplak this week and they are looking to change their season for the better. Lokomotiva lost many key players after finishing second last season with Marko Tolić, Kristijan Jakić, Ivo Grbić and Lirim Kastrati leaving the club. It is not surprising they are still trying to find their rhythm. Istra had a lot of administrative problems at the start of the season which reflected on their performances and they will once again have a tough season to stay in the league.
Now we will take a look at their goals and assists.
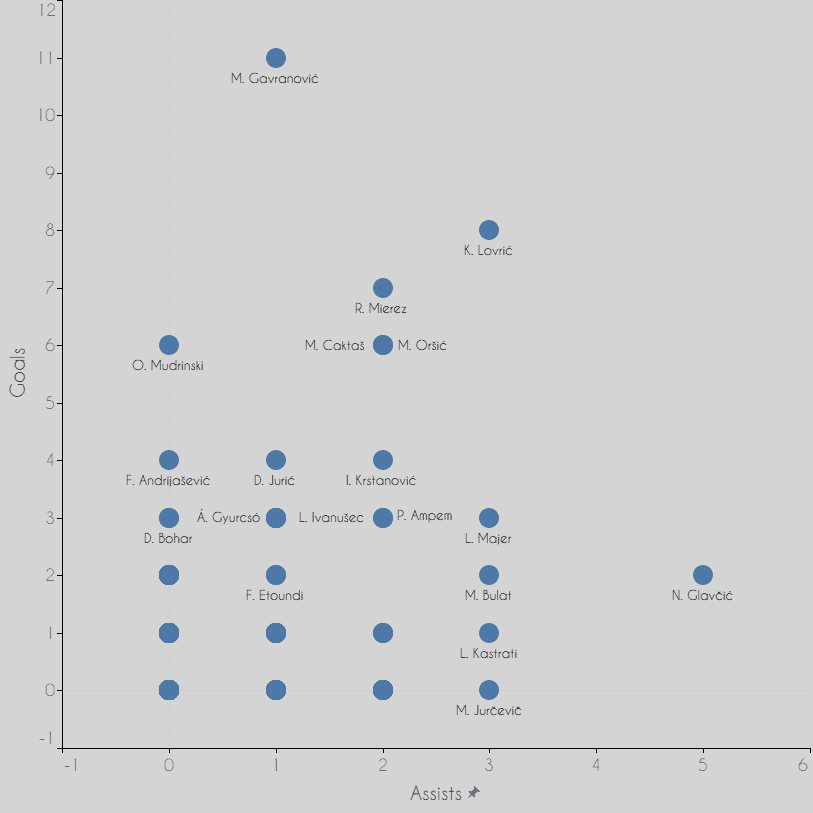
As we can see on the scatter graph above, Mario Gavranović is the top goal-scorer with 11 goals while Nemanja Glavčić is leading in the assists with five in total. It looks like Dinamo made the right decision to offer Gavranović a new contract after his last one expired and he left the club already before Zoran Mamić decided to go after him. Glavčić had only one assist last season which was four assists below his expected value, but this season so far he is overperforming his 3.08 expected assists.
Lovrić continues his impressive performances for Gorica this season as well with eight goals and three assists so far. A returnee to 1.HNL Ramon Mierez is one of the main reasons why Osijek are in the first place as he scored seven goals and assisted twice, but his work rate and ability to hold the ball is what separates him from the other forwards in the league.
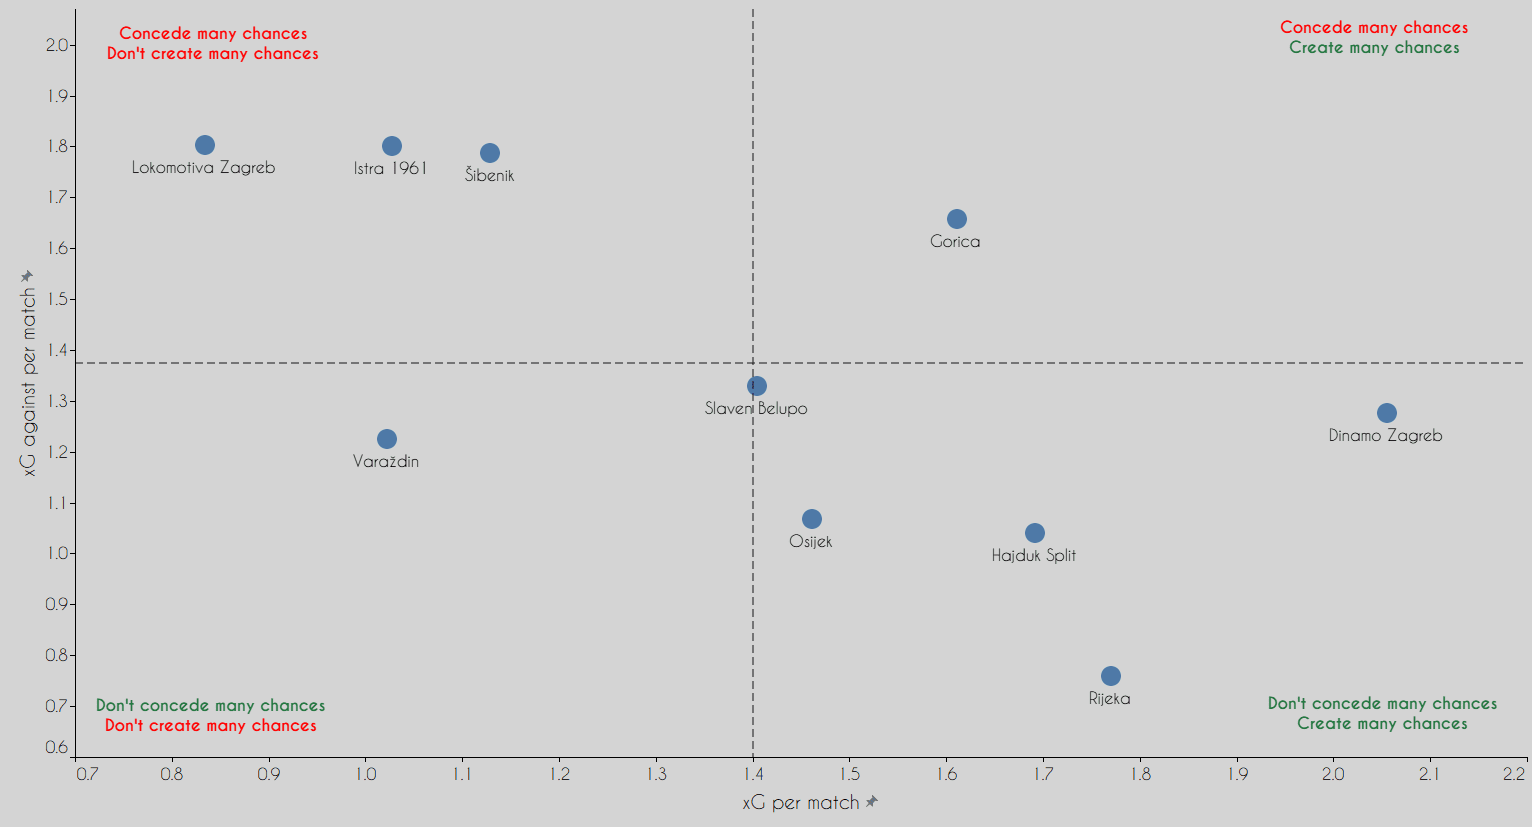
In the image above we can see how 1.HNL teams perform in terms of expected goals for and against. Those clubs in the lower right quarter are teams that don’t concede many quality chances and create many quality chances. Dinamo Zagreb are showing impressive chance creation, being the only team above 2 xG per match. Other clubs that are good in both areas are Rijeka, Hajduk and Osijek.
It is surprising that Slaven Belupo belong to that quarter as they are slightly above-average in both metrics which is surely an indicator of their improvement under Tomislav Stipić. Gorica is the team that creates many quality chances but also allows a lot of quality chance which is the area where they need to improve. We can see that teams who are at the bottom of the table have below xG per match with Šibenik overperforming and Varaždin underperforming their xG difference.
Expected goals and shooting
In this section, we will take a look into certain metrics to evaluate how teams perform in terms of expected goals and shooting. On the first graph, we will compare teams based on the number of their shots and average shot distance.
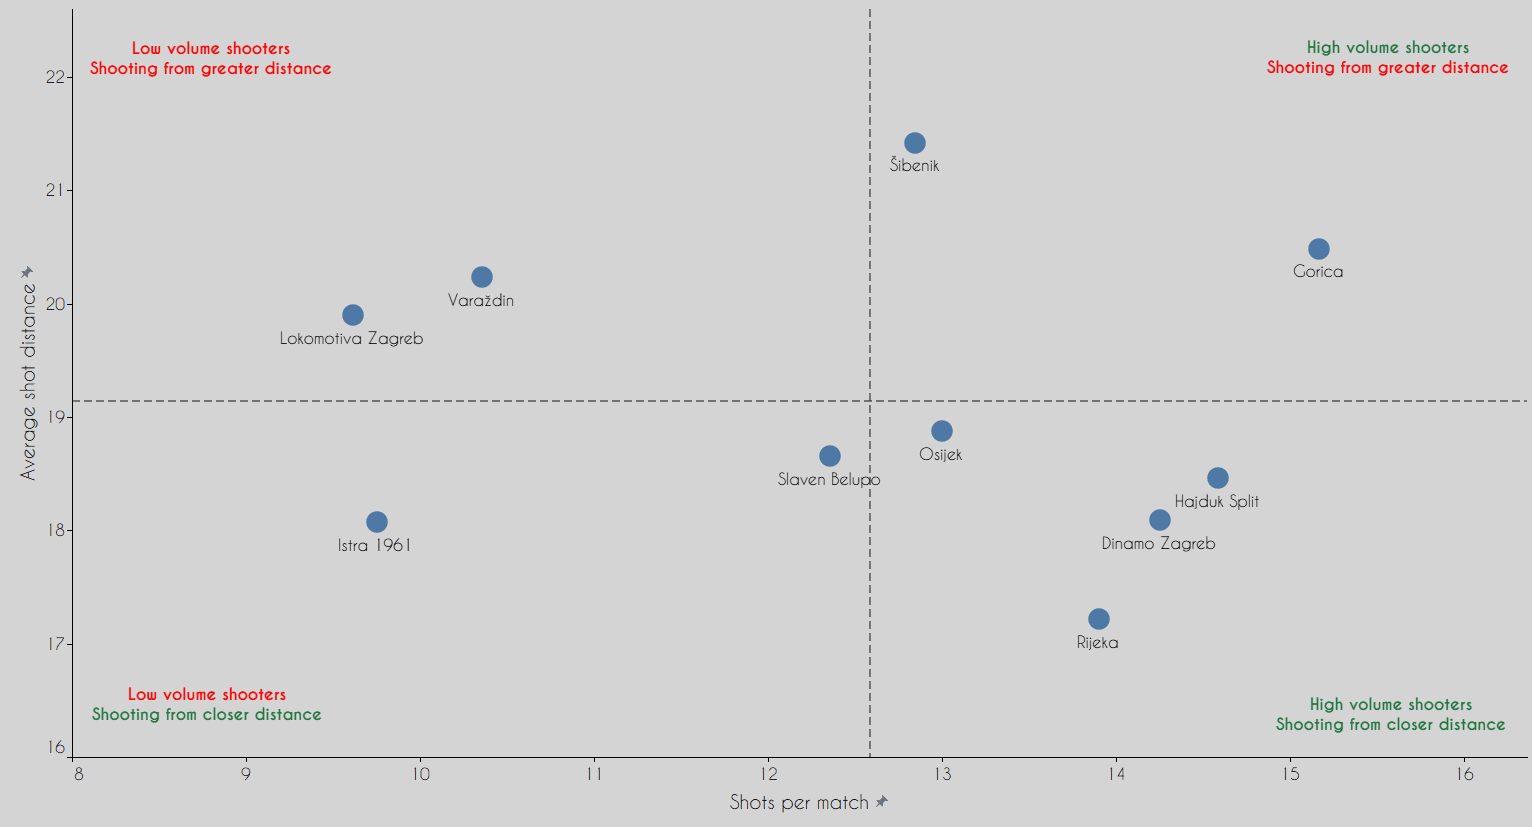
The same teams that were above average in xG per match are looking good on this graph as well. It is hard to ignore that Rijeka have 13.9 shots per match and still manage to shoot from an average distance of 17.21 metres. Gorica are averaging 15.17 shots per match which is the league highest, but are shooting from 20.49 metres on average. Both of Gorica’s stats from this graph are because of Lovrić’s impact, since he is the highest volume shooter in the league and likes to take long-range shots from all over the field.
Šibenik take 12.85 shots per match but shoot from the farthest distance in the league: 21.42m on average. They don’t make a lot of quality chances either, but look like the team who can score from tough positions. Once again bottom of the table clubs are low volume shooters and only Istra shoot from a closer distance between those three teams. In the next image, we will see how often players shoot and how many touches in the box they take per 90 minutes.
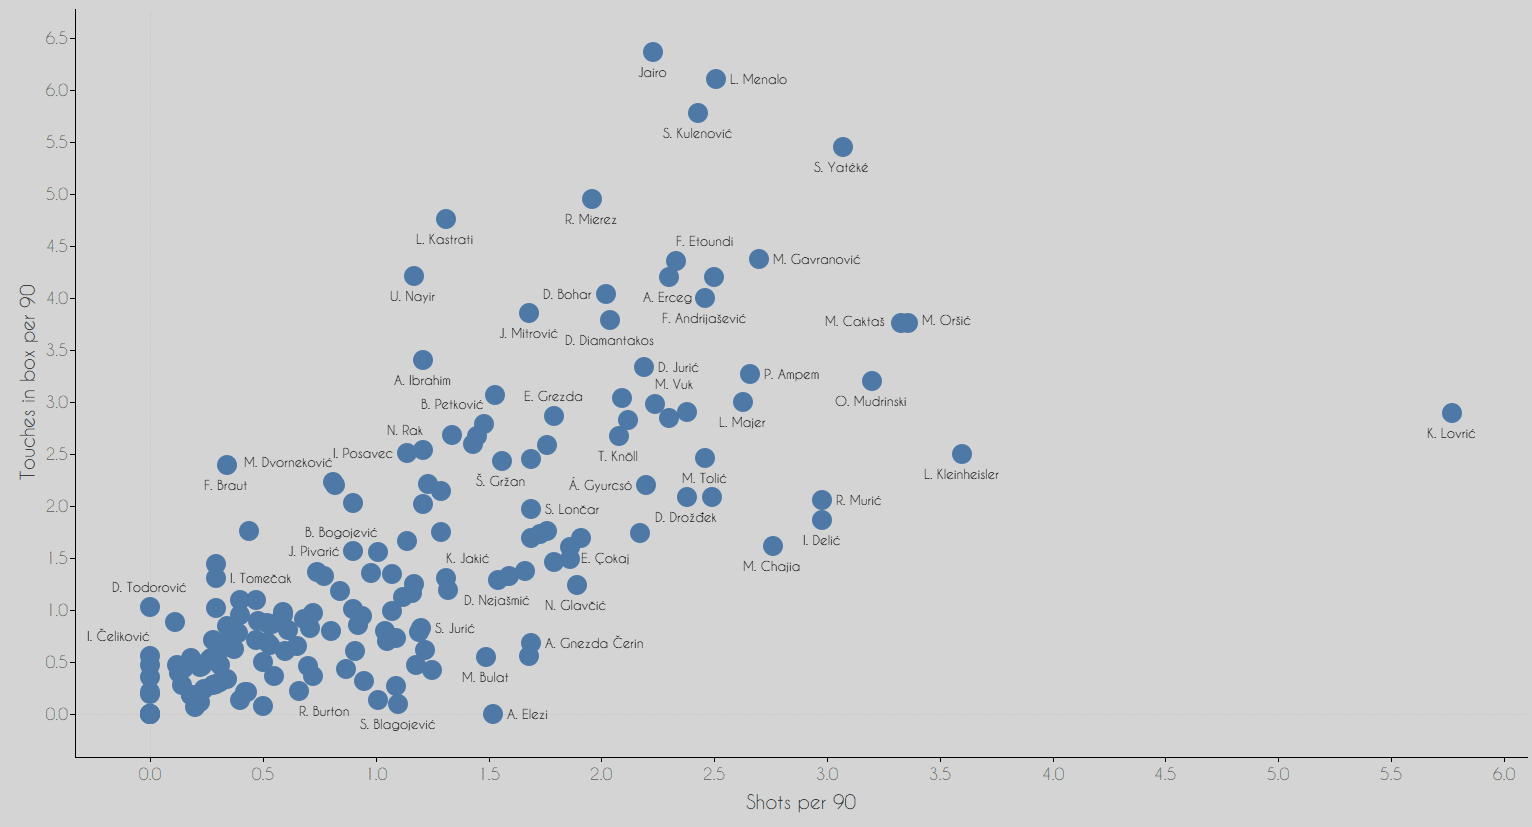
We already mentioned Lovrić who is dominating the league in the shots department, averaging 5.4 shots per 90 in the last two seasons. His average 0.06 xG per shot represents his ambitious shooting which once in a while ends in the top bin from 30 metres out. What we can take from this graph is surely why Rijeka take many shots from closer distance. If we look at the players who take the most touches in the box per 90, there are three Rijeka players: Luka Menalo, Sandro Kulenović and Sterling Yateke. All three of them have more than five touches in the box per 90 and shoot more than two times per 90. Jairo and Mierez are in the top five based on touches in the box; both of them are key forwards for their teams.
Playing style
In this section, we will take a look at the teams’ passing and pressing tendencies. First, we will evaluate passing tendencies with created metrics long passes per 100 passes and lateral passes per 100 passes.
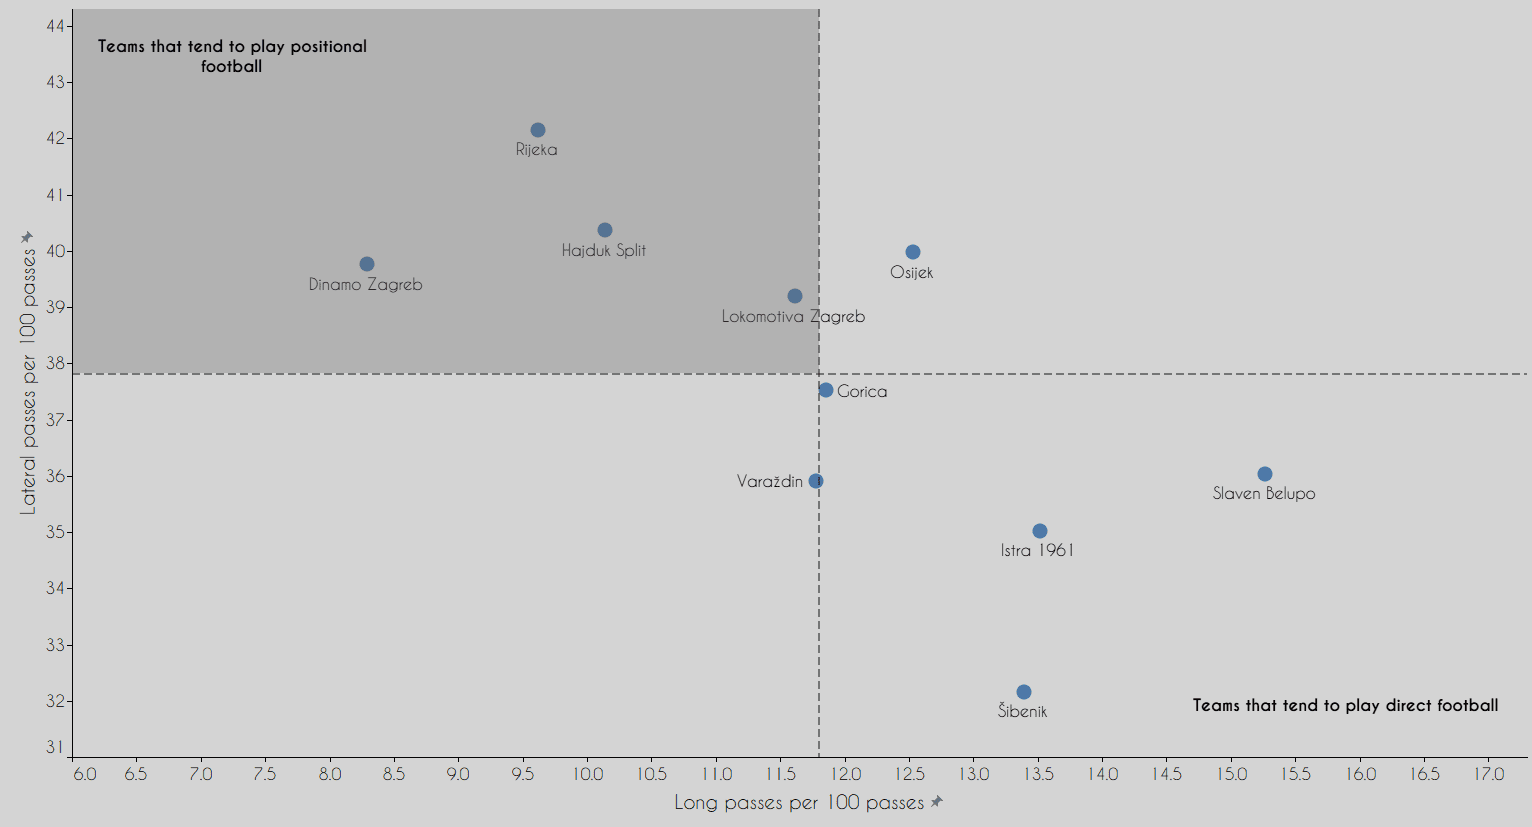
The ratio between the tendency to play laterally or directly is one of the indicators for a team’s playing style. We can see that Rijeka, Hajduk, Dinamo and Lokomotiva tend to play positional football. Lokomotiva are surely an unexpected inclusion based on their position in the table, but their head coach Tomić still insists with their playing style from last season even with a weaker squad. Rijeka are the most patient team in the league with clear patterns of building out from the back. Osijek are the team that has their set tendencies but they are not stuck with just one playing style. What Osijek do which puts them out of the “positional football” range on this graph is that they often attempt long balls towards Ramón Mierez who mostly keeps the ball until his teammates join the attack and also they like to switch flanks to the opposite wing. Šibenik are clearly the most direct team with very little tendency to pass laterally. Gorica are making their transition from direct/counter-attacking football towards positional football under head coach Valdas Dambrauskas.
The next graph will show us the pressing tendencies between the teams with PPDA(passes per defensive action) and team pressures per match. The size of the markers represent how often their pressing is successful.
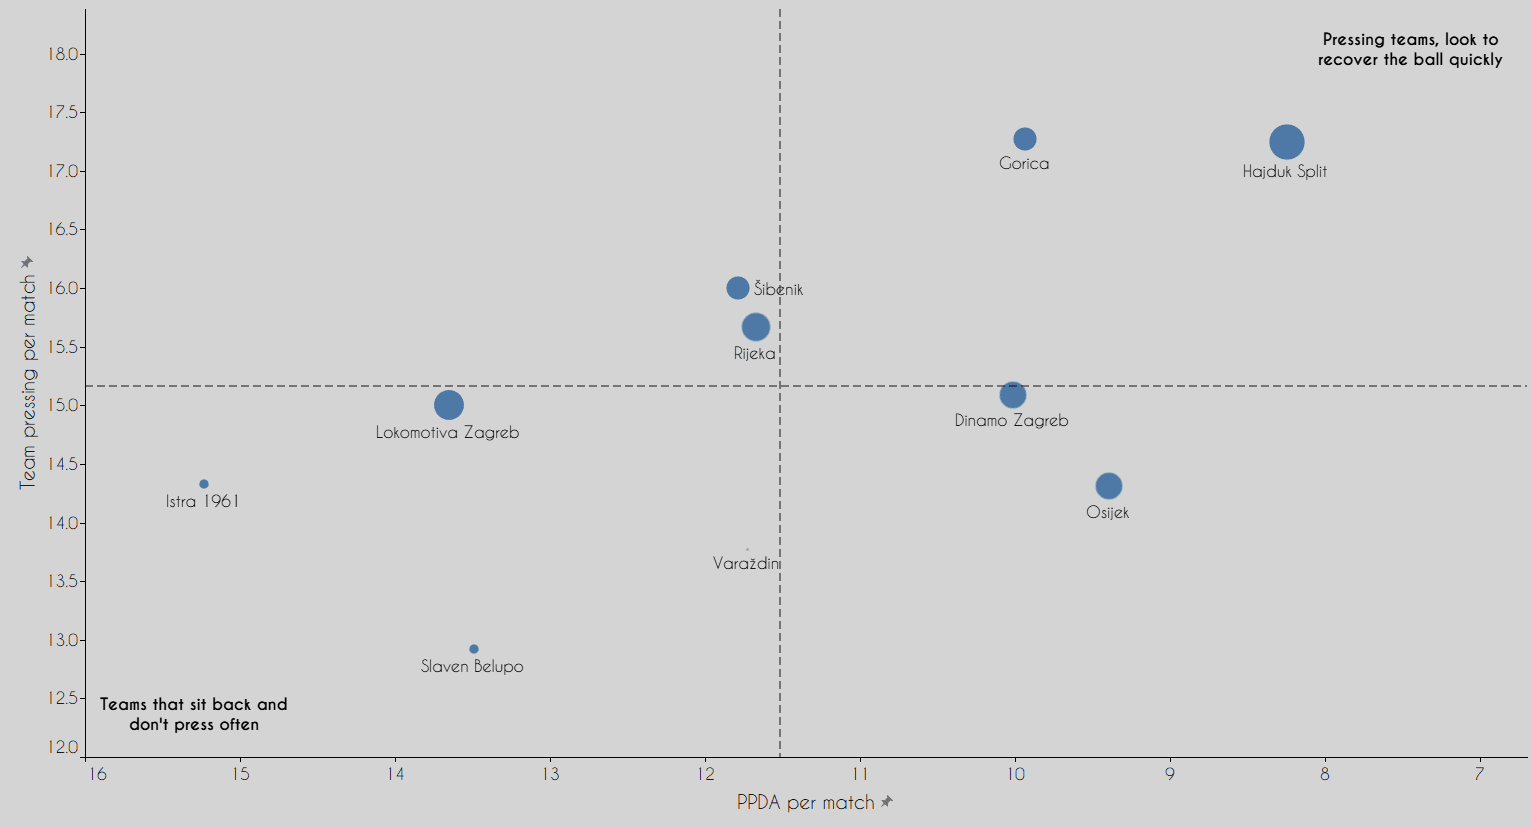
On this graph Hajduk and Gorica are the only teams that often press opponents while allowing a small number of passes before making a defensive action. Hajduk have the most successful pressures per match. They changed head coach when Igor Tudor left to be part of Andrea Pirlo’s backroom stuff at Juventus and they appointed ex-Arsene Wenger assistant coach Boro Primorac. Primorac demands activity from their players when they are out of possession which looks promising, but still, they need to improve their performances if they want to compete for the European spots. Slaven Belupo mostly sit back when defending and don’t engage in much pressing in the opponent’s half, which is logical given that they have Ivan Krstanović in attack who isn’t suited for pressing. Top two teams in the table Dinamo Zagreb and Osijek are similar on this graph; both have a below-average number of pressures and similar PPDA per match.
Set-pieces
The last section we will evaluate are the set-pieces. Based on the number of set-pieces per match and set-pieces ending with a shot we will try to conclude which teams could do better and which teams are making an impact in set-pieces.
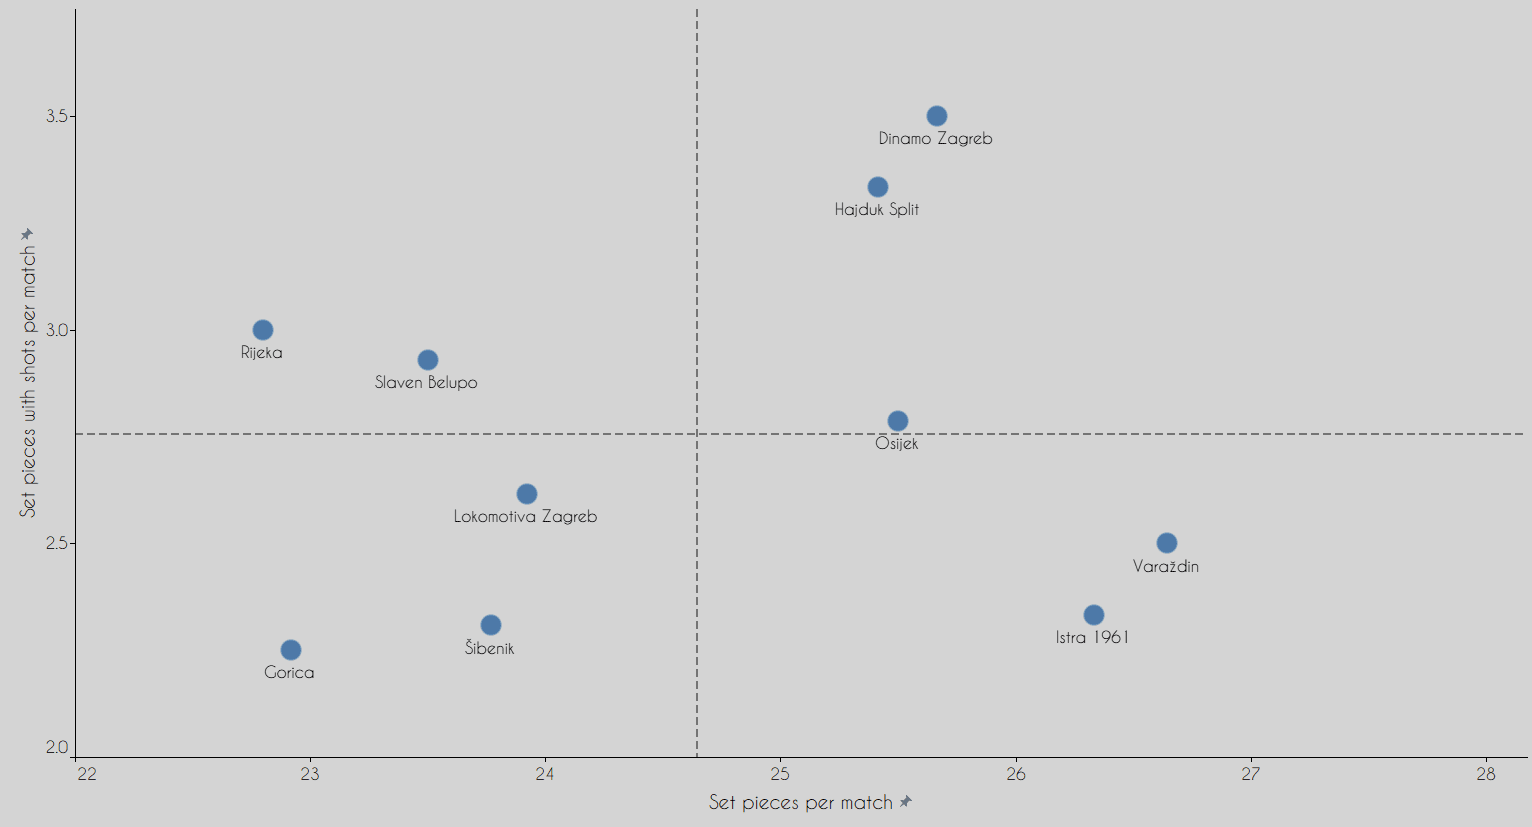
As we can see Dinamo and Hajduk shoot often through set-pieces, followed by Rijeka, Slaven Belupo and Osijek. Rijeka take the least amount of set-pieces but manage to shoot three times per match which is the 3rd best figure in the league. Varaždin and Istra take the most set-pieces per match, both above 26 times, but they average 2.5 and 2.33 shots per match respectively. It would be smart for Istra to work on set-pieces. If we look at the trends in European football and especially in the Premier League, lower quality teams work more on set-pieces because that is the department where they can hurt better teams. Working on set-pieces could benefit their tall players like Gedeon Guzina, Petar Bosančić, Octavio Andrés Paez and Adrián Fuentes.
Conclusion
Through this data analysis, we touched on some points in the performances of the clubs. Rožman implemented his tactical ideas into his team and Rijeka look like a team that depends a lot on their coach’s ideas. Also, Nenad Bjelica brought the winning mentality to Osijek and they are first in the table. But even though their results are impressive since his arrival, Bjelica still has to work to improve his team’s performances. Istra look like a team which is closest to relegation based on their performances. We are looking forward to the rest of the campaign in this interesting championship.



Comments