Context is everything when we discuss player recruitment, right?
The above sentence is how I started my article for the site last week as I looked at ways in which we can assess individual teams within the context of their league when targetting areas to scout and recruit from.
Context is incredibly important but it can be applied at different levels to the recruitment process. In the article last week, which you can find here, I drilled down into league data using percentile rankings to find clubs in Austria and Czechia who have a similar style of play to Leeds United before finding players at those clubs who could potentially be recruitment targets.
It is entirely possible, however, that I skipped the first step in terms of identifying the leagues and the markets that you should target to recruit from. In this article, I will again use league-wide data across certain key metrics in order to find which leagues these metrics are most prominent in. This is a process that I would implement at the start of any recruitment process when you are sitting down and putting in place your player profiles and deciding which metrics are most important in each positional profile.
Using data and league rankings at that point allows you to start to build a position-specific framework that lets you target your scouting processes in the areas that make the most sense.
Why is this important though? Well, for a small set of clubs (the elite of the elite) none of this matters because their reach in terms of scouting and recruitment is so extensive. For everyone else though there is definite value in targetting your approach in terms of recruitment, at least for the first stage of the recruitment cycle. This is also an important consideration in the modern game for teams who are looking to loan out young players to gain first-team exposure. Understanding the type of leagues that you are potentially sending these players to is an important step in the process.
But how does this work?
Well, to begin with, we have to build our data set. For the purpose of this article, I have created a dataset with leagues across Europe in areas that are split across three key areas. Defensive, passing and ball progression, attacking and squad composition. I have run the data set through a code to turn the data into percentile data to give a better sense of the variation between the leagues. Now, we can start to assess the data properly, starting with the defensive phase of the game.
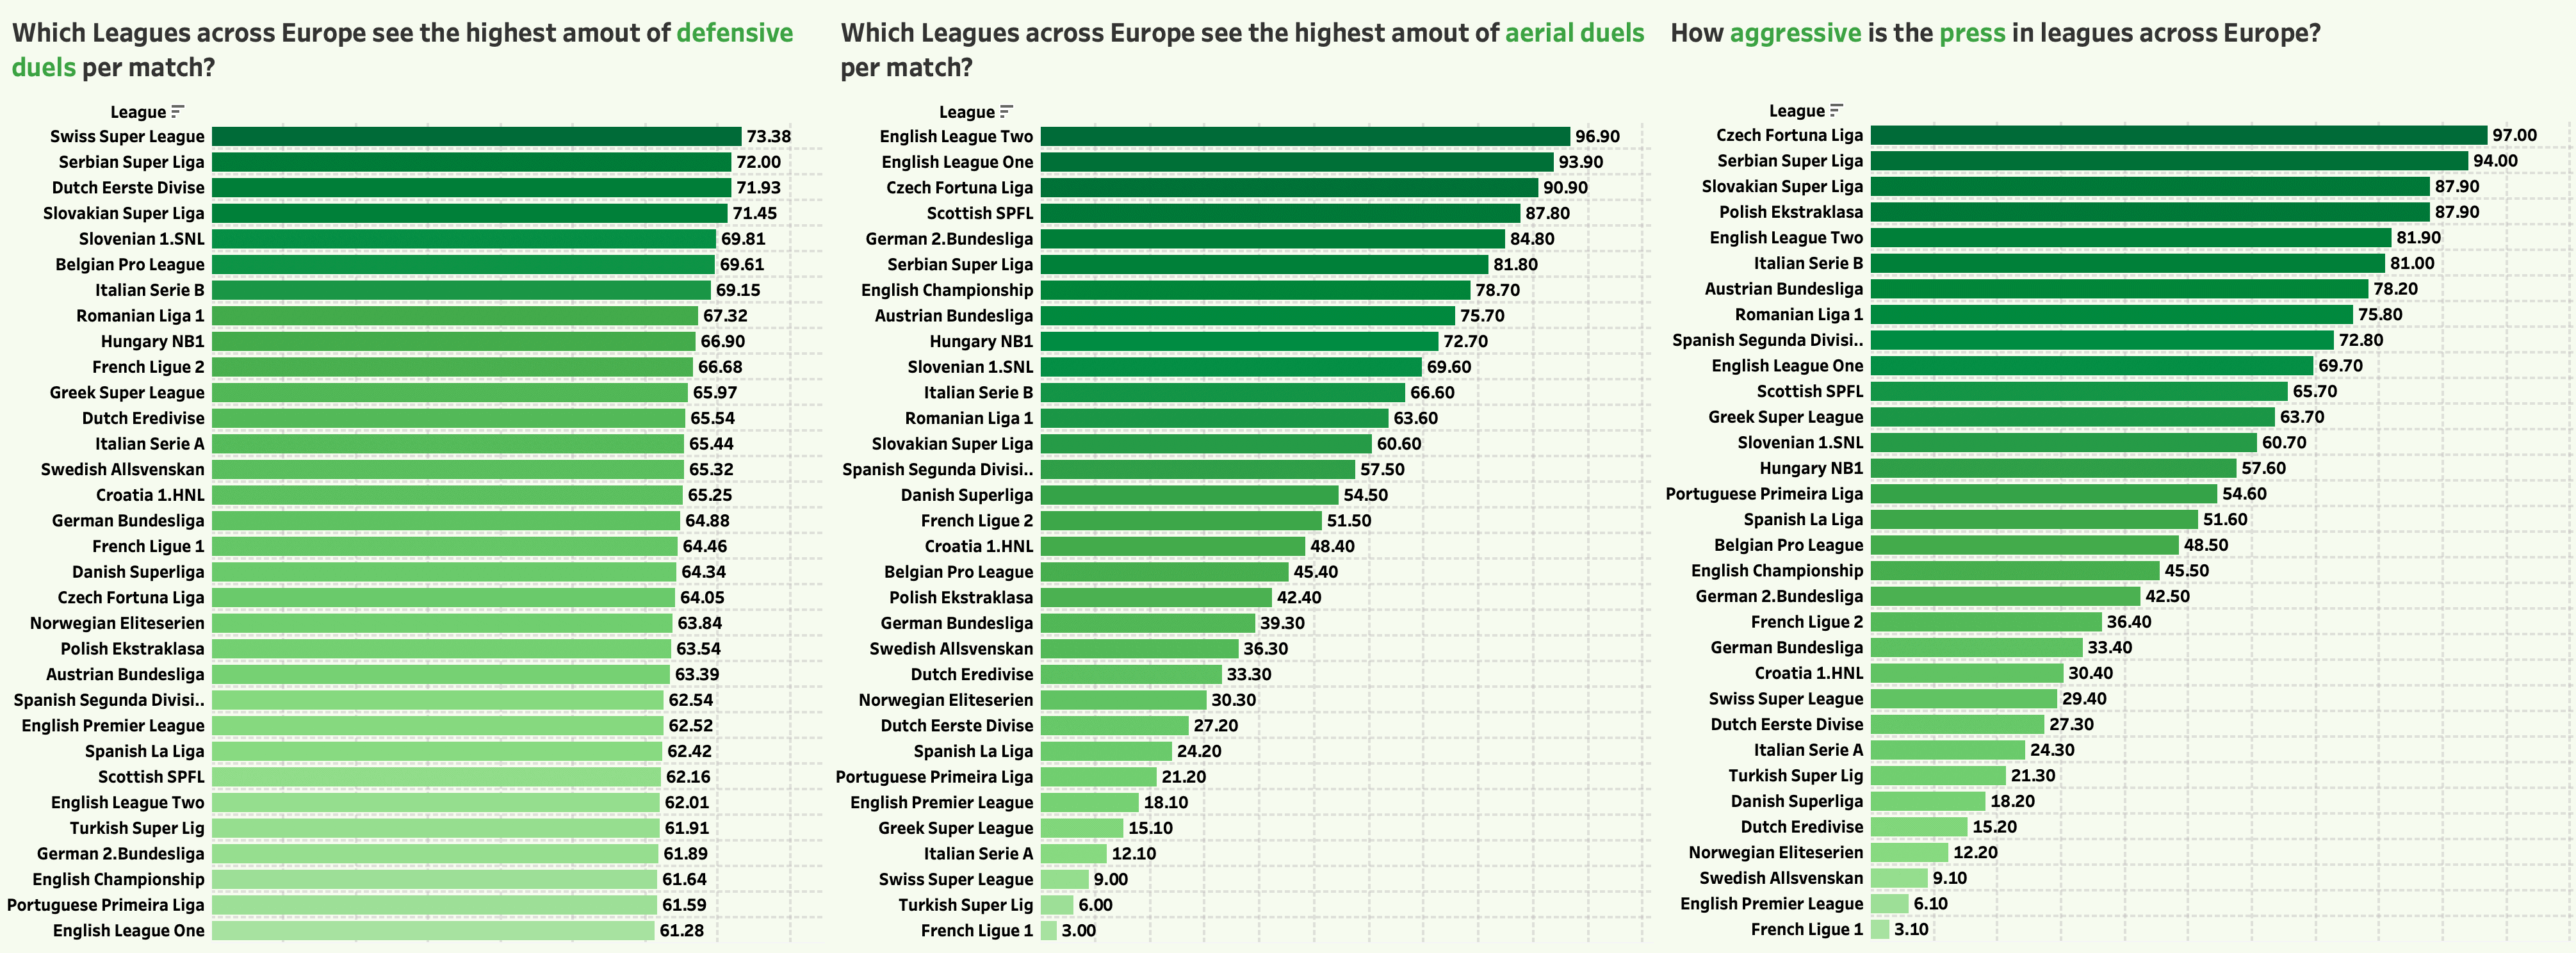
Using simple rankings we can immediately start to build a picture of where leagues feature compared to competitors across the defensive spectrum. To the left we have defensive duels per 90 where the Swiss Super League come out as the most active and League One in England is the least active. In the centre, we have aerial duels per 90 where Englands League Two is the most prominent with Ligue 1 in France averaging the fewest aeriel duels per 90. Lastly, we have passes per defensive action (PPDA) which we use to assess how often teams press the ball in each league, for this ranking I have inverted the percentile ranking so that the leagues with the highest value are the most aggressive in terms of their press, interestingly the Czech league comes out on top as the most aggressive league in our data set while the French top-flight is again bottom of our ranking.
From this point, you can start to build insights that will inform and help your recruitment process. If I were, for example, looking to recruit a central defender for an SPFL club then I might start with their ability in the air. The SPFL is ranked fourth in terms of aerial duels per 90 so immediately I know that any central defender we sign will have to be strong in the air. If you look at the central ranking you can see that the SPFL is sandwiched between the Czech Fortuna Liga and the 2.Bundesliga in Germany. We would know that central defenders in these markets are capable in the air and a fit for the SPFL but what about across our other rankings? Well, for defensive duels the SPFL actually falls down the list significantly while the 2.Bundesliga falls lower still. The Czech Fortuna Liga, however, is a good bit higher. Now, let’s look at PPDA and pressure and we can see that the league in Czechia is significantly higher than the SPFL.
Straight away I am starting to build out insights that suggest that this market is one that we should be targetting for central defenders. Let’s look at another example though.
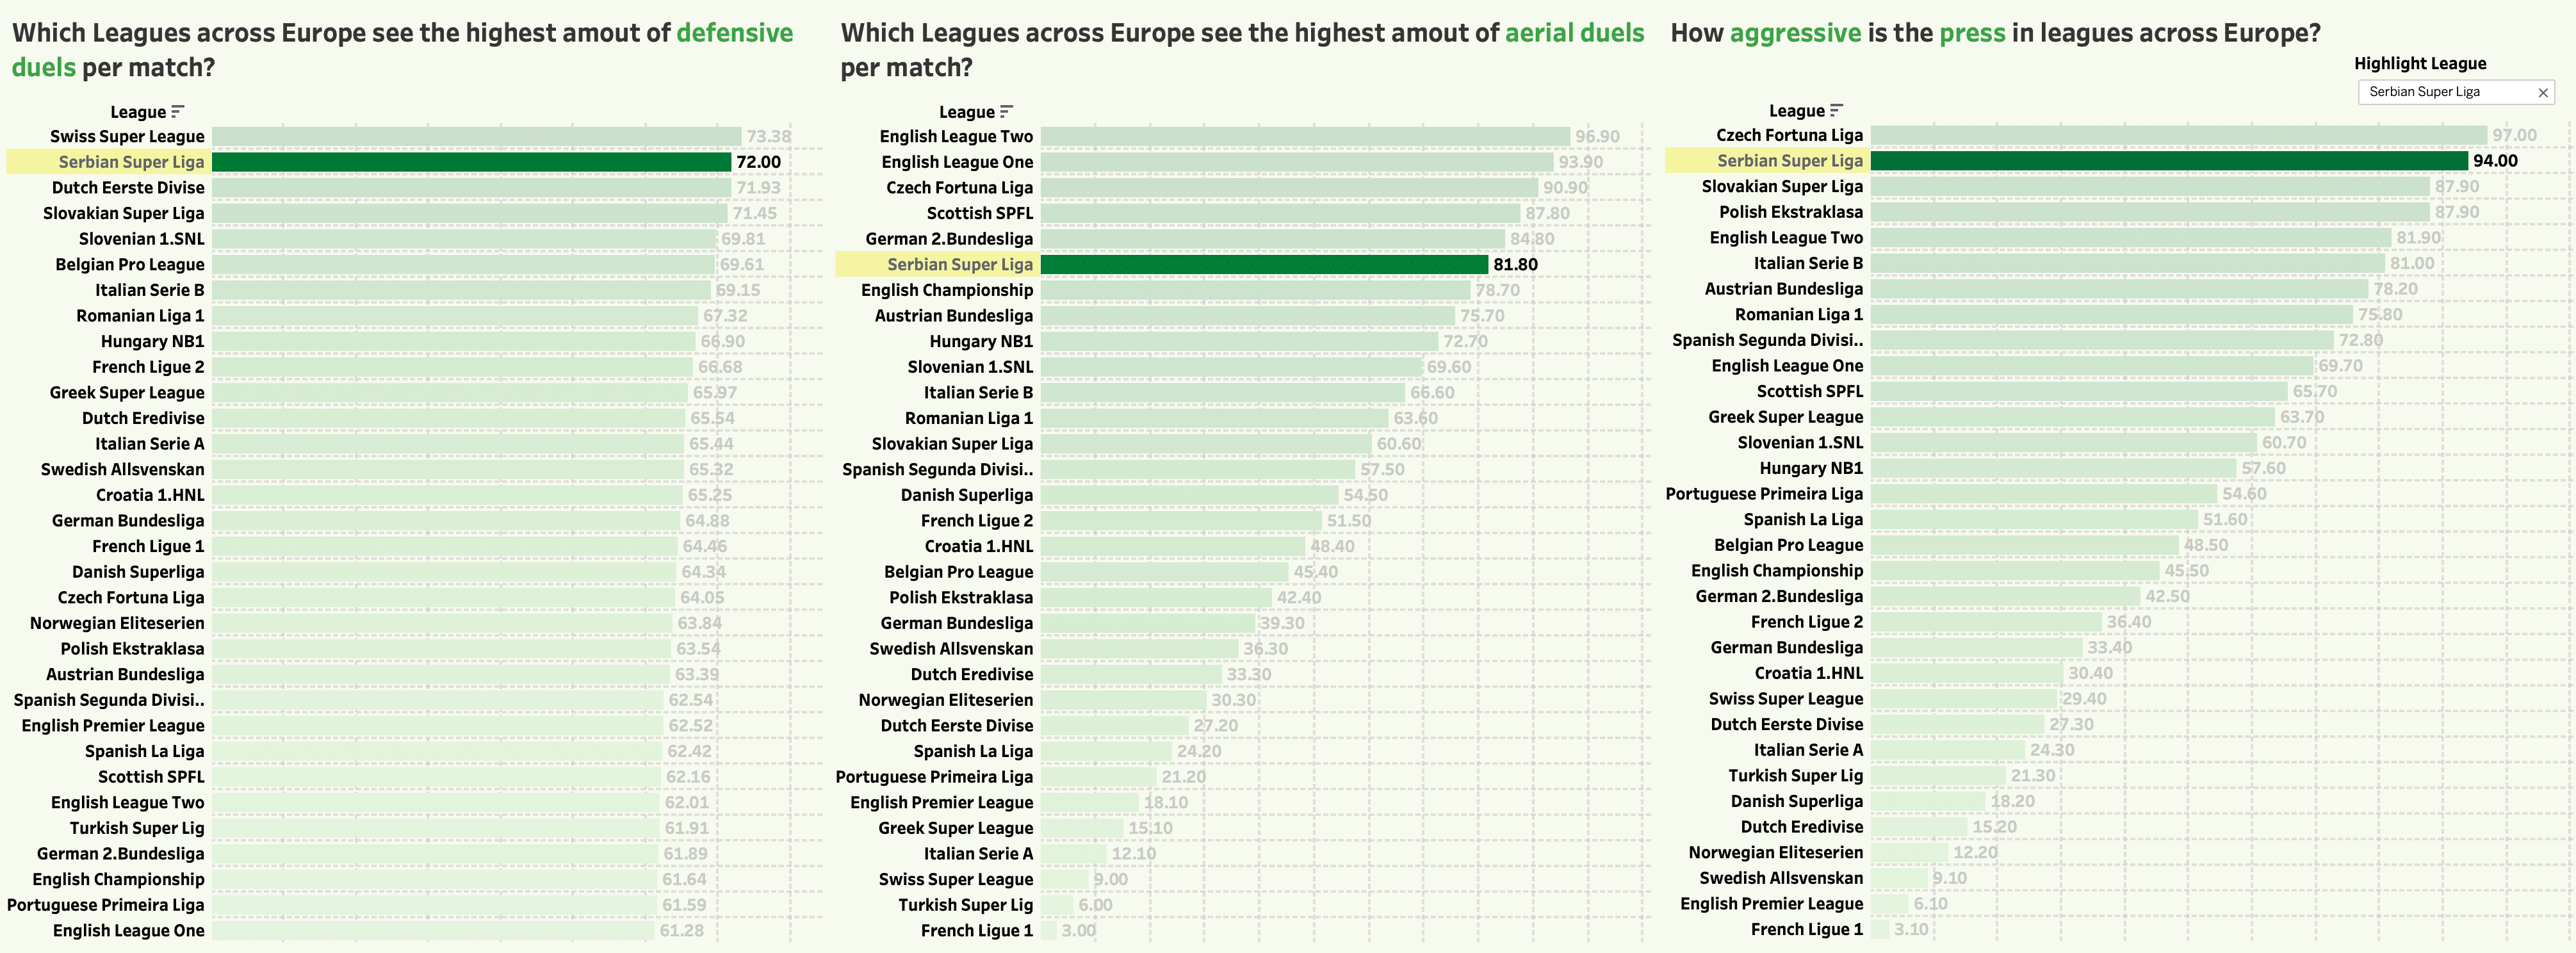
Alongside our basic rankings, we can use a simple highlighter to assess where leagues fall across all of our key metric areas. The Serbian Super Liga serves as an interesting example given that it ranks no lower than 6th across all three areas and 2nd for defensive duels and PPDA. Once again, if I am in the process of building out a recruitment process this market immediately becomes one that we are interested in when it comes to recruiting defensive-minded players.
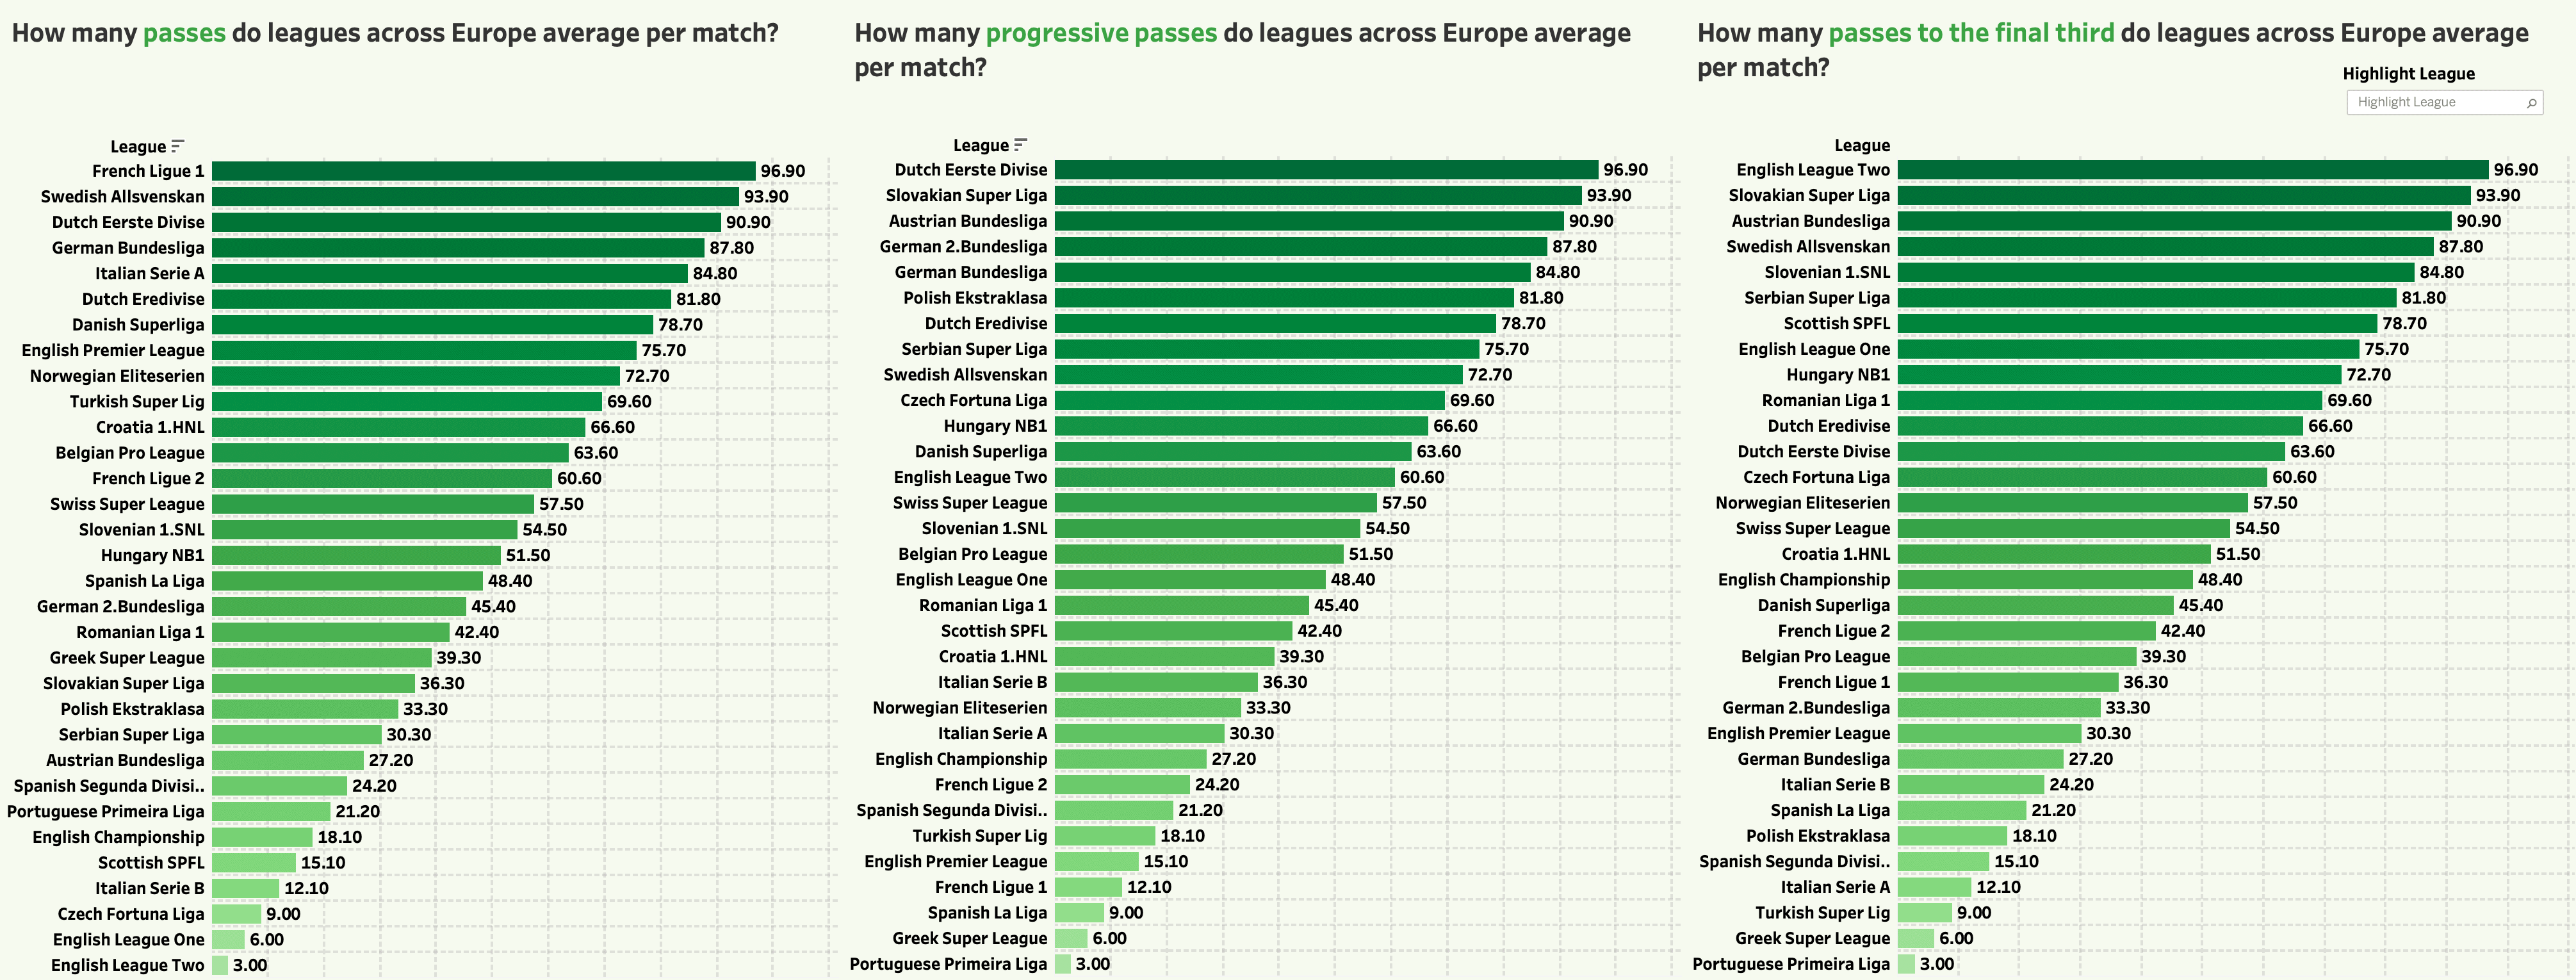
Next, let’s look at passing metrics across all leagues. As you can see the French top-flight averages more passes per 90 than any other league in our data set while League Two in England averages the fewest. When it comes to progressive passes per 90 the Dutch Eerste Divisie is top with the Portuguese Primeira Liga at the bottom. Then on to passes to the final third per 90 where League Two in England is top with the Portuguese top-flight, again, at the bottom.
These rankings allow us to start assessing how clubs in the markets that we have in our data set use the ball but they can be deceptive if you do not assess them correctly in terms of getting insights. Take League Two in England as an example. We might like the fact that teams tend to be vertical and aggressive in terms of gaining passes into the final third but we also know that they are dead last in terms of passes per 90. Does this mean they are vertical in their approach or just long? There is a big difference between the two.
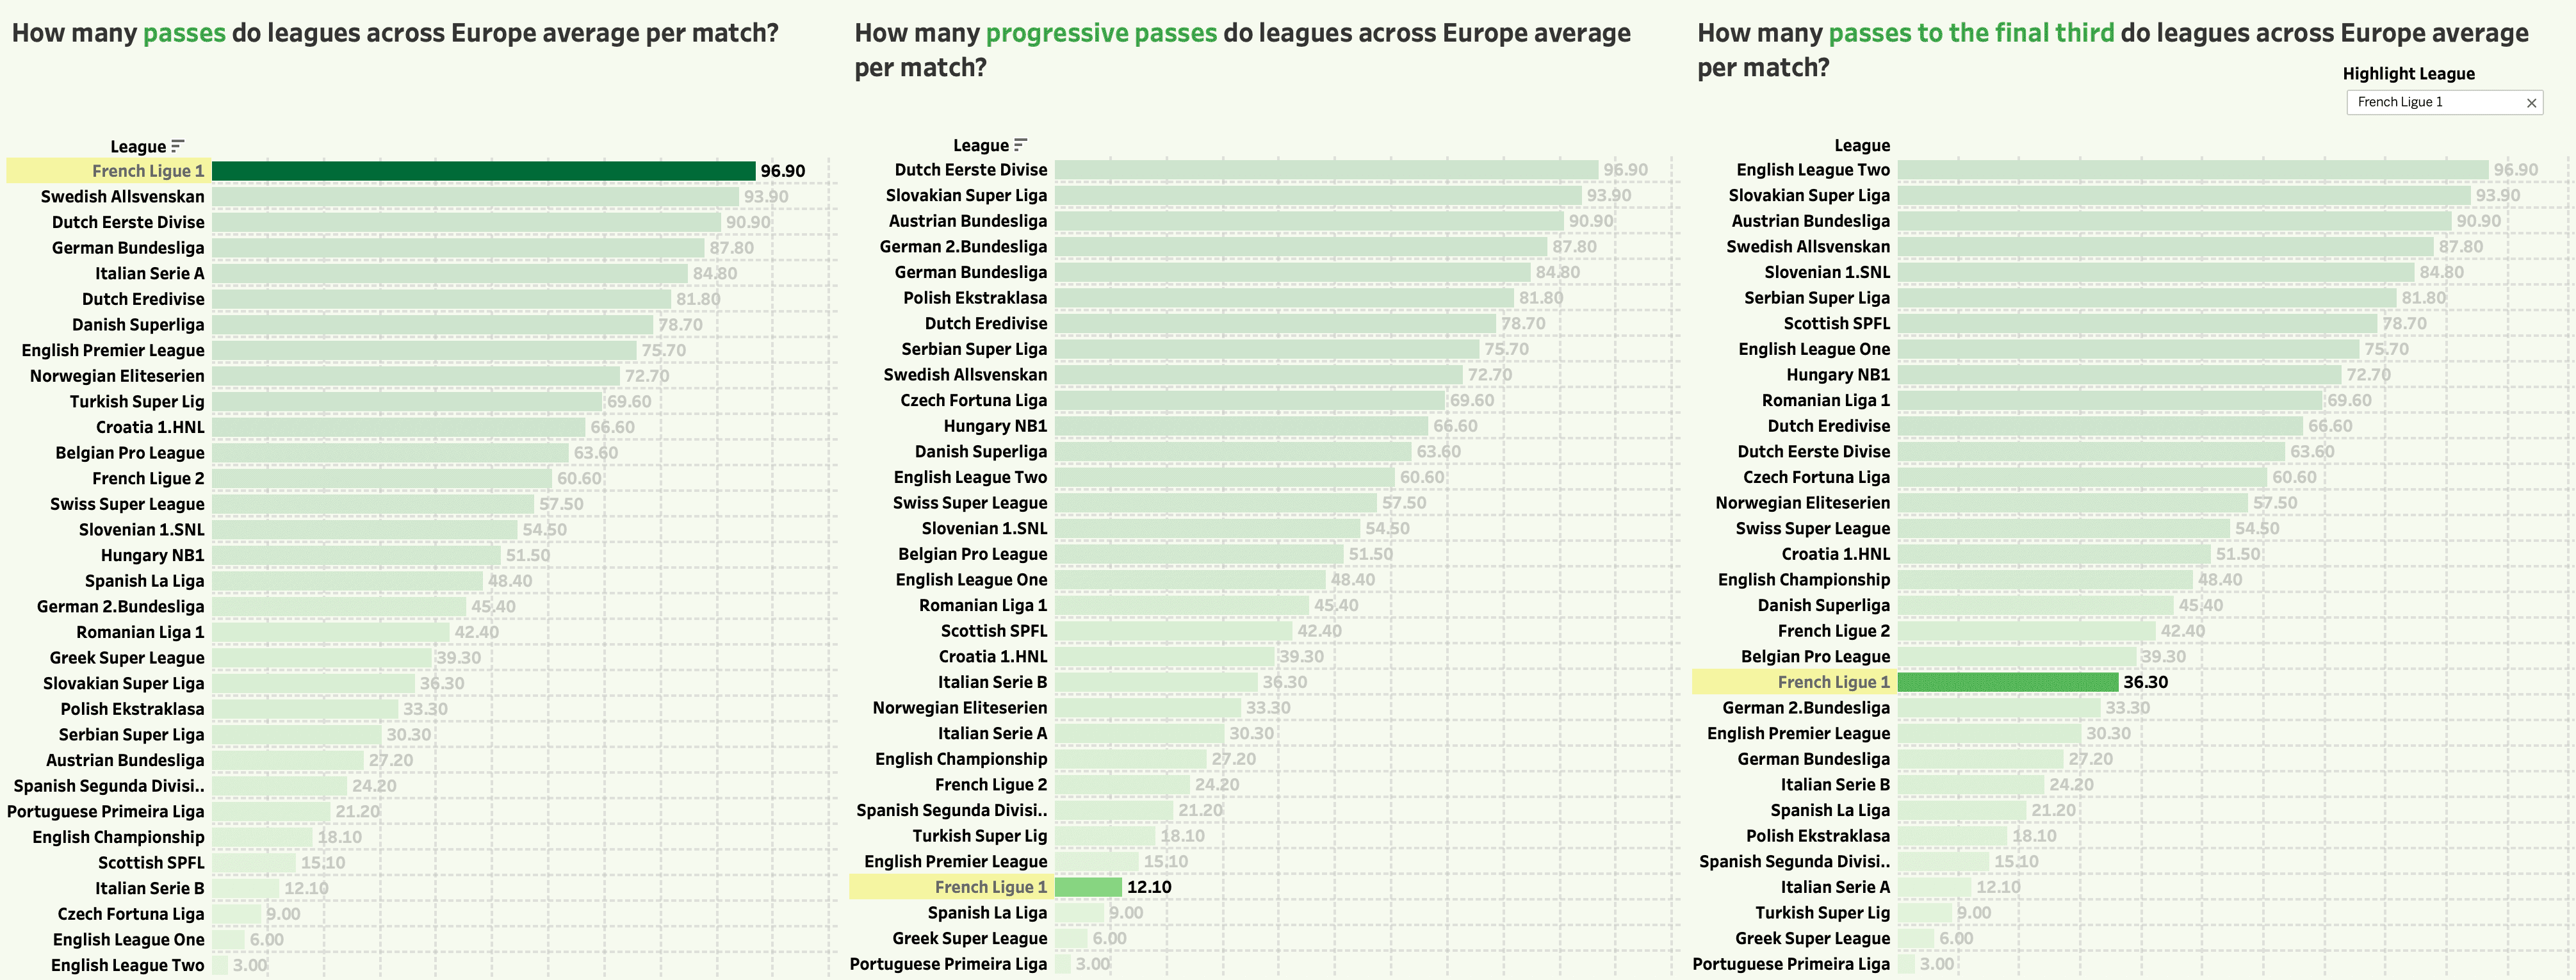
Let’s use the highlighting tool again to showcase the importance of insights in the process. We might be impressed that the French top-flight ranks highest for passes per 90 when considering potential loan markets for a young and promising midfield player. When we move across our rankings, however, the picture begins to change as Ligue 1 ranks fourth from bottom in terms of progressive passes per 90 and in the bottom half of our ranking for passes to the final third per 90. Now, unless we also play a very possession focussed style with little interest in penetration with the ball this is not a league that makes a lot of sense from a loan perspective as generally, teams are not vertical and progressive in their approach.
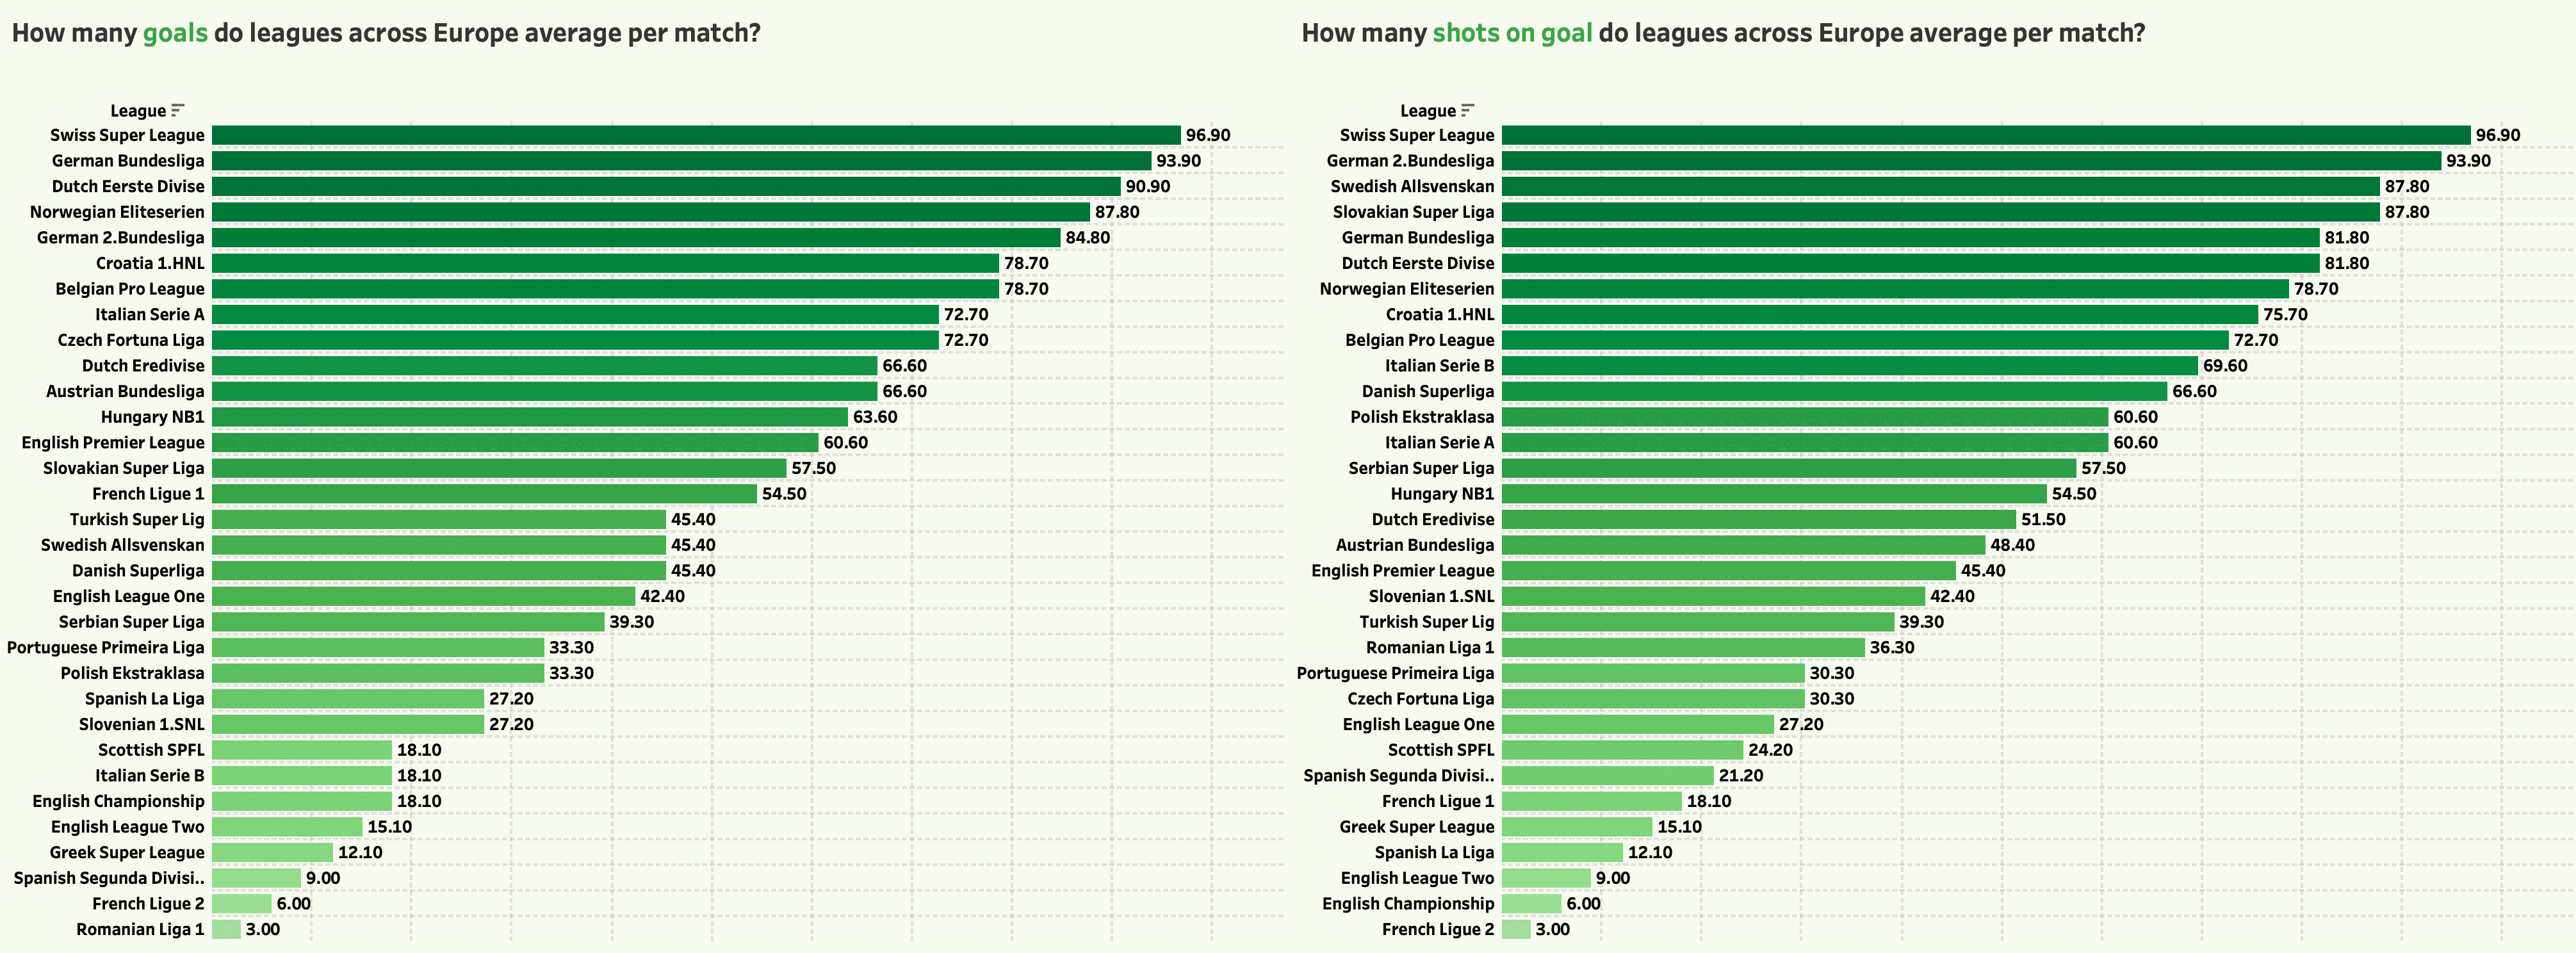
Next, let’s look at a couple of attacking metrics to see which leagues across Europe generate the most excitement for their fans. The top-ranked league both in terms of goals per 90 and shots per 90 is, somewhat surprisingly, the Swiss Super League, While the Romanian top-flight ranks lowest for goals per 90 and the French second-tier ranks bottom for shots per 90.
Once again, if I am looking to an attacking player as part of the recruitment process I might look at these rankings and pick out two or three of the markets at the top of each example.
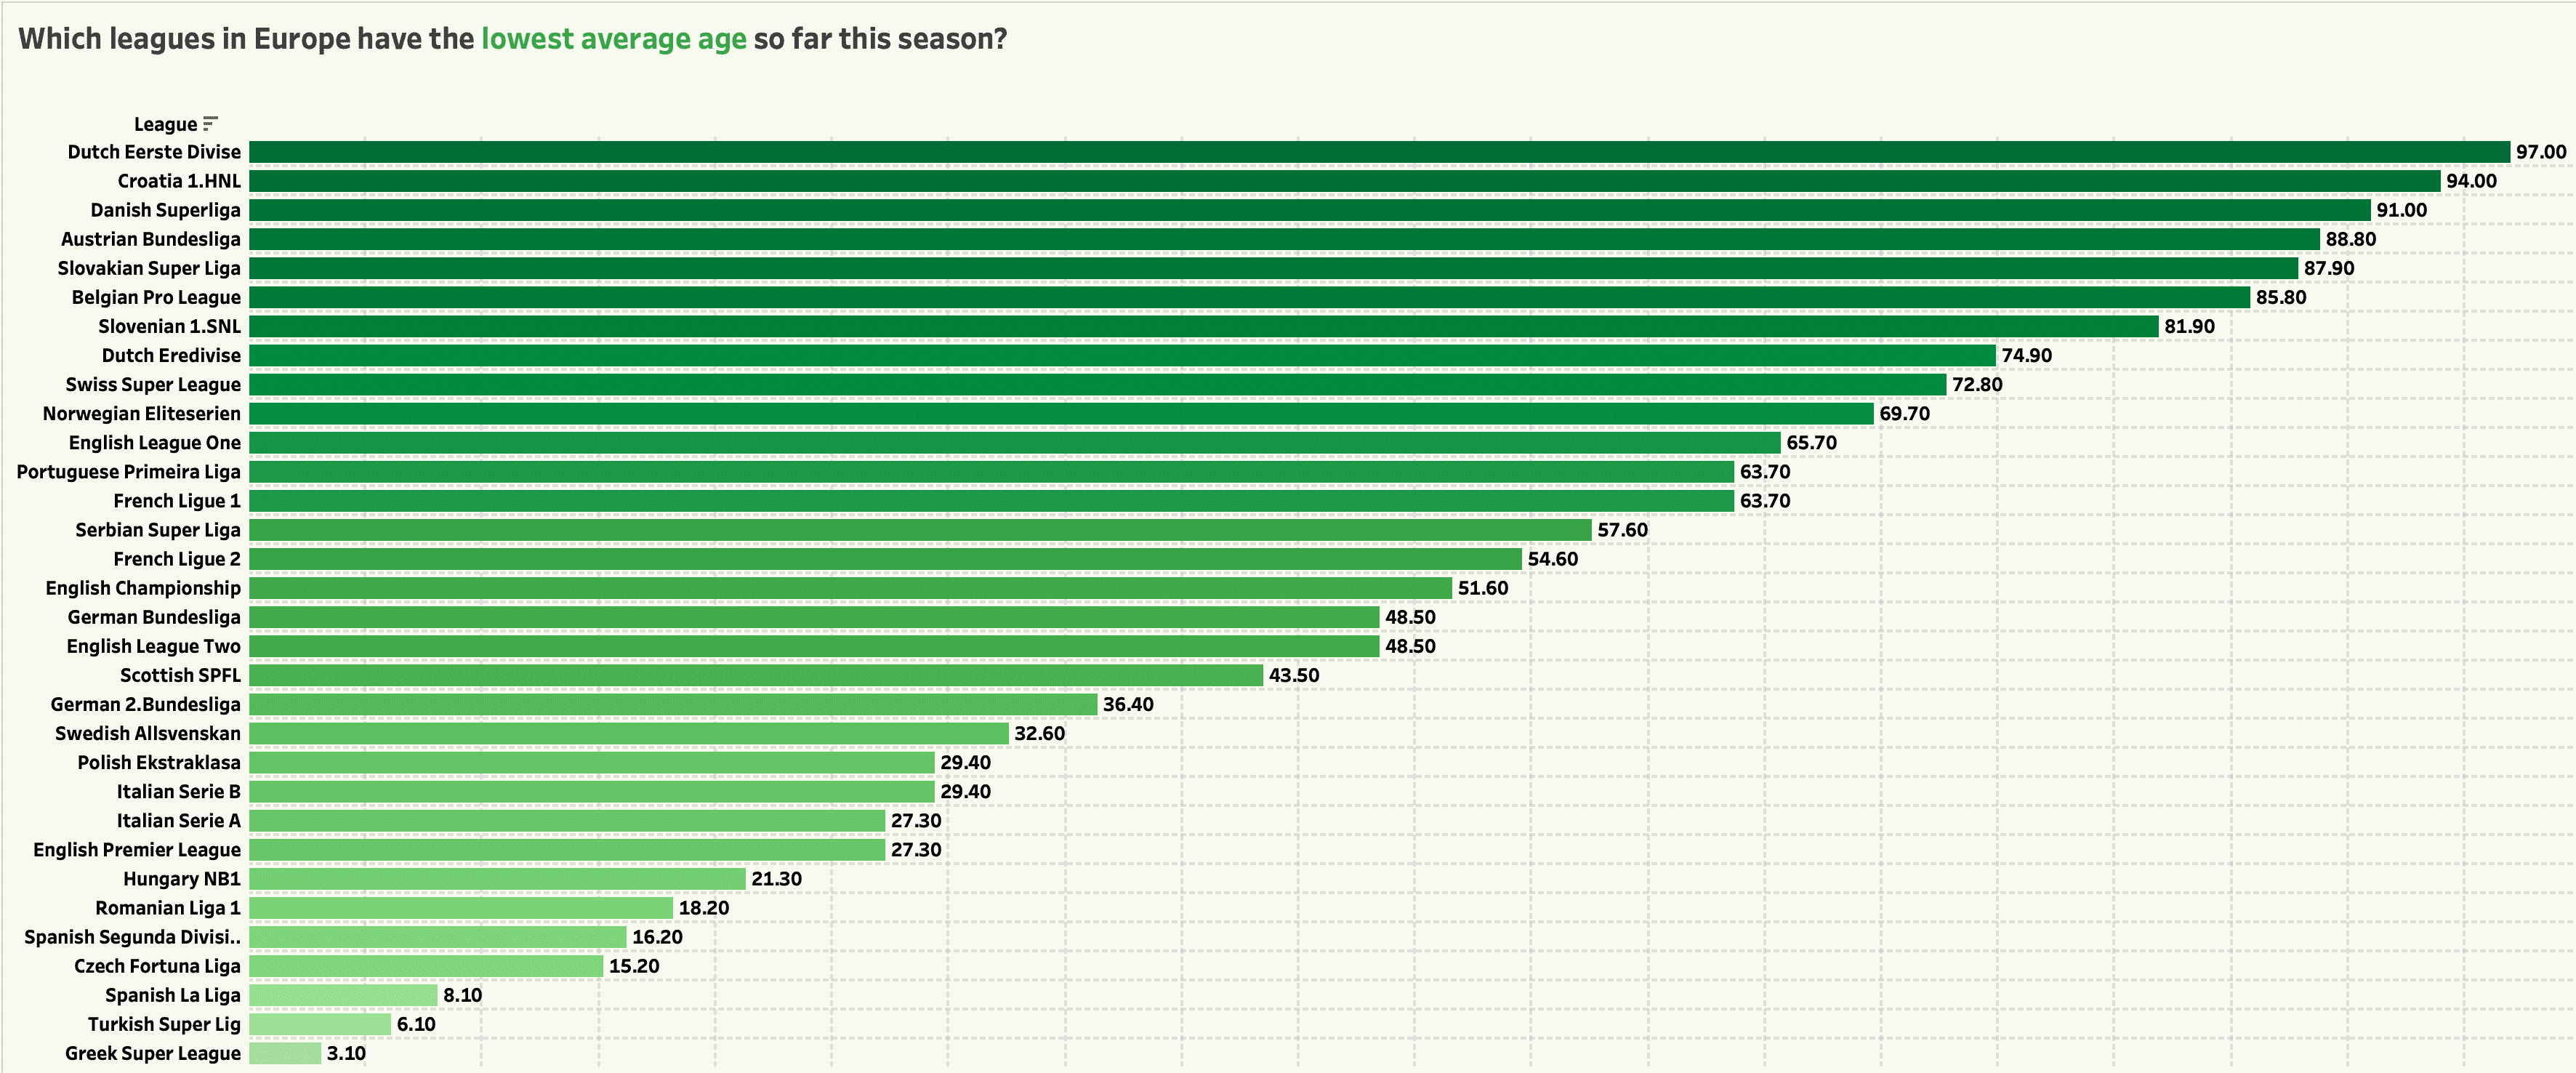
Finally, let’s assess markets in terms of the league average for average age across all of their teams. Once again I have inverted the percentile ranking so that the leagues with the lowest average age rank at the top with the highest percentile ranking, There is perhaps little surprise with the top 5 here with the Dutch second tier (very young and very open) ranked top followed by the top flights of Croatia, Denmark, Austria and Slovakia. All of these are traditionally seen as markets that produce young players but now we have the objective data to support this theory. This means that when we are looking to recruit young players we will ensure that these markets are included in our process from the very start It also means, however, that if we are looking to loan out young players we are aware that these markets are likely to be destinations that would allow our players significant playing time as any part of a loan deal.
Conclusion
I have to be really clear at this point that this is only part of the process and it is a method that I would use in the early stages of any planning process for player recruitment or player trading in terms of loans. From this point on I take the data in the rankings and then perform more deep analysis of each individual market in order to fully understand the market before we start the recruitment process. I would also add that for the purposes of this article I have only used very basic data to provide an example. I tend to use more complex data with far more than three examples in order to fully identify and target the markets that are most interesting to my club as a part of the process.
If you would like to learn more about how Total Football Analysis Pro help clubs, agents and players with all things scouting and analysis go here.




Comments