For every game of football played, thousands of statistics and metrics are obtained. Analysis companies from all over the world monitor the action closely, each measuring the match in granular detail. But with so many stats now to choose from, how can we tell which ones are actually useful and which ones are just noise? Are the stats we are fed representative of what has occurred on the pitch in terms of scoreline or performance?
In this data analysis, I look into the usefulness of individual defending statistics to review whether they correlate to a team’s defensive performance as a whole.
What does correlation mean?
In the most general terms – without teaching the art of egg-sucking – correlation is the relationship or connection between two or more things. Finding the correlation between sets of data can help us understand how things work (or not) in conjunction with one another.
There are a number of ways to measure the correlation between two sets of data. The most common is by using the ‘R-Squared’ value. Without going into the maths behind R-Squared, it is simply a number between 0-1 that shows the variability around the mean. The higher the number the stronger the correlation between the data. Conversely, the lower the number, the less connection your data has with each other.
Below is an example of data that is highly correlated, achieving an R-Squared value of 0.86. The test cross-references a team’s Shots Against per 90 (shA90) against their Expected Goals Against per 90 (xGA90). Without even looking at the graph we would logically expect the relationship between these two metrics to be strong, as the more shots a team faces, the higher their xGA90 will be.

The results are as expected – a strong relationship between the two metrics. Notice how tightly packed each point is around the trend line, this is the measurement that the ‘R-Squared’ value is telling us.
In this article, we will be looking to find the correlation value between individual defending stats and the team’s collective defensive performance. This is in the aim of identifying the usefulness of these statistics.
The Starting point
For the data set, I have used the most frequent central defender pairing from each side in the Premier League – who have played over 900 minutes. To get a big enough sample, I have taken the data from the 2018/19 season as it’s a full season. It doesn’t matter that the data is slightly aged as the test is more about the relationship than the actual performance of either the player or team.
The first chart (below) measures each defender’s combined tackles and interceptions made per 90 minutes against the average number of shots faced by their team in the Premier League in the season.

Before analysing the results, it must be noted that the test isn’t air-tight as you may have also realised. This is because it’s unlikely that each defender was playing in all games played by their team in the season and therefore the team’s stats are not 100% reflective of that player’s performance. However, by picking the most frequently featuring defenders I have attempted to mitigate that drawback as much as possible.
The results are interesting. We can see there’s correlation – shown by the upwards trend line – but opposite to what we would expect from tackles and interceptions. The graph shows that generally, the more tackles and interceptions a player has made, the more shots their team has faced on average per game. We can see Vincent Kompany and Aymeric Laporte in the bottom left corner averaged just 4.14 and 3.68 combined tackles and interceptions per game respectively. The pair played for the second-best side defensively that season, but the individual stats don’t portray the true picture of performance on the field.
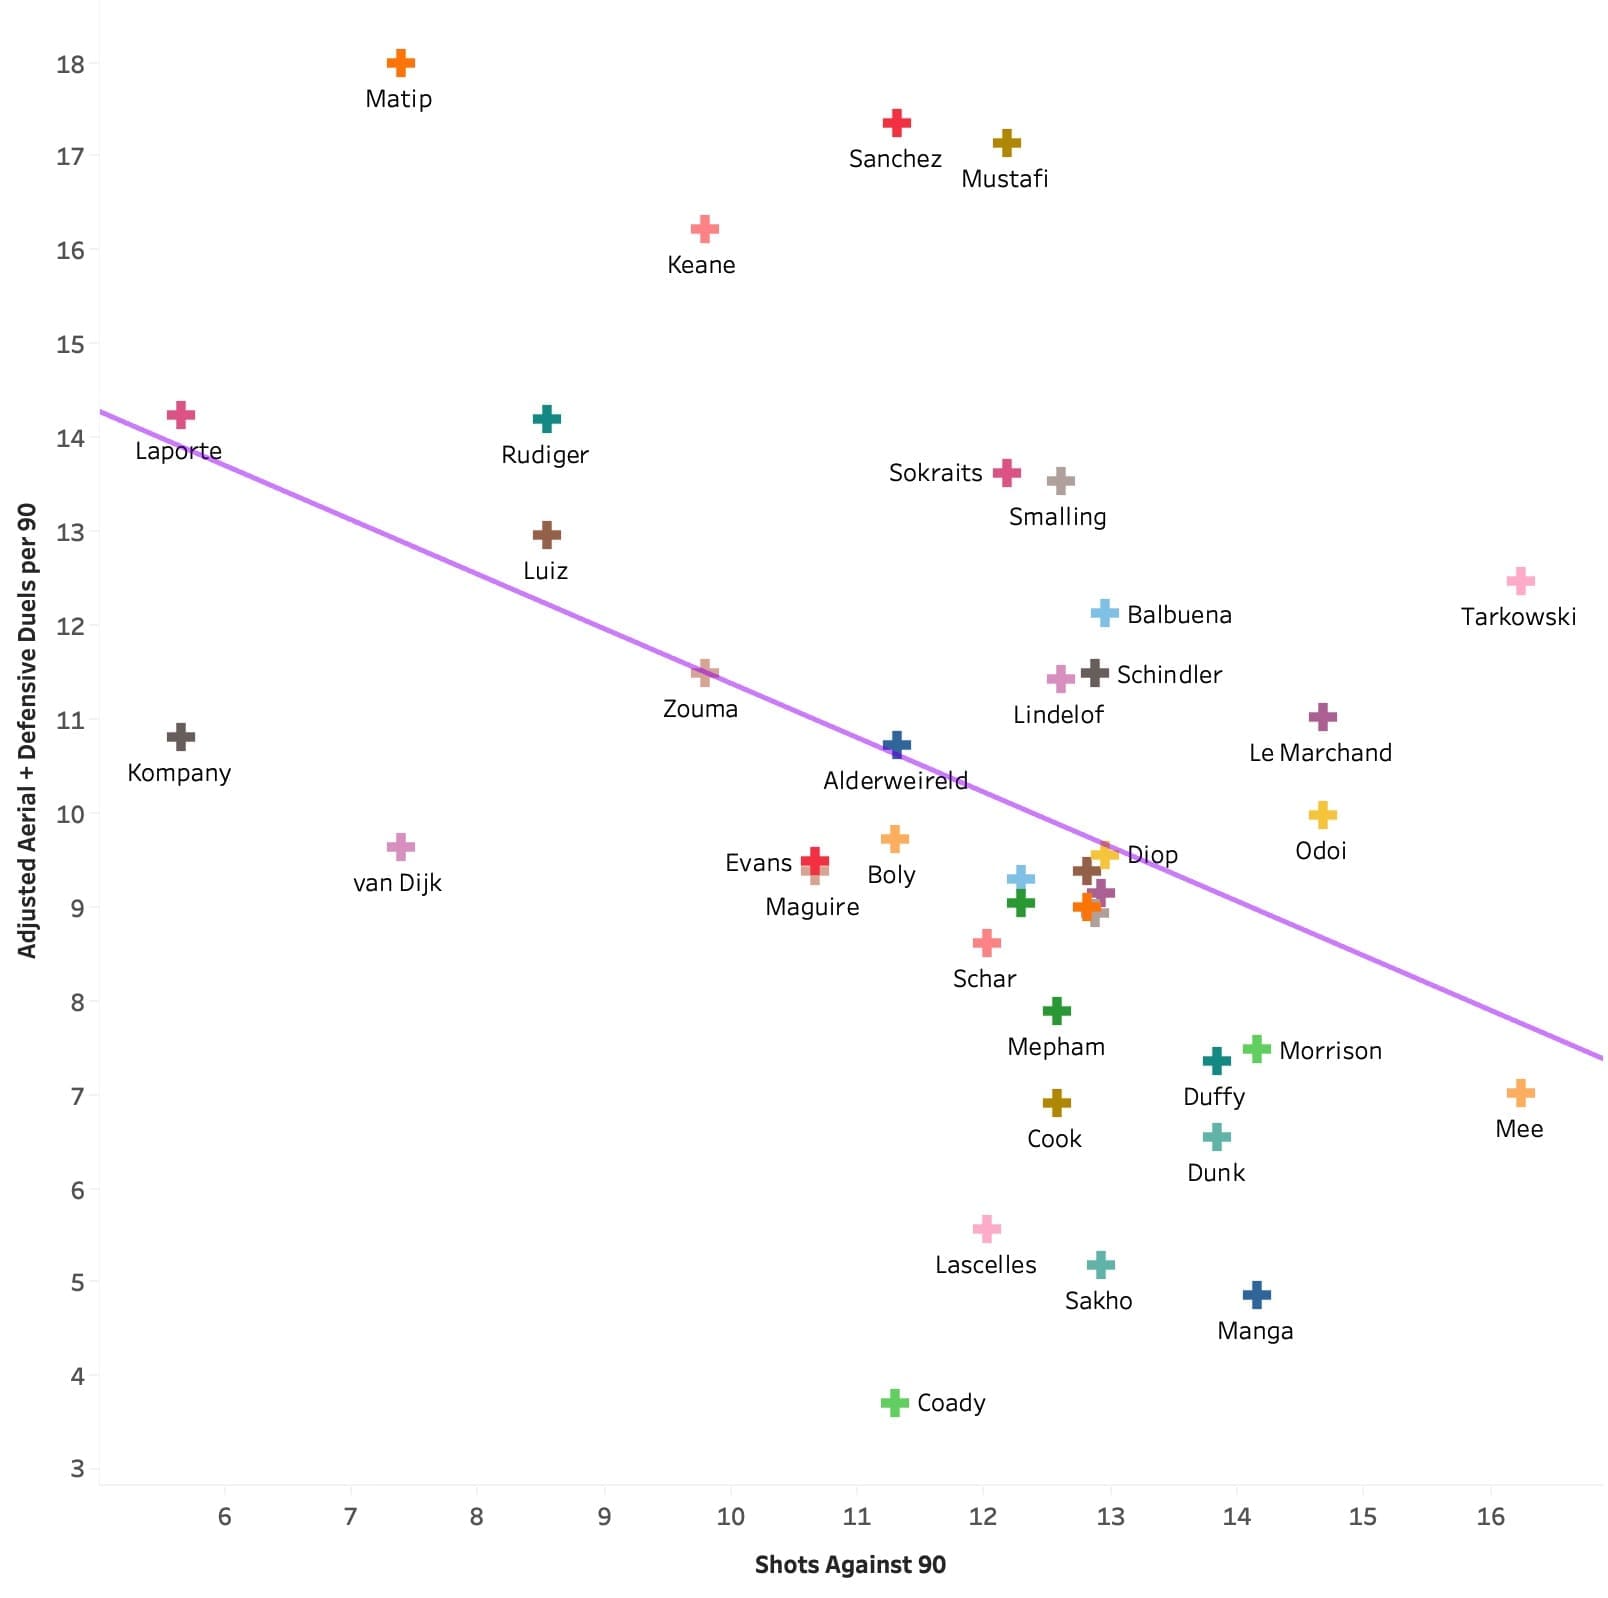
Continuing further, I chose to look at a different individual defensive metric to see if the same results occurred. This time I measured the defender’s combined aerial and defensive duels per 90 against the average number of shots faced by their team each game. Below are the results.

Again, the results are the same. An upward trend line – though not as steep – shows that the more duels undertaken by each defender, the more shots on average their team faced. What we can also notice is the R-squared value is a lot lower than in the previous test – 0.13, which tells us that the markers are a lot less concentrated around the mean, showing that the results of this test are largely sporadic and uncorrelated. This means that the number of combined duels give us no indication of how the team has performed defensively.
We can qualify that with what we can see. Connor Coady, for example, made just 4.61 duels per 90 but Wolves faced 11.29 shots on average. Compare that to Sean Morrison who averaged 17.03 duels per game (around four times more than Coady), however, his team still faced 14.16 shots per game.
I ran both tests again but this time against xGA instead of shots faced per 90, but as we saw from the first graph, the two metrics are highly correlated so the results were almost identical. Therefore, I won’t go into detail on them but you can find them below.

What’s the point?
From the tests we’ve seen that in isolation a player’s individual performance metrics don’t reflect their team’s true performance on the pitch. In fact, we’ve seen that at times they can actually have a negative relationship with the overall defensive performance.
So if we can’t wholly trust the figures, how can we tell if a defender is actually any good? How can we scout their performance, rifling through their defensive metrics and actually understand how that will impact the team’s defensive performance?
Ultimately, I don’t know the answer to these questions to the fullest extent. However, I thought that to go some way in finding an answer, I needed to look at the limitations of the statistics. This would help me gain an understanding of the problem with translating defensive statistics to a team’s defensive performance.
Firstly, the defensive metrics liberally used to promote a player don’t provide any context. They are merely counted figures that offer no insight into the type of role that defender has undertaken for their team. For example, is the defender protected heavily by two athletic defensive midfielders who never stray from position, or are they constantly left exposed by a system that favours a high line and fluid spells of possession?
By looking into the different roles a defender can play within a team’s philosophy, we begin to understand that the collection of one metric’s figures is an unfair representation of their performance. Ultimately, by just counting the quantity of these numbers we fail to account for one of the most important and influencing factors: opportunity.
Where these metrics fall short is that they measure each player as though they’re playing within the same tactical constraints – it’s a one-dimensional viewpoint. Is a player better because they’re continually playing in a system that exposes them and forces them into duels, thereby increasing their individual numbers? The answer isn’t no, but it’s also not yes either.
What’s required is a lateral look at individual performance, tied in with how they’re being asked to play within a tactic. That’s where I turned to possession adjusting.
What is possession adjusting?
Possession adjusting is exactly what it says on the tin. It’s a method used to adjust the basic statistics, taking into account the player role and opportunity levels. By adjusting the numbers in this way we aim to get a truer set of defensive figures for each player as they are representative of not only what they’ve achieved but also how many opportunities they’ve had to do so.
We could choose to adjust the statistics by any other metric, and not use possession. However, possession is one of the most indicative measures of a team’s system (not performance). In general, a team with high amounts of possession plays attacking progressive football. Compare this to teams with low possession, and in the main, they are playing a defence-focused game from a lower block – potentially parking the bus, potentially looking to counter-attack. As such, possession gives a good indication of the level of opportunity a player is likely to have had in the system they featured. It’s not a 100% accurate approach, however, in terms of detailing a side’s general approach, I believe possession is possibly the most telling and therefore the best measure of opportunity.
After studying the topic, I found multiple ways to calculate this adjusted figure. Some simple, some far beyond my understanding. In the end, I adopted my own approach, which I won’t delve into the maths behind for two reasons. Firstly, in fear of having my maths shamed by people far smarter than myself (my ego is too fragile); and secondly because the calculation isn’t the point. The point is the result and finding whether it can improve correlation with how the team actually defends on the pitch.
The results
So now we’ve discussed what we’re looking for and the reason for doing so, let’s have a look at the results.
Below is a chart that shows the impact of adjusting each player’s statistics by the amount of possession their team averaged over the season. I have used the top 10 ranked players for combined tackles and interceptions and shown their rank following the adjustment.

The first thing to notice is that nine of the top ten are defenders from teams with lower possession averages. This is interesting as it qualifies our decision to factor in opportunity exposure to adjust these stats and also that opportunity does actually impact these numbers quite heavily. If you were asked who were the ten best defenders in the league, this top ten is unlikely to match your answer.
The next obvious place to look is at the rankings following possession adjustment. Notice the impact of adjusting for opportunity levels. Fabian Schär, for example, the original number one, is now ranked 22 once we take into account the tactical system and role he played for his team. We can see that nearly all the original defenders (other than Mustafi) have dropped out of the top ten as a result.
Having looked at the rankings now let’s see how that affects our graphs. I have used the same data and tests, the only change is the possession adjusted defensive metrics have replaced the original figures. Below are the results.

The results are fascinating as the graph has completely altered. The trend line now represents one that we’d actually expect to see, with the players playing in the lesser teams – who are weaker defensively – now being assigned figures that represent their role within a tactic. We can see that the top quality defenders’ numbers now stand out following the possession adjustment. Virgil van Dijk averaged just 5.73 tackles and interceptions combined per 90, ranking him 29th in the league, which is ludicrous considering the ability of the Dutchman. Following the adjustment, the Liverpool defender now ranks in second place with an adjusted figure of 8.59.
Mustafi is an interesting case, as he achieved high numbers in a possession-focused side. This would require another article to investigate why opportunity has not impacted his numbers. There could be a number of reasons, spanning from weaknesses in my adjustment approach to the system of Arsenal leaving him unusually exposed in relation to their possession average.

The second test shows similar results. The trend line has flipped and now shows a graph representative of one that would logically be expected. We can see a lot of variation around the mean (R-Squared = 0.17), which tells us that this metric is not highly correlated to a team’s collective defensive performance, even with the possession adjustment. Despite its spread, the graph is still more reliable in terms of true defensive ability than the one shown by the original statistics.
So why don’t we just adjust all defensive statistics?
Possession adjusting is not a new concept and has been toyed with for a few years now. Naturally, people have a number of issues with the method, some of which I agree with, others I don’t.
Firstly, we’ve seen that adjusting the figures in accordance with a team’s possession still doesn’t provide a good correlation with a team’s overall defensive performance, so in that respect, it falls short. What it does do, however, is enable us to see the full picture when reviewing an individual player’s performance. Just using a counted figure on the assumption everyone has the same level of opportunity is, from one perspective, inaccurate. That’s not to say base figures are useless, as they’re not. 15 interceptions are still 15 interceptions, even without tactical context we can conclude that requires a certain level of defensive ability to achieve.
The possession adjusting method also involves a lot of variables. It assumes that possession is the decisive factor in establishing a player’s opportunity exposure. As I explained before, it’s a strong indicator but it’s not foolproof, and that can put people off as the figure becomes a little too far from reality for their liking.
Furthermore, there are a number of ways to arrive at a possession adjusting figure. This is complicated and differs from method to method. Therefore, someone writing the same article as this could arrive at different conclusions based on their approach to possession adjusting. For me, that’s part of the fun and clubs with the most accurate method can create themselves an edge by using their formulas to identify attributes others cannot see.
Finishing Thoughts
I personally don’t think there’s a requirement to pick a side. I think both the original statistics and the adjusted figures provide useful information in their own right, it’s just a case of understanding what it’s telling us and how we use it that’s important.
Despite not solving the link between an individual’s defensive metrics and a team’s defensive performance, this article has highlighted that there is an ocean of variables, context and factors underneath every simple statistic collected. We’ve seen that we have to be careful in quoting numbers to support our assumption – something I’ve also been guilty of – without realising the limitations and context are not always included.
We must realise that each metric should come with a warning label telling us that before being used to measure the ability of a player, we must take the multitude of key factors into account. Whether it’s the tactics, role, and opportunity exposure a player faces, we cannot compare players as though they’re part of the same system, as it simply isn’t the case.


Comments