The life of a Newcastle fan can be a tough one. When the club decided to part ways with Rafael Benítez, many fans were extremely disappointed. And when the club introduced Steve Bruce as the new coach many fans feared the worst. However, at the end of the season, Newcastle finished in a respectable 13th place. Whilst the football may not have been electrifying, Bruce achieved what he set out to do.
Many Newcastle fans are also disappointed in how the club is being run from the top. The previous months brought about renewed hope for fans. The possible takeover instilled this hope, however, this now seems to be on the rocks. Newcastle did spend in the summer, splashing around £65 million, primarily on Joelinton and Allan Saint-Maximin. However, the sale of Ayoze Pérez did feed half of this amount. So, what direction are Newcastle heading in?
This data analysis will use data and statistics to evaluate why Newcastle may be in trouble next year. The analysis will use a data-driven approach instead of a tactical one.
A tough season ahead?
This data analysis is built primarily on the idea of the xG philosophy, and more specifically xPts (Expected Points). Every match played is given an xG scoreline, which effectively sums the number of goals each team should have scored. The xG values are calculated by taking the likelihood of that chance resulting in a goal. If a team takes two shots in a game, and each has an xG value of 0.25, we could expect that team to score 0.5 goals. Now, of course, scoring 0.5 goals is not possible. However, it suggests that the team created limited opportunities, and therefore analyses a team’s overall performance, not just the goals they scored.
Some teams exceed their xG values in a game, and some are way below. This can happen for a whole host of reasons. This analysis is going to use the xG data to calculate how Newcastle performed as a team. This will be done using xPts. xPts is calculated by taking the xG scoreline from each game and placing this in a simulation. This simulation will run thousands of times to determine the probability of each team winning, drawing and losing. Therefore, providing us with an xPts total.
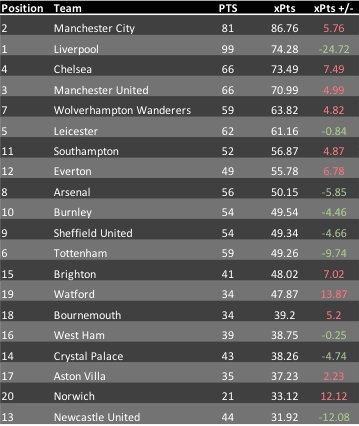
The above graphic uses data supplied by Understat and provides sobering thoughts for Newcastle. We can see above how the Premier League table would look if results were based on xPts. Newcastle United amassed the lowest xPts in the whole league, only achieving 31.92. In real terms, Newcastle actually achieved 44 points, meaning their xPts was a staggering 12.08 less than their actual. This is the second greatest difference, behind Liverpool’s -24.72. Interestingly, only one team in the relegation places of the xPts table, was relegated. Norwich City achieved 21 points from an expected 33.12, suggesting they possibly weren’t as bad as the final league table suggests.
So, what does this table mean for Newcastle? Well on the surface it would suggest they were one of the worst teams in the league last season. There are several reasons why Newcastle may have managed to stay up, which we will highlight later on. Firstly, we will consider Newcastle as a team, before moving on to individuals. This low xPts value suggests they either create few opportunities or concede a high number. This part of the analysis will use team-based statistics to look at the type of football Newcastle played last season.
Style of play
It is not an unknown fact that Steve Bruce has his team play in a certain way. Whilst, this may not be enjoyable for some fans, Bruce is usually effective in what he does. However, convincing Newcastle fans this may be somewhat difficult. Throughout the season, Bruce opted for a 5-4-1 formation, using this 47% of the time. This preferred formation seems to limit the type of football they play and provides some damning results.
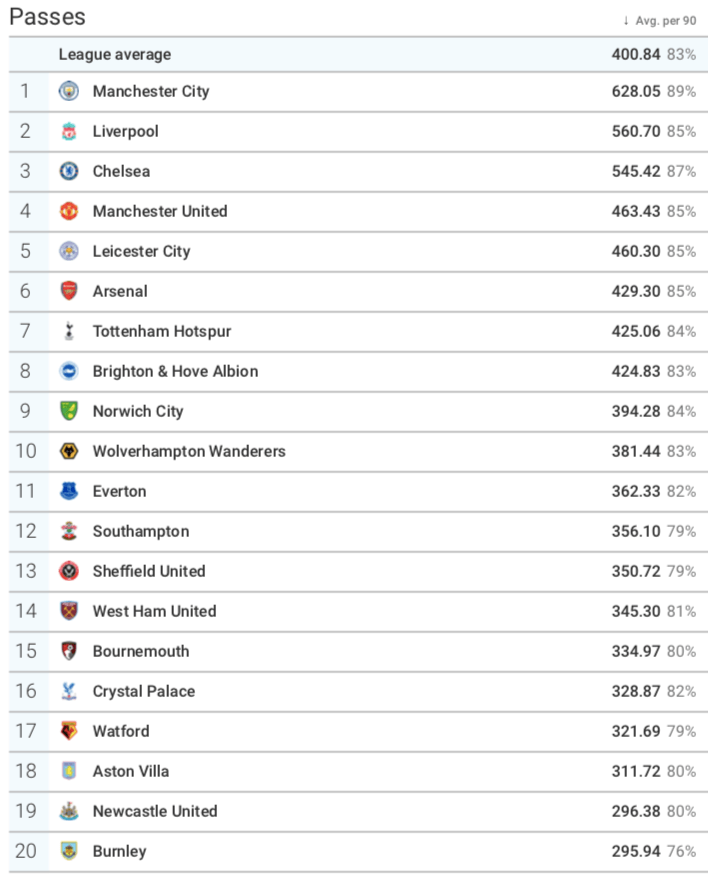
Unsurprisingly, Newcastle sit towards the bottom when we look at the number of passes this season. Bruce’s men only average 296.38 passes per 90. Only Burnley had a lower number with 295.94 per 90. Whilst these statistics are pretty worrying for Newcastle, it becomes a lot worse when we look at their possession statistics. Newcastle averaged the lowest possession this season with 39.3%. These issues were apparent early on in the season. In a home game against Brighton, Newcastle only had 29.3% of the ball. This is significantly low for a team at home against a bottom-six side.
When possession statistics are used, people often refer to Leicester’s title-winning season. They did the unthinkable and finished the season with only 44.8% possession, the lowest to ever win a Premier League title. This Leicester team had a clear identity of counterattacking and used it very effectively. Therefore, it would be unfair to not look at Newcastle’s other means of attacking.
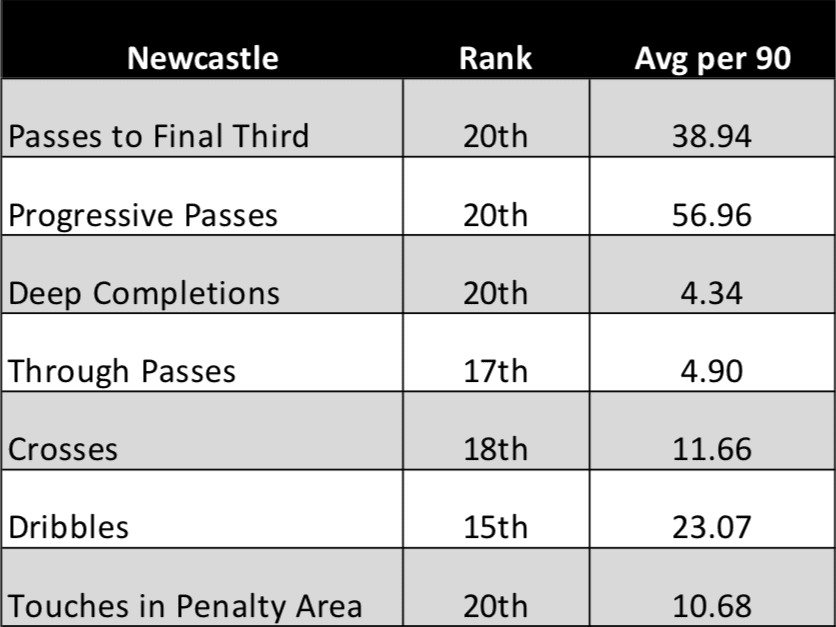
The above evidence certainly does not shower Newcastle in glory. They rank 20th in many of the attacking metrics. This data would imply Newcastle were by far, statistically, one of the worst teams in the league. Worrying signs for the Newcastle fans would be the lack of creativity. They only averaged 38.94 passes into the final third, and had 10.68 touches in the penalty area, per 90.
The data analysis so far has looked at where Newcastle seem to have issues and to be frank, there’s a lot of them. However, Newcastle ended last season with 44 points and were way clear of the relegation zone. There must have been certain factors that kept them up and allowed them to over-achieve. One reason could be luck. However, luck is not too easy to measure. So, we will focus on individual and collective displays to examine how Newcastle kept their head above water.
Goalkeeping heroics
Firstly, we are going, to begin with, the Magpies 2019/20 player of the season, Martin Dúbravka. Winning that accolade already shows what a big part the Slovakian played in Newcastle’s season. This section of the analysis will use statistics to examine how Dúbravka went above and beyond to keep Newcastle safe.
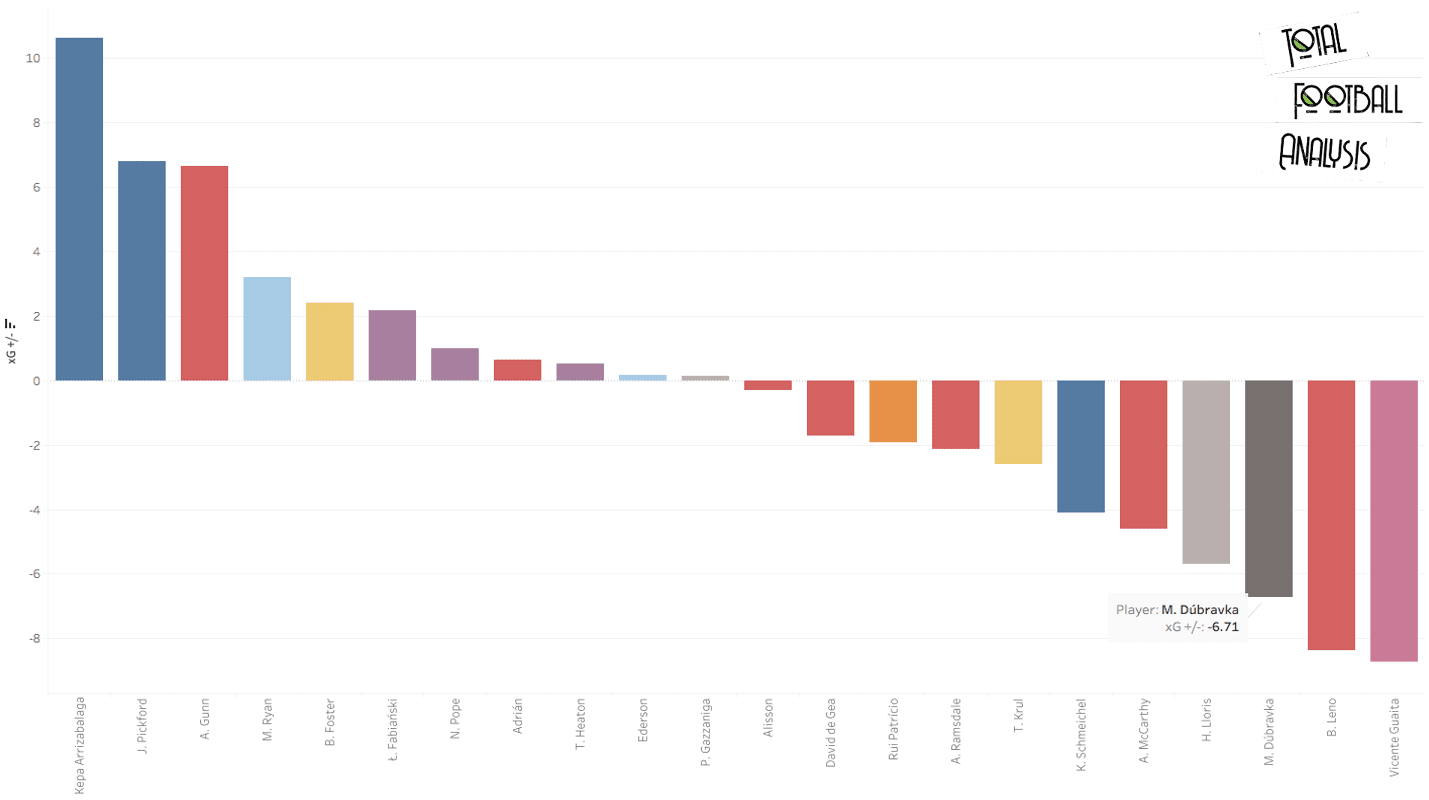
Above we have used a statistic known as xG differential. This statistic looks to compare the number of goals a ‘keeper conceded, compared to the number of goals we expected them to concede. Again, this concept uses the xG method. A positive value suggests that a player conceded more goals than expected, whereas a negative suggests they saved more than expected.
On this basis, Dúbravka was the third best goalkeeper in the league. The chart shows Dúbravka had an xG differential of -6.71. Meaning he conceded 6.71 fewer goals than expected. In real terms, the Slovakian was expected to concede 64.71 goals, however, he only conceded 58. This is an extremely large difference when we compare to the other Premier League ‘keepers. Only Vicente Guaita and Bernd Leno boast greater statistics, with -8.73 and -8.37, respectively. Unsurprisingly, Chelsea’s Kepa Arrizabalaga sits bottom of the list with an xG differential of 10.63. Meaning he conceded an astonishing 10 more goals than expected too.
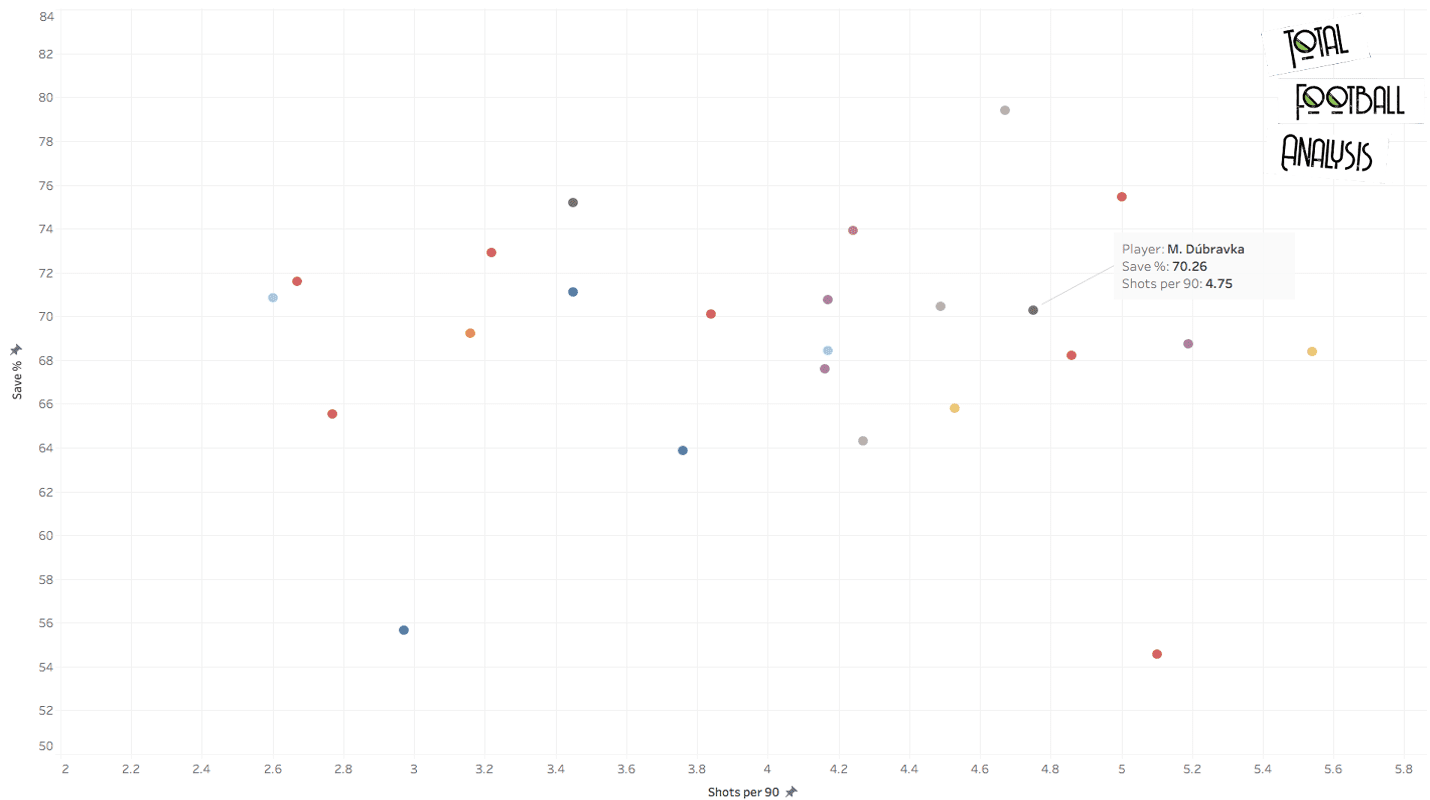
Again, we see how influential Dúbravka was. Above we see the number of shots faced per 90 and the save %. Dúbravka faced one of the highest number of shots per game with 4.75. In turn, he saved 70.26% of these. Whilst, other goalkeepers had a slightly better save %, not many faced more shots than Dúbravka. ‘Keeper such as Tim Krul and Tom Heaton faced over five shots per 90, with 5.54 and 5.19 per 90, respectively. A majority of the goalkeepers with a greater save % than Dúbravka played for a top-half team. The only ‘keeper in the bottom half with a better % was Guaita, with 73.91%, who we highlighted earlier on.
Dúbravka’s fine displays may be a key reason Newcastle bettered their xPts total. Saving over six goals could ultimately have won Newcastle six games. Therefore, allowing them to exceed their xPts.
Clinical in attack?
We have just focused on how Newcastle’s defensive display may have been the key to keeping them up. However, there is also a possibility that Newcastle had frontmen that were able to find goals from nowhere. Often strikers can score goals they are not expected to and therefore, exceed their xG values. This section of the analysis will look at goals scored and xG.
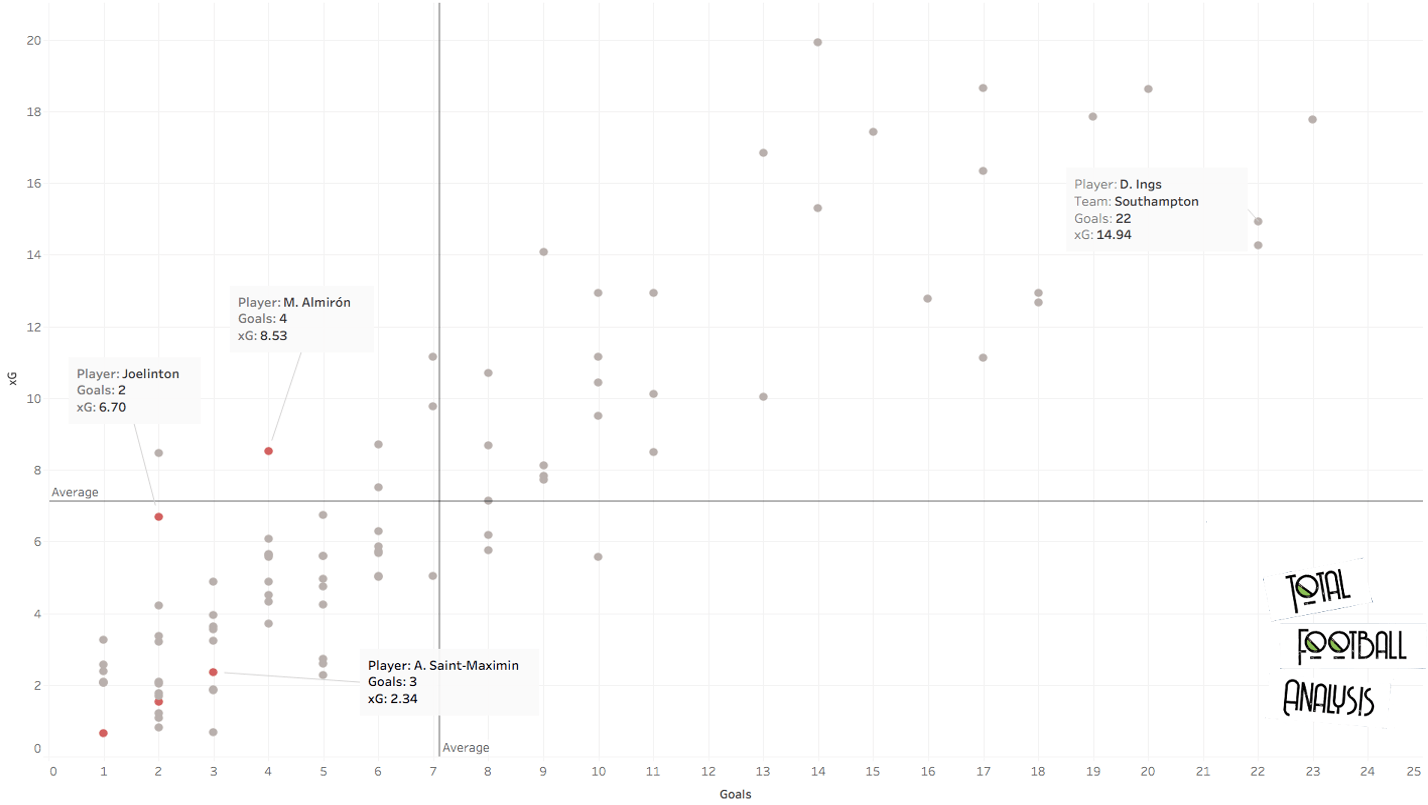
Again, the data above does not look good for Newcastle. Of their attacking players, only three exceeded their xG. Matt Richie scored 2 goals all season from an xG of 1.54. Whilst, right back/winger DeAndre Yedlin scored 1 goal from an expected 0.66. Frenchman Allan Saint-Maximin also bettered his xG of 2.34 with 3 goals. However, these statistics are hardly ground-breaking and not enough to keep a side up.
The picture gets much worse when we look at two of Newcastle’s biggest signings. Joelinton was purchased for around £40 million and big things were expected. However, the Brazilian only managed a meagre 2 goals from an xG of 6.70. This shows that the striker had plenty of chances to score goals but seemed to waste his opportunities. The scenario doesn’t get any better when we analyse attacking midfielder Miguel Almirón. The Paraguayan broke Newcastle’s transfer record at the time, however, he seemed to find it difficult to adapt to the Premier League. Whilst he finished the season strong, he only scored 4 goals from an expected 8.53. Combined with Joelinton the pair could have scored another 8 goals for Newcastle, which could really be the difference of staying up.
Danny Ings is a perfect example of this situation. In a struggling Southampton side, he scored 22 goals from an expected 14.94. Quality like this can lift a team, as he did, carrying Southampton to an 11th place finish.
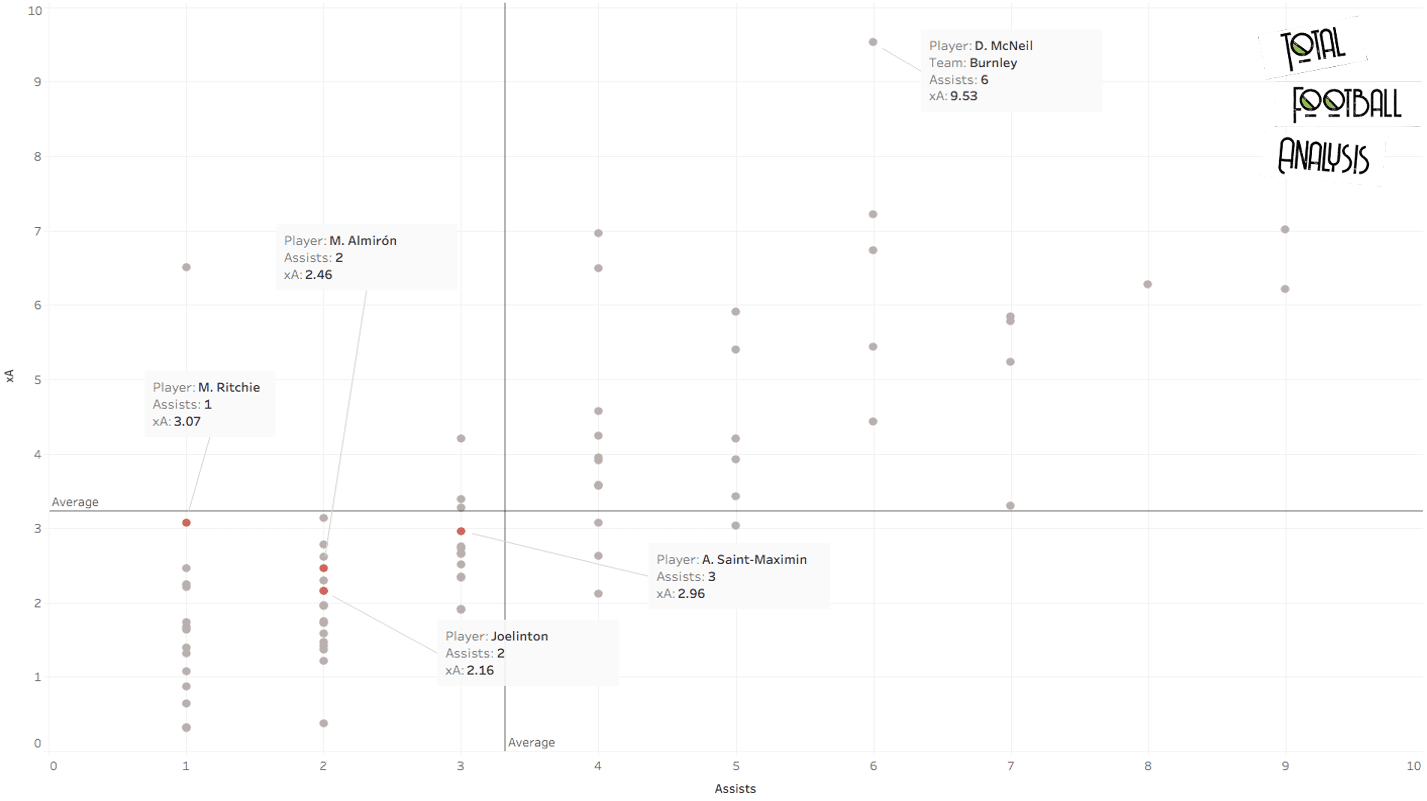
The example is very similar when we consider xA and assists. If the Newcastle attackers are going to miss chances, they would need a lot of them to score goals. Above we look at the number of expected assists and actual assists for all Premier League attackers.
Again, it does not look good for Newcastle. Unsurprisingly, very few of their players exceed their xA, which we expect from the xG data above. All of their attackers have a lower xA than the league average of 3.24. Only Allan Saint-Maximin over-achieves with 3 assists from 2.96.
Assists are very much based on your teammate’s quality, but xA allows you to see who is creating chances regardless of the assists. Matt Richie has the highest xA, of Newcastle attackers, with 3.07. However, the Scot only had 1 assist to his name at the end of the season. More than likely due to Newcastle’s lack of quality in front of goal.
An interesting piece of data in here is Burnley’s, Dwight McNeil. McNeil had 6 assists but from an impressive xA of 9.53. The winger may have been let down by his strikers, however, he shows that he was creating a lot of chances. Burnley were a team that had very similar styles to Newcastle when analysed earlier. However, this shows that when you have creative players your team have a greater chance of winning the match.
This probably feels like a bit of a bashing of Newcastle’s attacking department. However, the analysis and data show that it wasn’t a heroic campaign from a striker that kept them up. So how did they manage to score their goals?
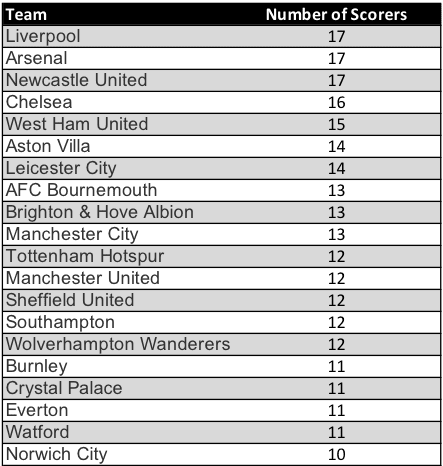
Well, it appears that Newcastle had goal scorers from a range of areas. They had a joint high 17 different goal scorers, tied with Liverpool and Arsenal. So, whilst none of their attacking players were setting the world alight, they were being saved by other players.
Jonjo Shelvey was their top goalscorer with 6, from an expected 2.24. Finally, a player who was outperforming. To add to this, Newcastle also had a lot of scorers from defensive positions. Five of Newcastle’s defenders chipped in with at least 2 goals each, picking up the slack from their attackers.
These goals from all areas would have been a key factor in Newcastle’s season. In total, they had 12 players exceed their xG total, mainly from defenders and midfielders. Therefore, this would suggest that even though their xG total in games were low, they were able to find goals and overcome this.
Conclusion
This data analysis used the xPts method to determine where teams could have finished. The data showed that on xPts Newcastle would have finished bottom of the table. However, Newcastle finished 13th with 44 points. It may be suggested that Newcastle were lucky to overcome this xPts total. This analysis aimed to use data and statistics to explain why Newcastle may be bottom of the xPts table and how they overcame this.
Firstly, we saw that as team Newcastle were bottom in several metrics, from passes to possession. They also struggled in attacking areas. This provided evidence as to why their xPts total was so low.
We saw that their ‘keeper Martin Dúbravka had an excellent season. The Slovakian saved 6.71 more goals than he was expected to, and had a save % of 70.26% This more than likely kept Newcastle in certain games.
We also used statistics to explore if they had a star striker exceeding his xG total. However, the evidence was the very opposite, with many of Newcastle’s attackers underperforming. Luckily, Newcastle had a high number of scorers, especially from defence, to allow them to score goals they probably weren’t expected to.
This data analysis provides some evidence that if things at Newcastle don’t change, they could be in for a long season. If their goalkeeper has a poor run of form, or their defenders don’t chip in with goals, they could be facing a relegation fight next season.


Comments