Atletico Madrid under Diego Simeone have been an incredibly consistent team. And this, unfortunately, is not necessarily a completely positive thing. Yes, they are continuously near the top of the pile in LaLiga and always manage to find their way to Europe one way or the other. But that’s essentially where it all stops.
Simeone has been able to create a defensive juggernaut of the Rojiblancos, so much so that their solidity in the backline is turning into a myth on its own. But despite their success and unyielding will to keep going, Atlético still seem like a team that’s content with being ‘nearly’ there as opposed to going all the way.
Their ambitions are much smaller than what an elite club should exhibit and there’s always something in the way of glory. So this data analysis will use statistics to figure what exactly is holding the Rojiblancos back and will also serve as a prelude to the second part of the analysis that will deal exclusively with tactics.
Atlético Madrid vs Barcelona and Real Madrid
The last time Atletico Madrid won LaLiga was back in 2013/14 and back then, they were also a sturdy defensive machine but were also lethal in attack. What made that feat even more incredible is the fact they were competing both against Lionel Messi’s Barcelona and Cristiano Ronaldo’s Real Madrid in their prime.
In 2019/20, however, they finished third after a valiant comeback in the second part of the campaign but would still fall in Europe as RB Leipzig got the better of them in the quarter-finals. Again, Simeone did just enough to maintain that level of consistency but just like most of the time, that consistency won’t be rewarded with any silverware.
If we analyse the very basic data, we can already see a part of their problem. Atlético recorded 70 points compared to Barcelona’s 82 and Real’s 87 along with 18 wins, 16 draws and four losses. And that’s the first thing that hits you straight to the face with Simeone – the number of draws.
They draw almost as often as they win and even though their four losses are still okay compared to Barcelona’s six or even Real’s three, the Catalans have only recorded seven draws while Los Blancos have nine. This means that Atlético have more than double the draws of Barcelona and just a couple short of double of Real’s figure. Let’s dissect them a bit further.
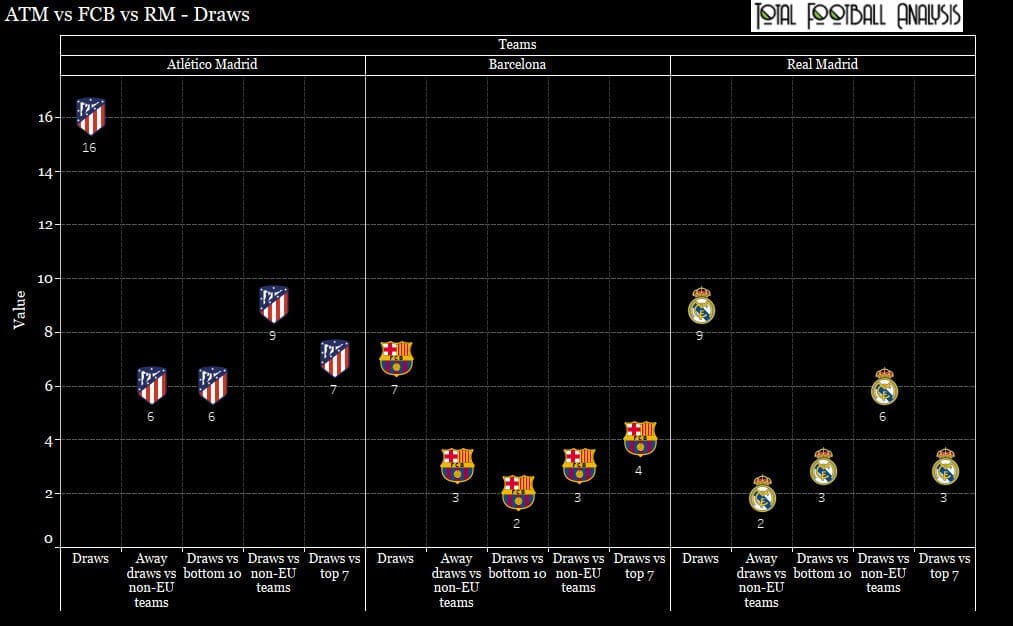
Out of those 16 draws, nine were against opposition who didn’t secure a position in Europe and among those, six were against bottom table clubs below the 10th place. Going even deeper into the data, six of those draws were away from home. This already gives us an indication of what might be at the root of their problems: they are struggling to dominate the lower-tier opposition and win the ‘smaller’ games along with having a bad record away from the Wanda Metropolitano stadium.
To visualise this issue a bit better, we have decided to tally their record against the top seven clubs and the rest of the league, which we will call the ‘bottom clubs’ for reference sake, and their record for home and away games so that we can see the difference clearly.
Apart from that, we have also decided to compare Atlético to both Barcelona and Real Madrid since they are a ‘benchmark’ for where Simeone has to take his team in order not to just be competitive but also win titles.
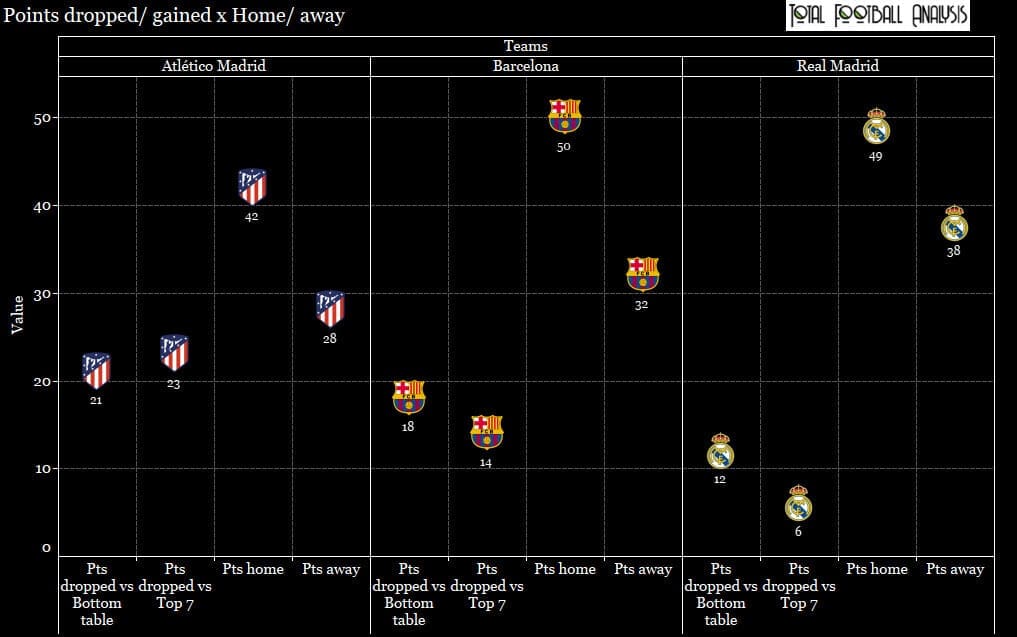
Immediately, we can see that the Rojiblancos are simply not at the required level despite both of their rivals having an average season as a whole, especially the Catalans. Barcelona are famously struggling away from the Camp Nou and yet, they have managed to amass more points (32) than Atlético (28).
The situation is similar when it comes to home games as Atlético’s 42 is not good enough when compared to Barcelona’s 50 or Real’s 49. But it’s actually where they drop points that may be of even bigger concern.
You might have noticed a very peculiar thing in the above graph. Both Barcelona and Real have dropped fewer points against the top seven than against the bottom-table teams. Of course, they have also played almost double the games against the latter opposition but this is nonetheless a pretty interesting piece of information. Atlético, on the other hand, have dropped almost the same amount of points versus top and bottom-table opposition, further highlighting that they struggle to win the ‘smaller’ games but also suggesting that despite the lower number of games, Simeone has largely failed to win against his direct rivals. This, undoubtedly, is a big concern moving forward.
But moving shortly away from the draws, let’s visit Atlético’s away games a bit more. Below is a graphic I designed to show us all the instances in which Atlético, Barcelona and Real Madrid managed to get into a lead away from home.
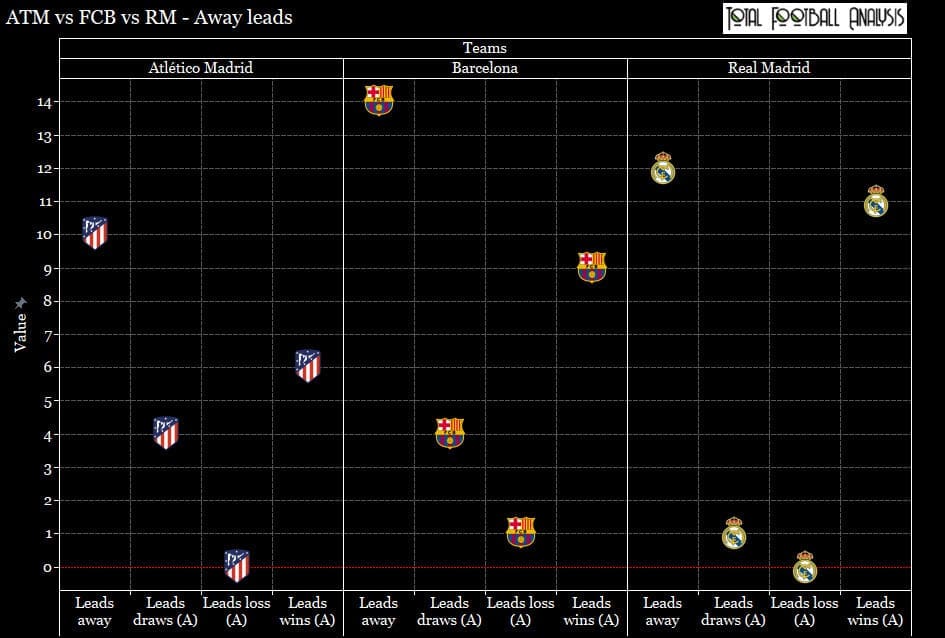
Alongside that, we can see the results they recorded with that lead with the number of games ending in either a victory, draw or a defeat. Atlético, worryingly, have amassed the fewest number of away leads in 2019/20 out of the top three teams – only 10 to Barcelona’s 14 and Real’s 12. Six of those 10 have indeed ended in a victory and four in a draw, which means they have gathered approximately 73% of all the available points.
This is, in fact, equal to Barcelona’s 73% (nine wins, four draws and a loss) but way below Real’s incredible 94% (11 wins, one draw). The positive here is obviously the fact that they were always able to get at least a point for their efforts but the fact they don’t get into leading positions away from home as often as their main rivals is troubling. Not to mention that Barcelona’s solitary defeat has also altered the data findings in their favour, allowing Atlético to edge closer. Which, considering the Blaugrana’s poor season, is not exactly a huge compliment.
The next graph will essentially do the same thing, only this time, we’ll measure away deficits. And while Atlético’s seven away deficits are worse than Real’s six, it’s still better than Barcelona’s 10, further showcasing their lapses away from home.
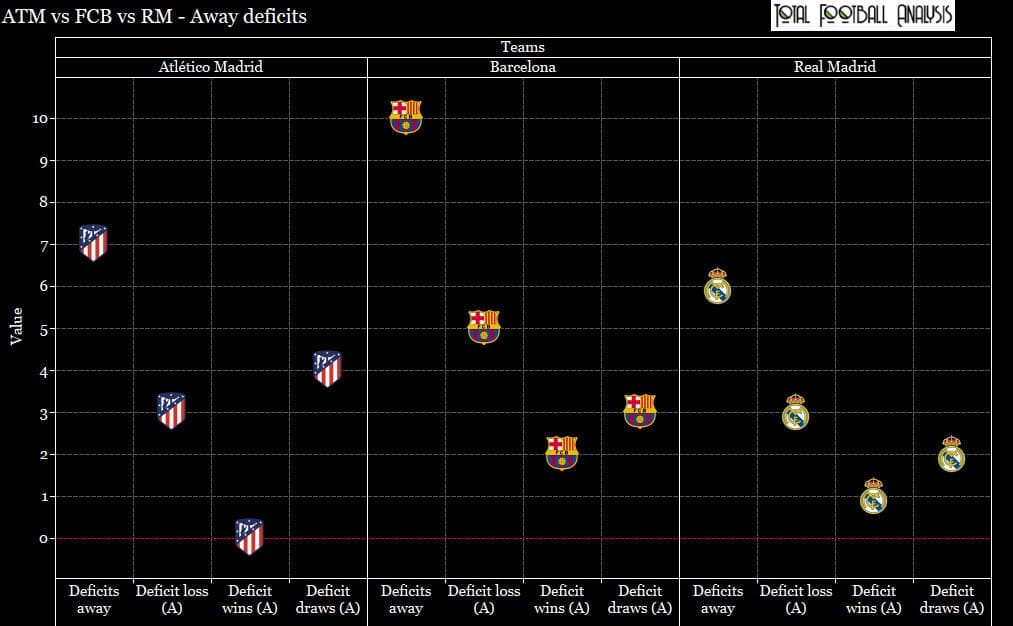
And overall, due to Simeone’s rigid defensive structure, Atlético have managed to drop fewer points (17) than Barcelona (21) in games in which they went behind. However, when we crunch the numbers a bit more, we find out that they have collected 4/21 points which gives us 19% of total available points.
This is less than Real Madrid’s 27% (5/18 points) and Barcelona’s 30% (9/30). So once again, even though they were not in a deficit situation as often, they were still not able to salvage enough points to make a difference. Why? Look at the number of times they were able to turn defeats to victories away from home? Zero.
That seems to be the backbone of their issues. Atlético Madrid simply cannot or don’t know how to chase a result properly. And yes, Barcelona’s two wins out 10 deficits and Real’s one win out of six are not overly impressive either and all three have struggled in this regard but once Atlético go down away from home, the best they can do is a draw.
Let’s analyse it a bit more and try and figure out why that is.
Atlético Madrid vs the world (and themselves)
This part of our data analysis will once again use statistics to delve deeper into Atlético Madrid’s issues last season but this time, we’ll mostly compare them to the rest of LaLiga and take a closer look within the squad to potentially find the root of the problem.
Of course, unsurprisingly, with only 27 goals conceded, the Rojiblancos have had the second-best defence in the league throughout last season. However, with only 51 goals scored, their attack could get them only as high as seventh-best, which is very worrying, to say the least. This translates to 1.3 goals per game, compared to Barcelona’s 2.2 and Real’s 1.84, which is still a far cry from the 2.0 they managed to record back in their title-winning 2013/14 campaign.
Quite clearly, it’s their ability in front of goal that is severely lacking. Let’s take one final look at another comparison between the top three teams in LaLiga, this time focusing on their distribution of goals and goal distribution by position.
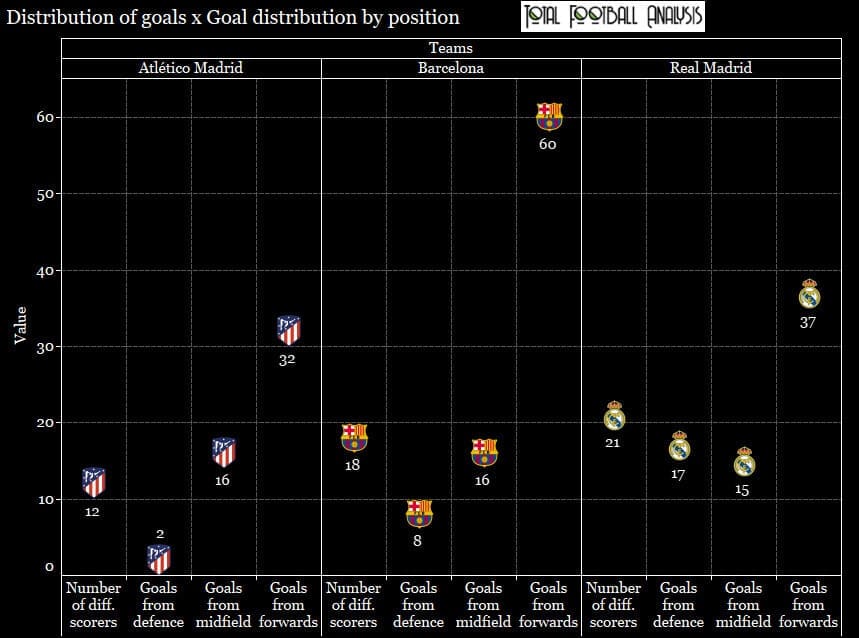
And this may actually reveal a big part of Atlético’s problem. Throughout 2019/20, they only had 12 different goal-scorers, which is only three more than Mallorca who are at the very bottom in this category with only nine. This suggests that Simeone doesn’t have nearly as many goal-scoring sources as an elite team should and this is hindering them immensely.
Dissecting their goal-scorers a bit more, we can see that even though there is a huge gap between the forwards and the rest of the squad with all three teams, there are a couple of key things to note here.
Firstly, Atlético’s forwards are not nearly as effective as they should be. 32 goals scored between them is a fairly average figure for a club of their standards. But you might say that 32 is not that far off Real Madrid’s 37 and you’d be right. But even though their midfielders are about as effective as both their rivals’, the forwards remain their exclusive source of goals, which is the second aspect we have to take note of.
Barcelona also have a single avenue with only their forwards contributing but with 60 goals scored between them and a certain Lionel Messi in the team, they can actually afford that. Real Madrid’s forwards, on the other hand, don’t score as much but both their midfield and especially the defensive line are contributing much more for that reason, courtesy of Sergio Ramos and co. So once again, they can afford having low-scoring forwards whereas their city rivals can’t.
The graph below will tell us something more about their struggles in front of goal.
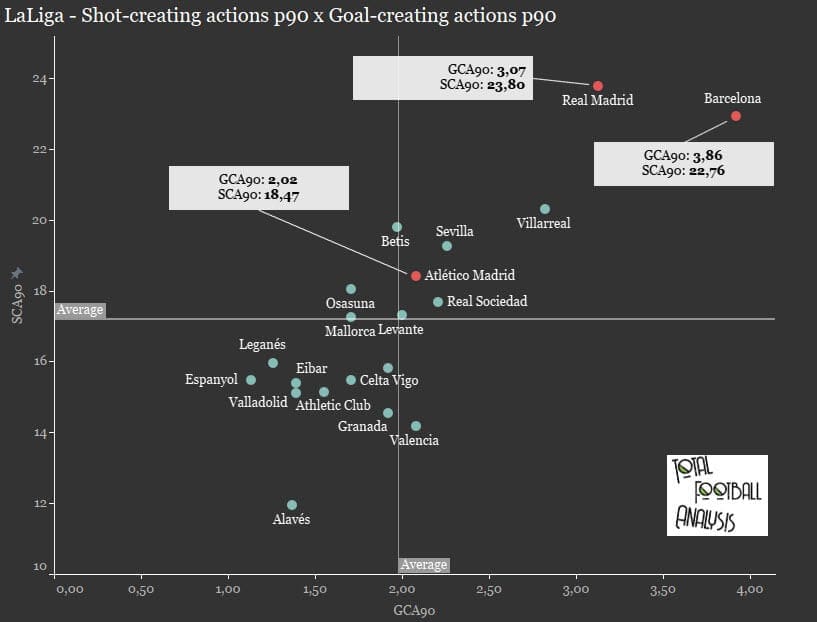
Here, we can see all LaLiga teams’ shot-creating actions and goal-creating actions per 90 minutes. Once again, I have decided to highlight all three of Atlético Madrid, Barcelona and Real Madrid for reference sake.
Simeone’s men are marginally above the average line in both metrics but not nearly among the top performers. Barcelona’s 3.86 goal-creating and 22.76 shot-creating actions, for example, as well as Real Madrid’s 3.07 and 23.80 respectively, are much higher than Atlético’s 2.02 and 18.47. Not to mention that all of Sevilla, Villarreal and Real Sociedad have better goal-scoring actions value – with the latter having slightly lower shot-creating figures – while Real Betis edge them out in creating shots.
So there are five teams better than Atlético in shot creation and five in goal creation. This represents quite a big issue since they are a team that wants to compete with Europe’s best but can’t even dominate domestically. The graph below will help us understand this issue a bit more by analysing their shots.
I have decided to use their non-penalty expected goals (xG) per shot and shots on target per 90 minutes to dissect their performance in front of goal even more.
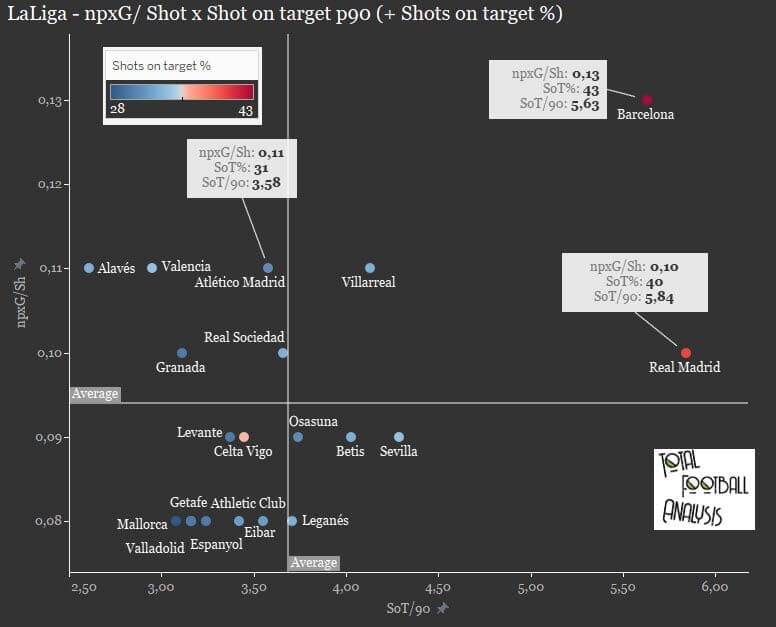
This graph essentially tells us how much danger do the teams cause per shot, as represented with the expected goal value, and how many of their shots end up on target. We can see that here, we are talking about marginal differences between the teams and Atlético’s 0.11 npxG per shot is only slightly lower than Barcelona’s 0.13 and slightly higher than Real’s 0.10.
The likes of Alavés, Valencia and Villarreal are also at Atlético’s level but Simeone’s men are below-average when it comes to shots on target per 90 minutes with only 3.58. This is significantly lower than Barcelona’s 5.63 and Real’s 5.84. Not to mention that teams like Villarreal, Real Betis, Sevilla, Osasuna, Real Sociedad and even Leganés are ahead of Atlético in this category.
It’s also significant to see that only 31% of all of their shots end up on target, again below Barcelona and Real Madrid’s own tallies. So how does that ultimately transfer to the final product? The following graph will show us all LaLiga teams’ goals minus expected goals and assists minus expected assists.
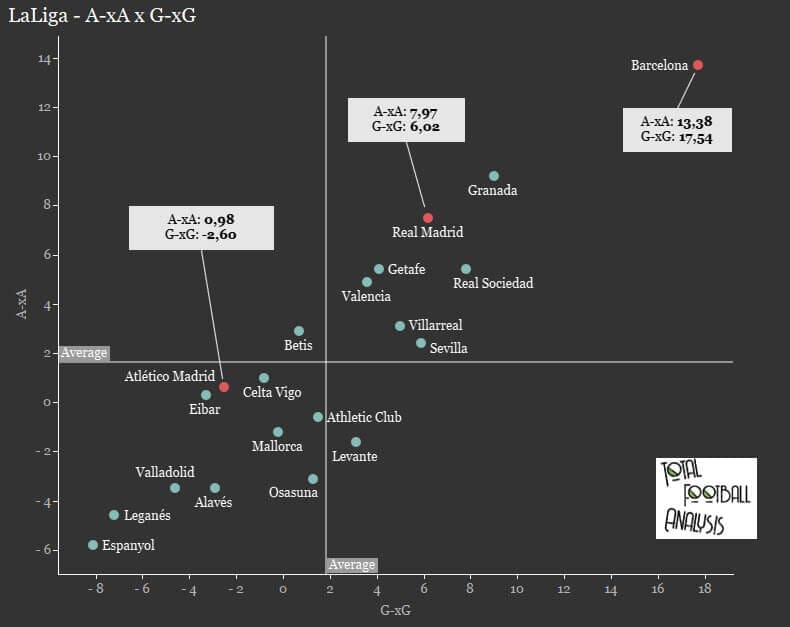
Apart from the shot and goal-creating actions we saw in the earlier graph, this one might highlight their issues the best. With an A-xA of only 0.98 and G-xG value of -2.60, Atlético Madrid are below average in both categories, far behind their top two rivals and among the bottom of other LaLiga clubs.
What it essentially tells us is that they have only registered 0.98 assists more than it was expected and have actually scored 2.60 goals fewer than they should have. In other words, they barely did just enough while their main rivals all overperformed in that regard.
Now we’ll turn to the source of the problem – Atlético’s squad. Firstly, let’s see where the goals are actually coming from within the team. The below graph shows us all of their goalscorers and their respective expected goals as well.
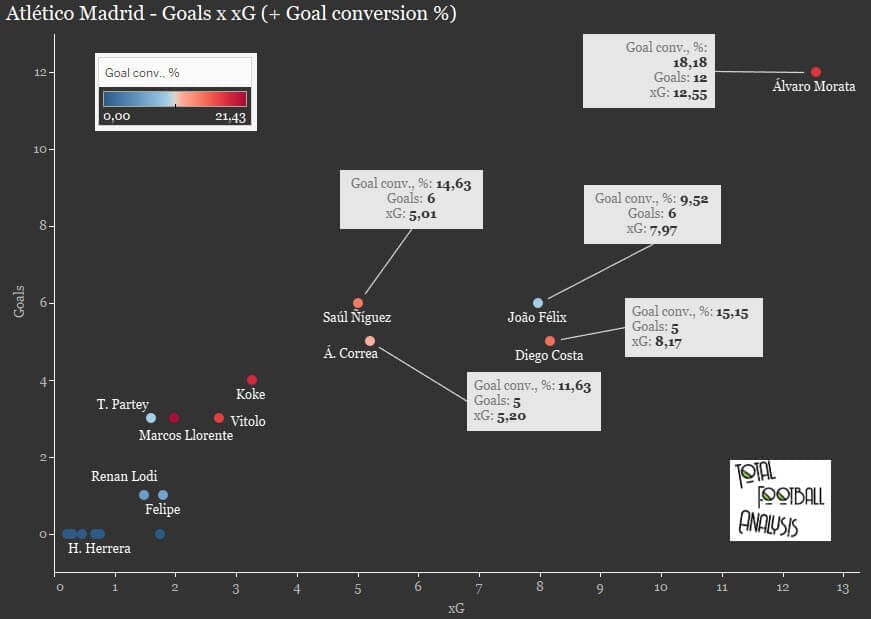
Álvaro Morata has been their most prolific striker throughout 2019/20 with 12 goals out of 12.55 xG. On top of that, he has the highest conversion rate of 18.18%, far above anything other squad members produced last season. We can see that the likes of Diego Costa, João Félix and Ángel Correa have registered decent numbers but nowhere near enough to push the club forward. Just the fact that Saúl Ñíguez’s six goals from 5.01 xG are so high up tells us enough.
Another very important thing to note is that the midfielder is the only player among the top-scorers who has overperformed his expected goals value. Their goals matching the xG output wouldn’t be such a serious problem if the xG values were high on their own. But they are not.
The below graph compares Atlético Madrid’s players to other players in LaLiga in terms of goals scored and their respective xG values. Needless to say, it does make for a sour reading.
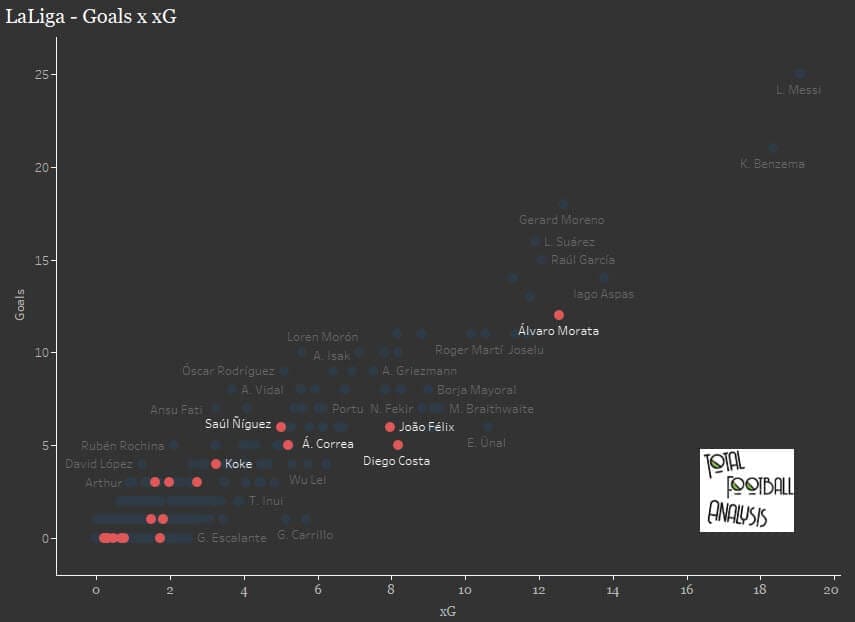
While Morata is above-average in this graph, he is essentially the only Atléti player even remotely standing out while the others are lost in the crowd. Of course, Messi and Karim Benzema are on a planet on their own but even without them included, Atlético don’t have enough presence at the very top of the pile.
But what about chance-creation and assists? The following graph will tell us more about who are the biggest creative outlets at the club. Immediately, three players clearly stand out from the crowd – Koke, Correa and Kieran Trippier.
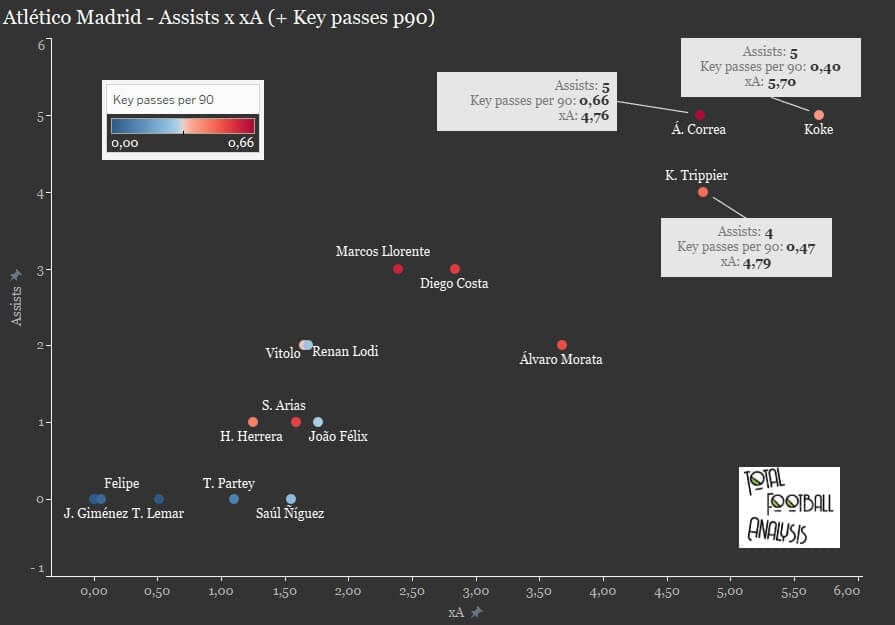
And while having only three creative outlets is not necessarily a bad thing – seeing how even the top clubs rarely have a lot more – their numbers are not exactly impressive enough on their own nor do they get enough support from the rest of the team. Koke’s five assists from 5.70 xA lead the way along with 0.40 key passes per 90 while Correa and Trippier have five from 4.76 (0.66 key passes per 90) and four from 4.79 (0.47 key passes per 90) respectively.
But once again, the same thing happened – only one of their top creative outlets has managed to overperform his expected assists value and that’s Trippier with five assists from 4.76 xA, which is not overly impressive either.
The next graph will compare those figures to the rest of LaLiga.
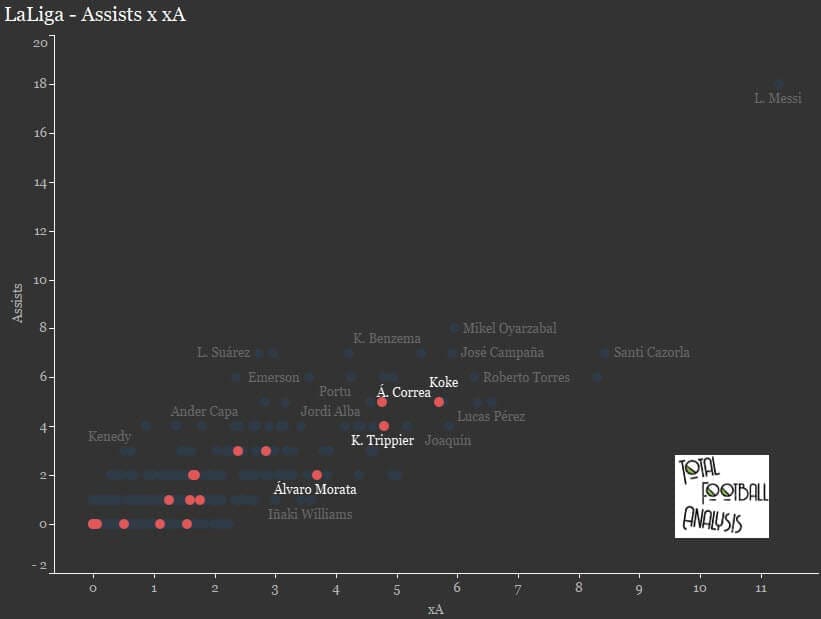
One thing that does stand out is that Atlético are among the very few teams that seem to have multiple players among the top. Of course, if we disregard Messi for just a second, that is. But even with that being said, the overall distribution of assists is not good enough for a club of their stature.
Apart from the aforementioned trio, no other player is particularly impressive in the above graph, meaning that leaves them without prolific creators and without prolific goal-scorers as a whole.
Final remarks
This data analysis used statistics to shed some light on where exactly do Atlético Madrid’s struggle lie. Obviously, their away performances, especially when chasing a result, are simply not good enough.
Their dreadful showings in front of goal, paired with that struggle away from Wanda Metropolitano, have resulted in far too many draws as well. The next step in our analysis will be to dissect the away games in which Atlético went behind and never made it back to win the game in the end.
This should give us an indication of what kind of tactics Simeone deploys in such situations and what exactly is lacking in them. Stay tuned.



Comments