We may be amid the first international break of the 2023/24 campaign, but many leagues remain largely unaffected, including EFL League One. Over the course of a season, especially one that is 46 games long, being effective in multiple areas can influence the outcome of said season.
One essential element that fits that description is how good a team are in attack and how dangerous they can be. Sure, a solid defensive foundation will bring you points in vital games, but consistently finding the back of the net can elevate a team’s performance to the next level while also giving them a fearful reputation. For a number of reasons, having a solid attacking base is also crucial for those teams who want to be playing Championship football next season.
This data analysis will explore teams’ data in League One, using various statistics to determine their effectiveness in an attacking capacity. From analysing basic data such as goals scored to more complex statistics, we will shed some light on which teams are creating many chances and who needs to improve.
Goals, Goals, Goals
We will start by looking at the business end of things, as that is essentially the primary focus of this data analysis. Here, not only will we look at factors such as goals scored and xG, but we will dive deeper by looking at how dangerous League One clubs are from set pieces, amongst other metrics!
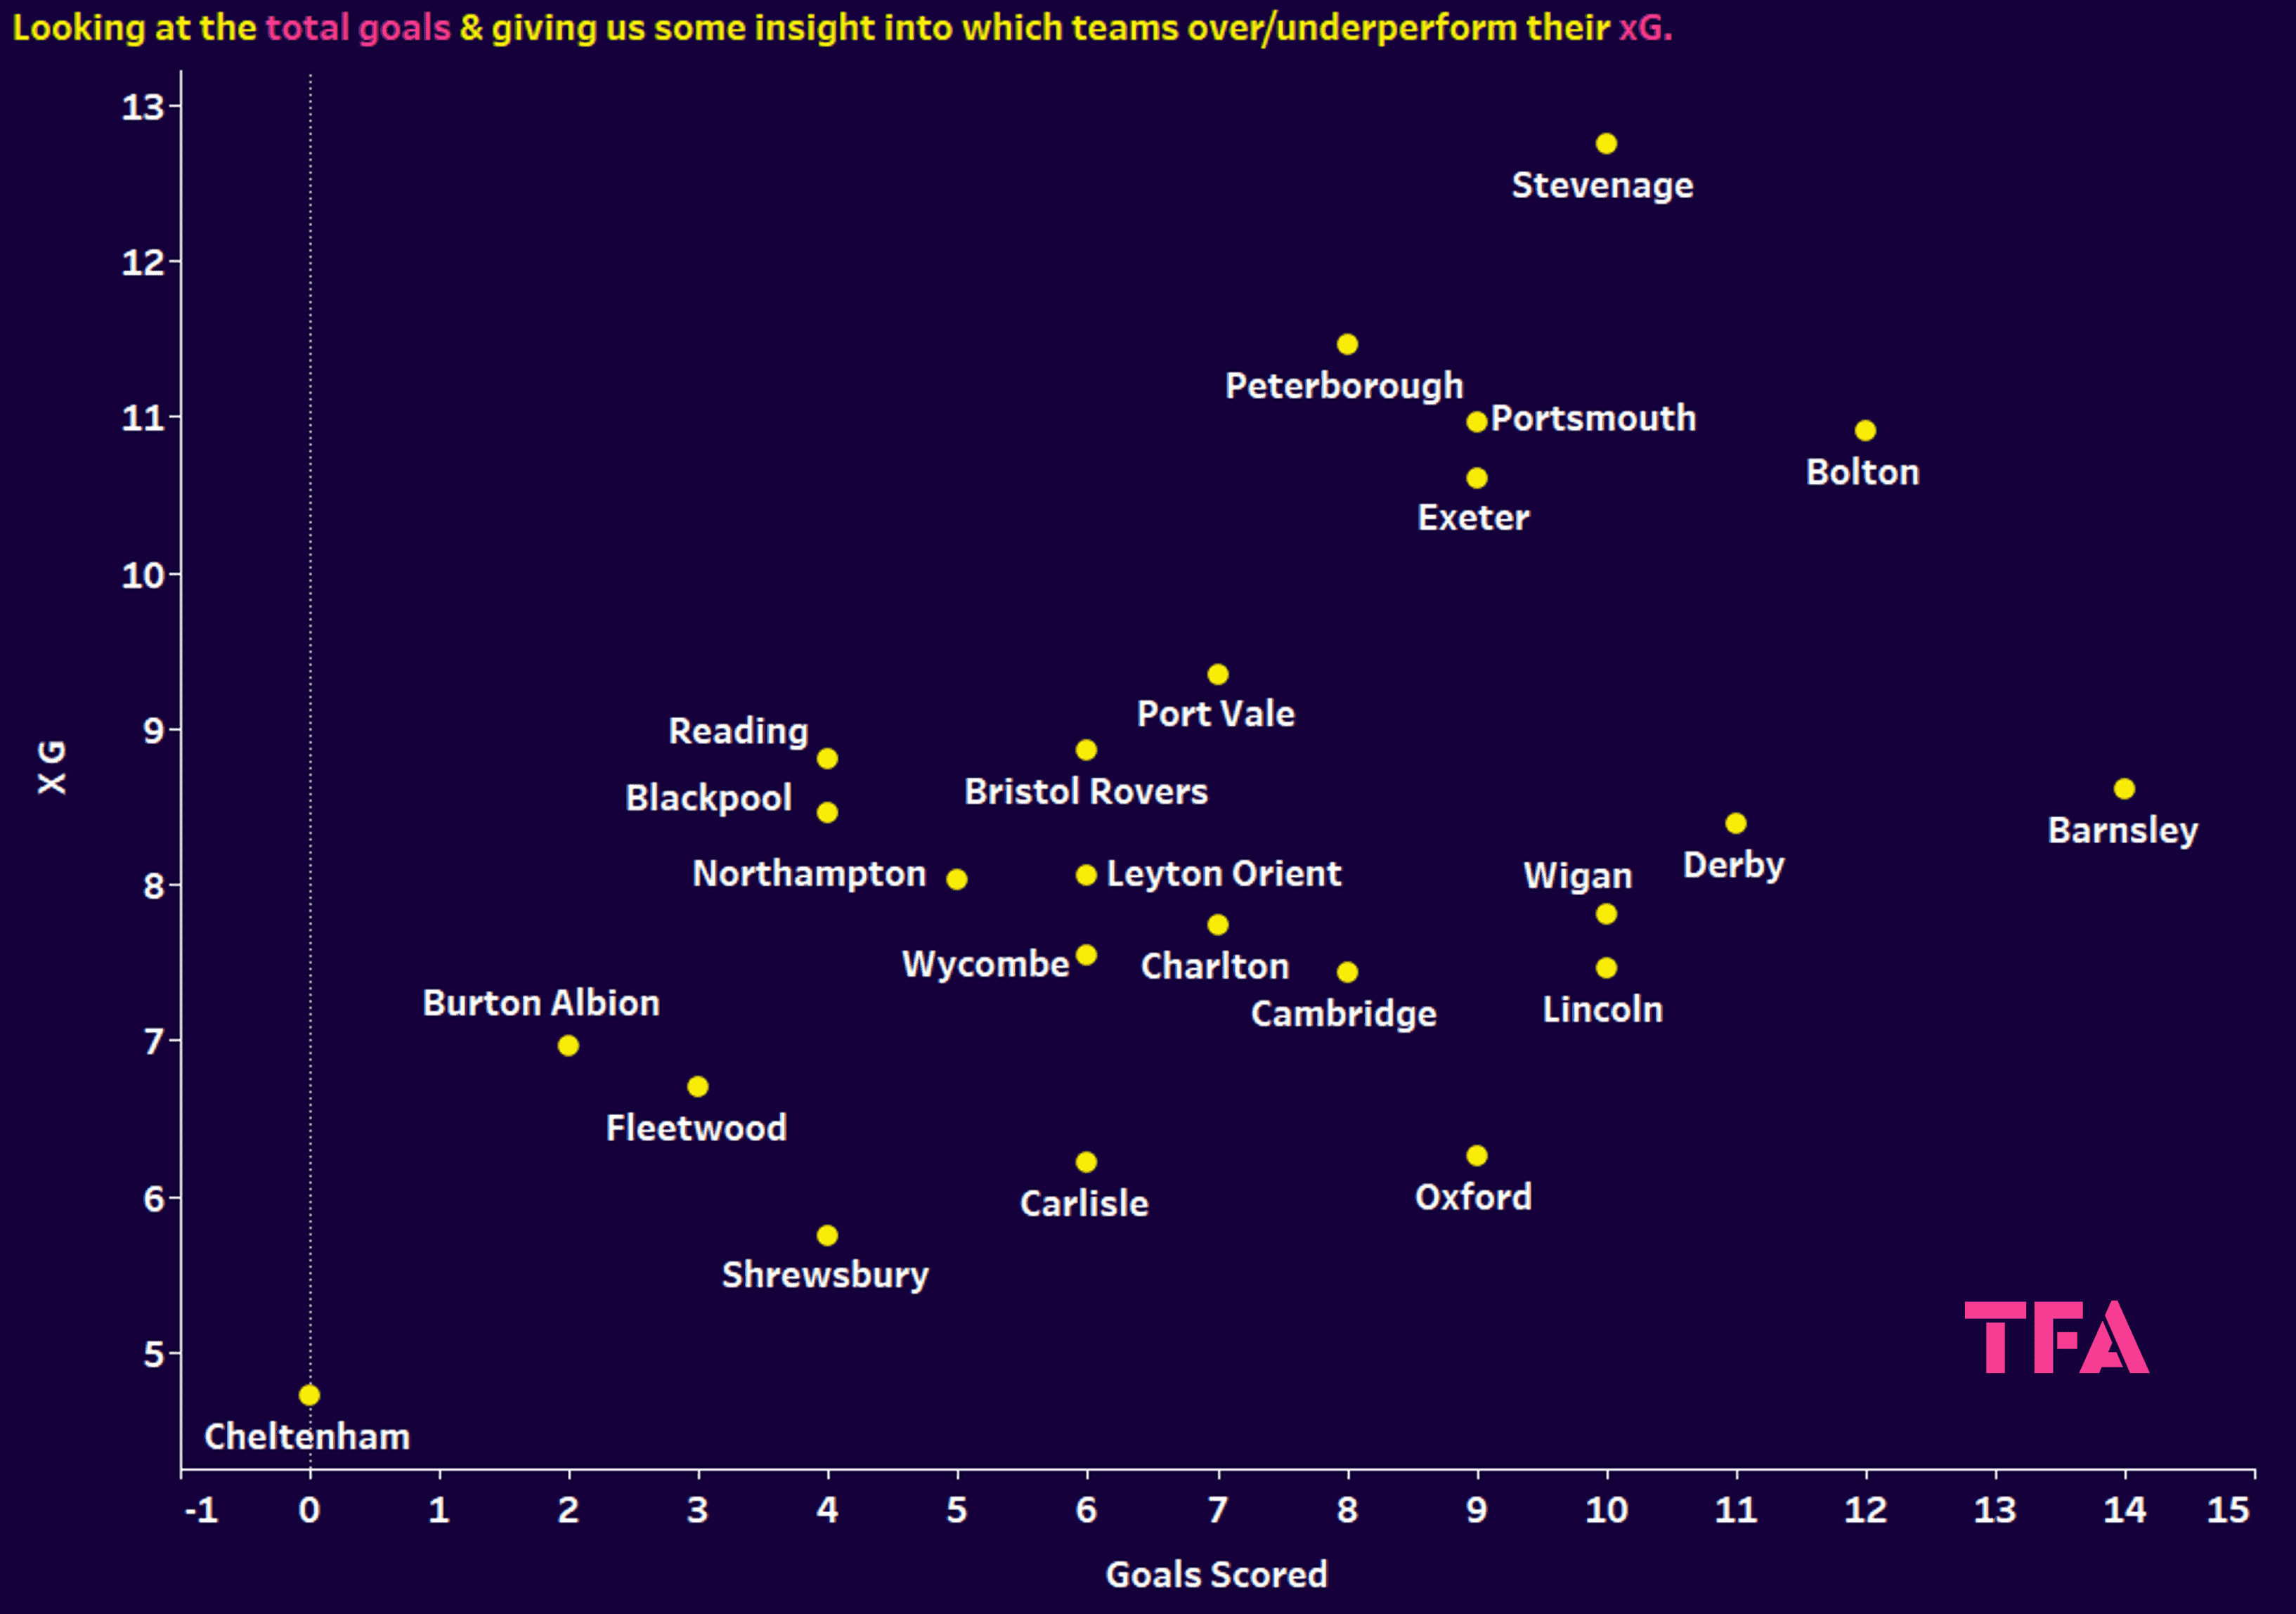
Starting with the main event of attacking statistics, we compare the number of goals each team has scored against their xG in the season so far. It would be a surprise for Cheltenham fans if this article piqued your interest anyway, considering your current situation – zero goals in six games is worrying.
An xG register of 4.72 may look like the Robins have created a sufficient number of chances on goal to warrant at least a goal, but if you break that number down across the six league games, the average xG per 90 would be easily below one.
Stevenage are the team with the highest xG so far, recording an incredible 12.75 from their opening seven games – their chance creation is a big part of them being the league leaders at the time of writing. Meanwhile, the division’s top scorers, Barnsley, are overperforming their xG register of 8.61 by scoring 14 goals so far.
This is undoubtedly boosted by their mammoth 7-0 win against Port Vale on the opening day of the season, but their attacking output since that game has also had some promising moments.
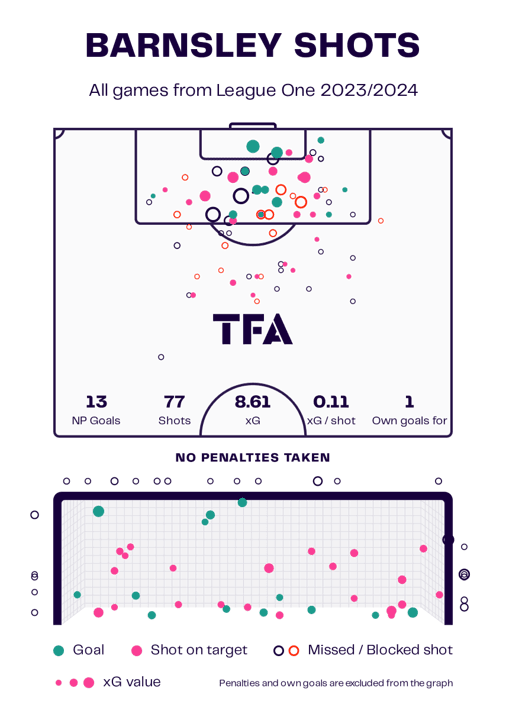
Let’s take a moment to take a closer look at Barnsley’s xG map, shedding some light on why they are the league’s top scorers. While they’ve had a few efforts on target from range, they have demonstrated a deadly, clinical nature inside the box, with all of their goals coming from the area, most of them from a central position.
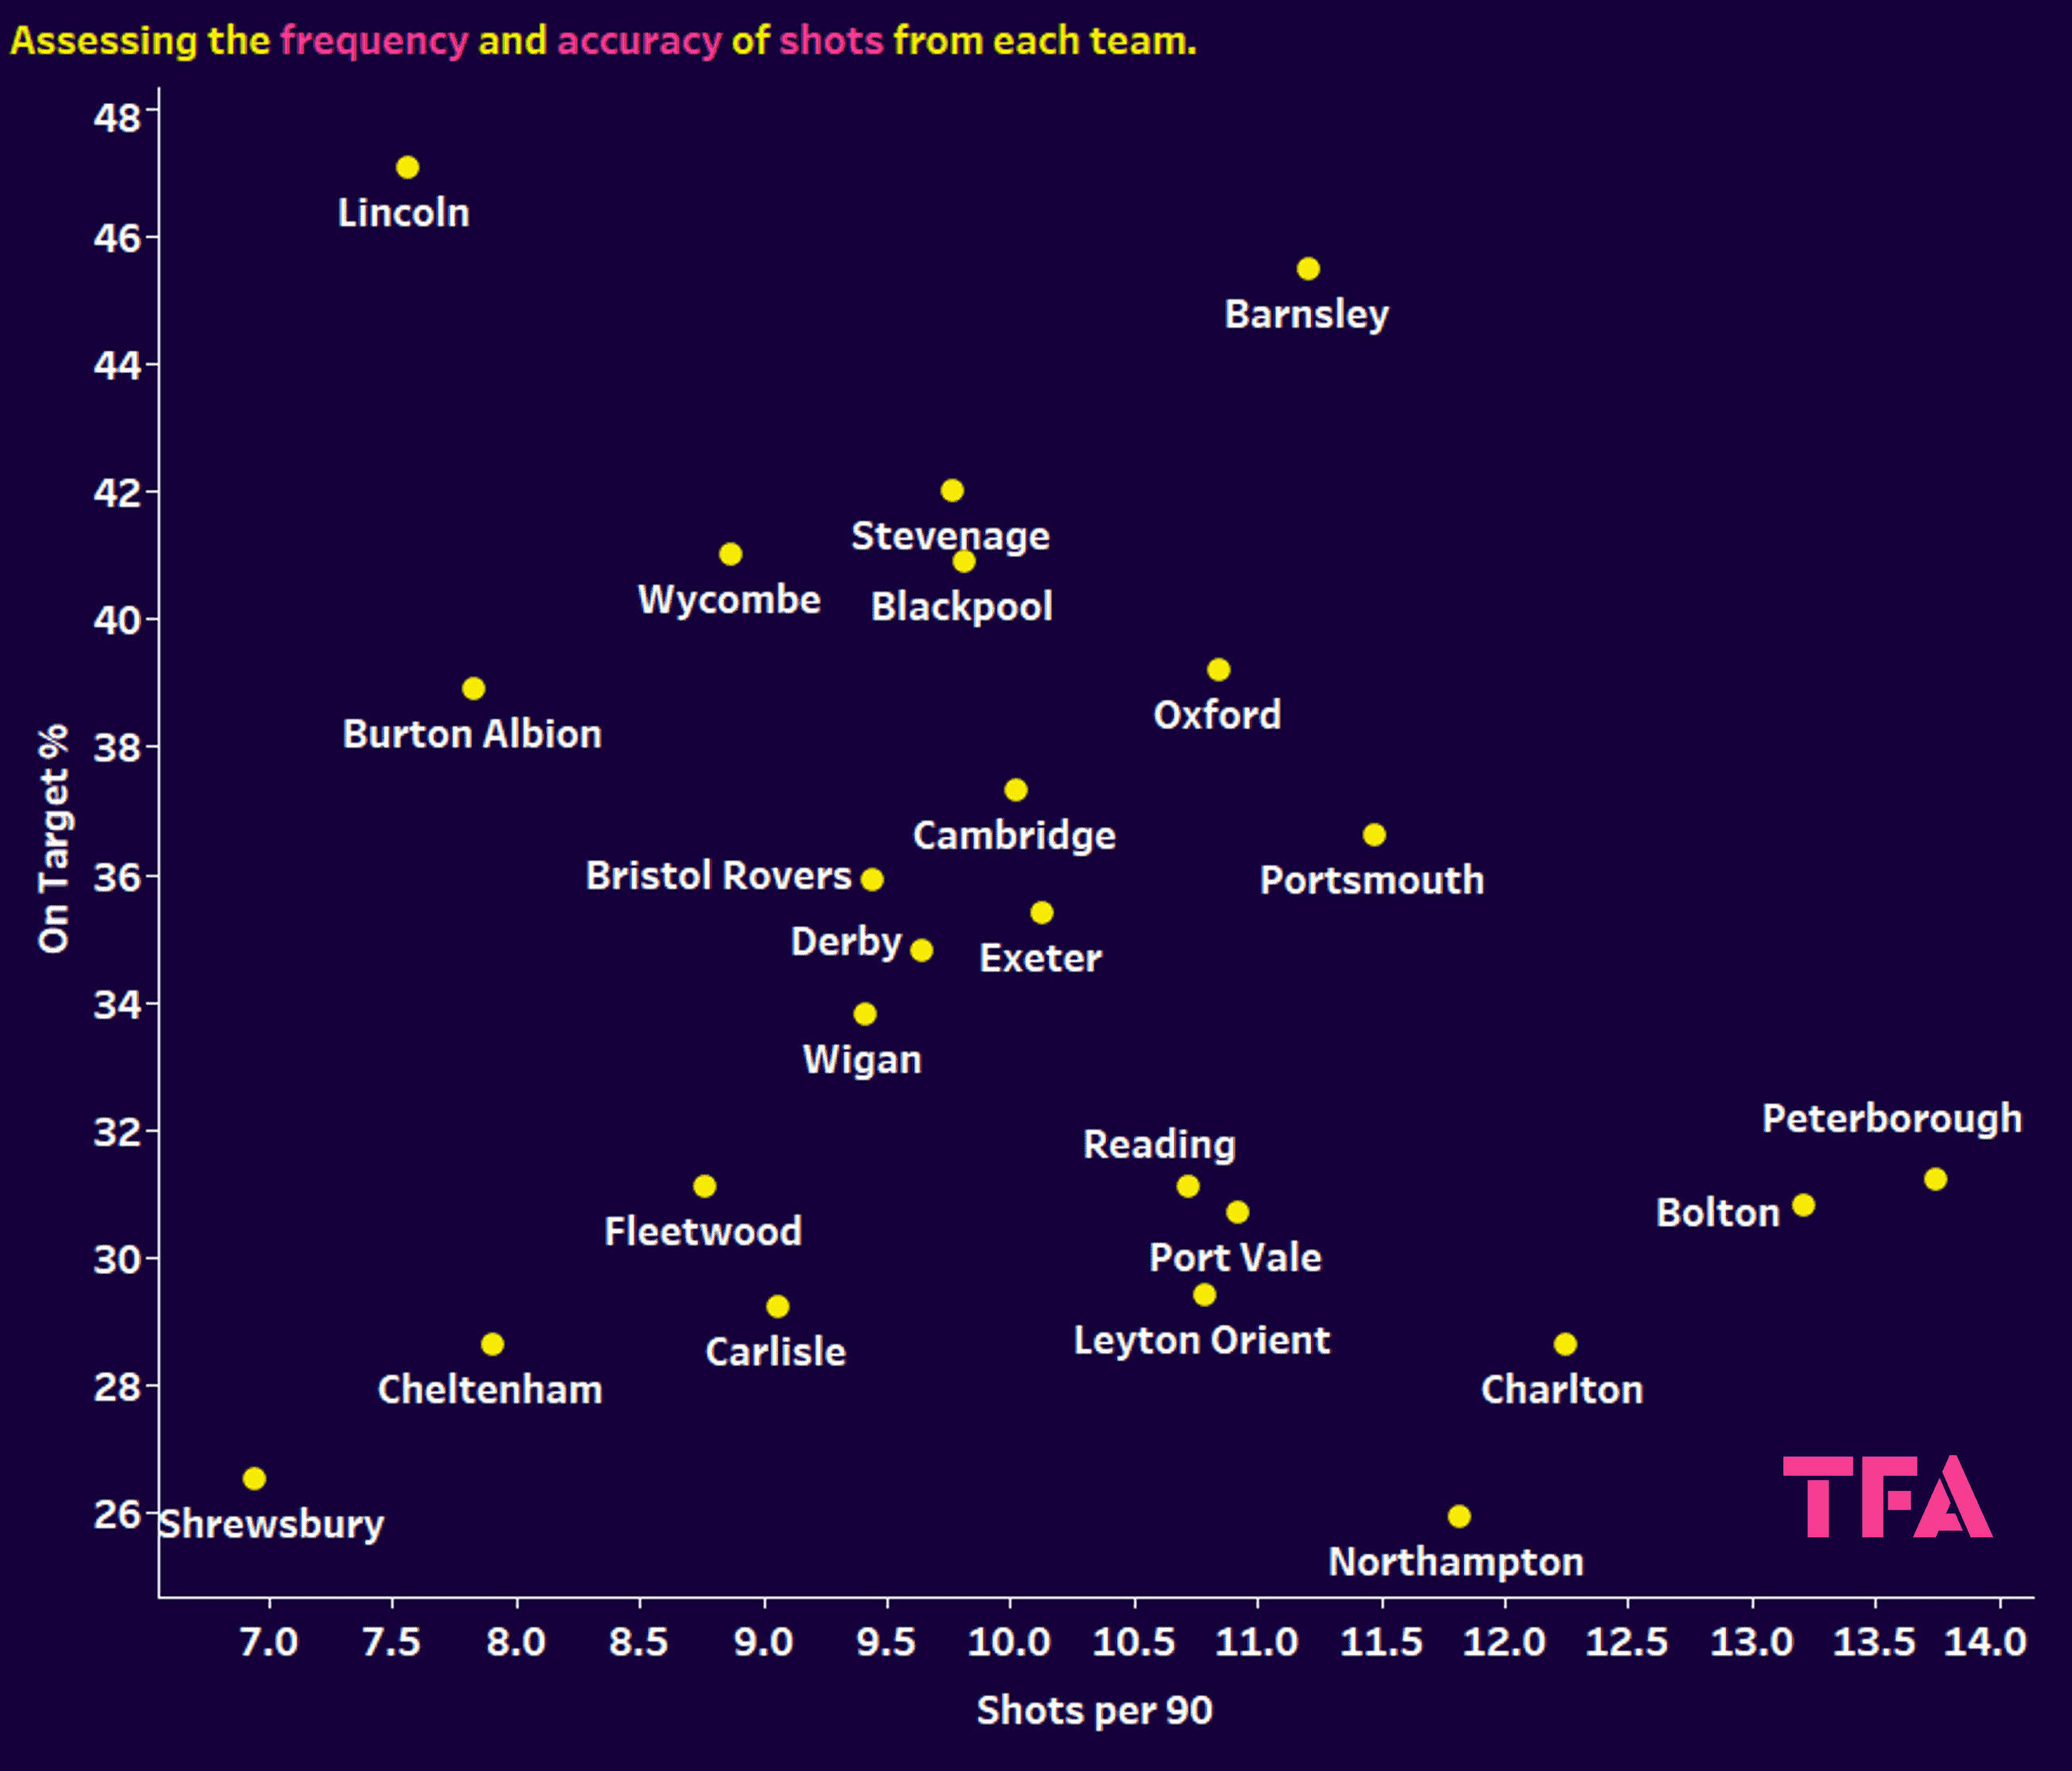
Moving on to looking at how many shots each team averages, we can begin to see how active each side is in front of goal while also seeing how dangerous they are with their accuracy rate. The league’s top scorers, Barnsley, crop up again with a combination of a high number of shots and a high accuracy percentage, which they hope to sustain throughout the season.
Regarding averaging the most shots per match, Peterborough claims that title, recording a whopping 13.75 shots per 90.
However, their sub-par accuracy rate of 31.2% suggests that they have some work to do to make their attacking moves more effective. Lincoln, currently 8th in the table and one of the top scorers in the division, average one of the lowest rates for shots per 90 (7.56), but they are the most accurate team in League One, hitting the target 47.1% of the time.
This suggests they create strong chances rather than just shooting at will.
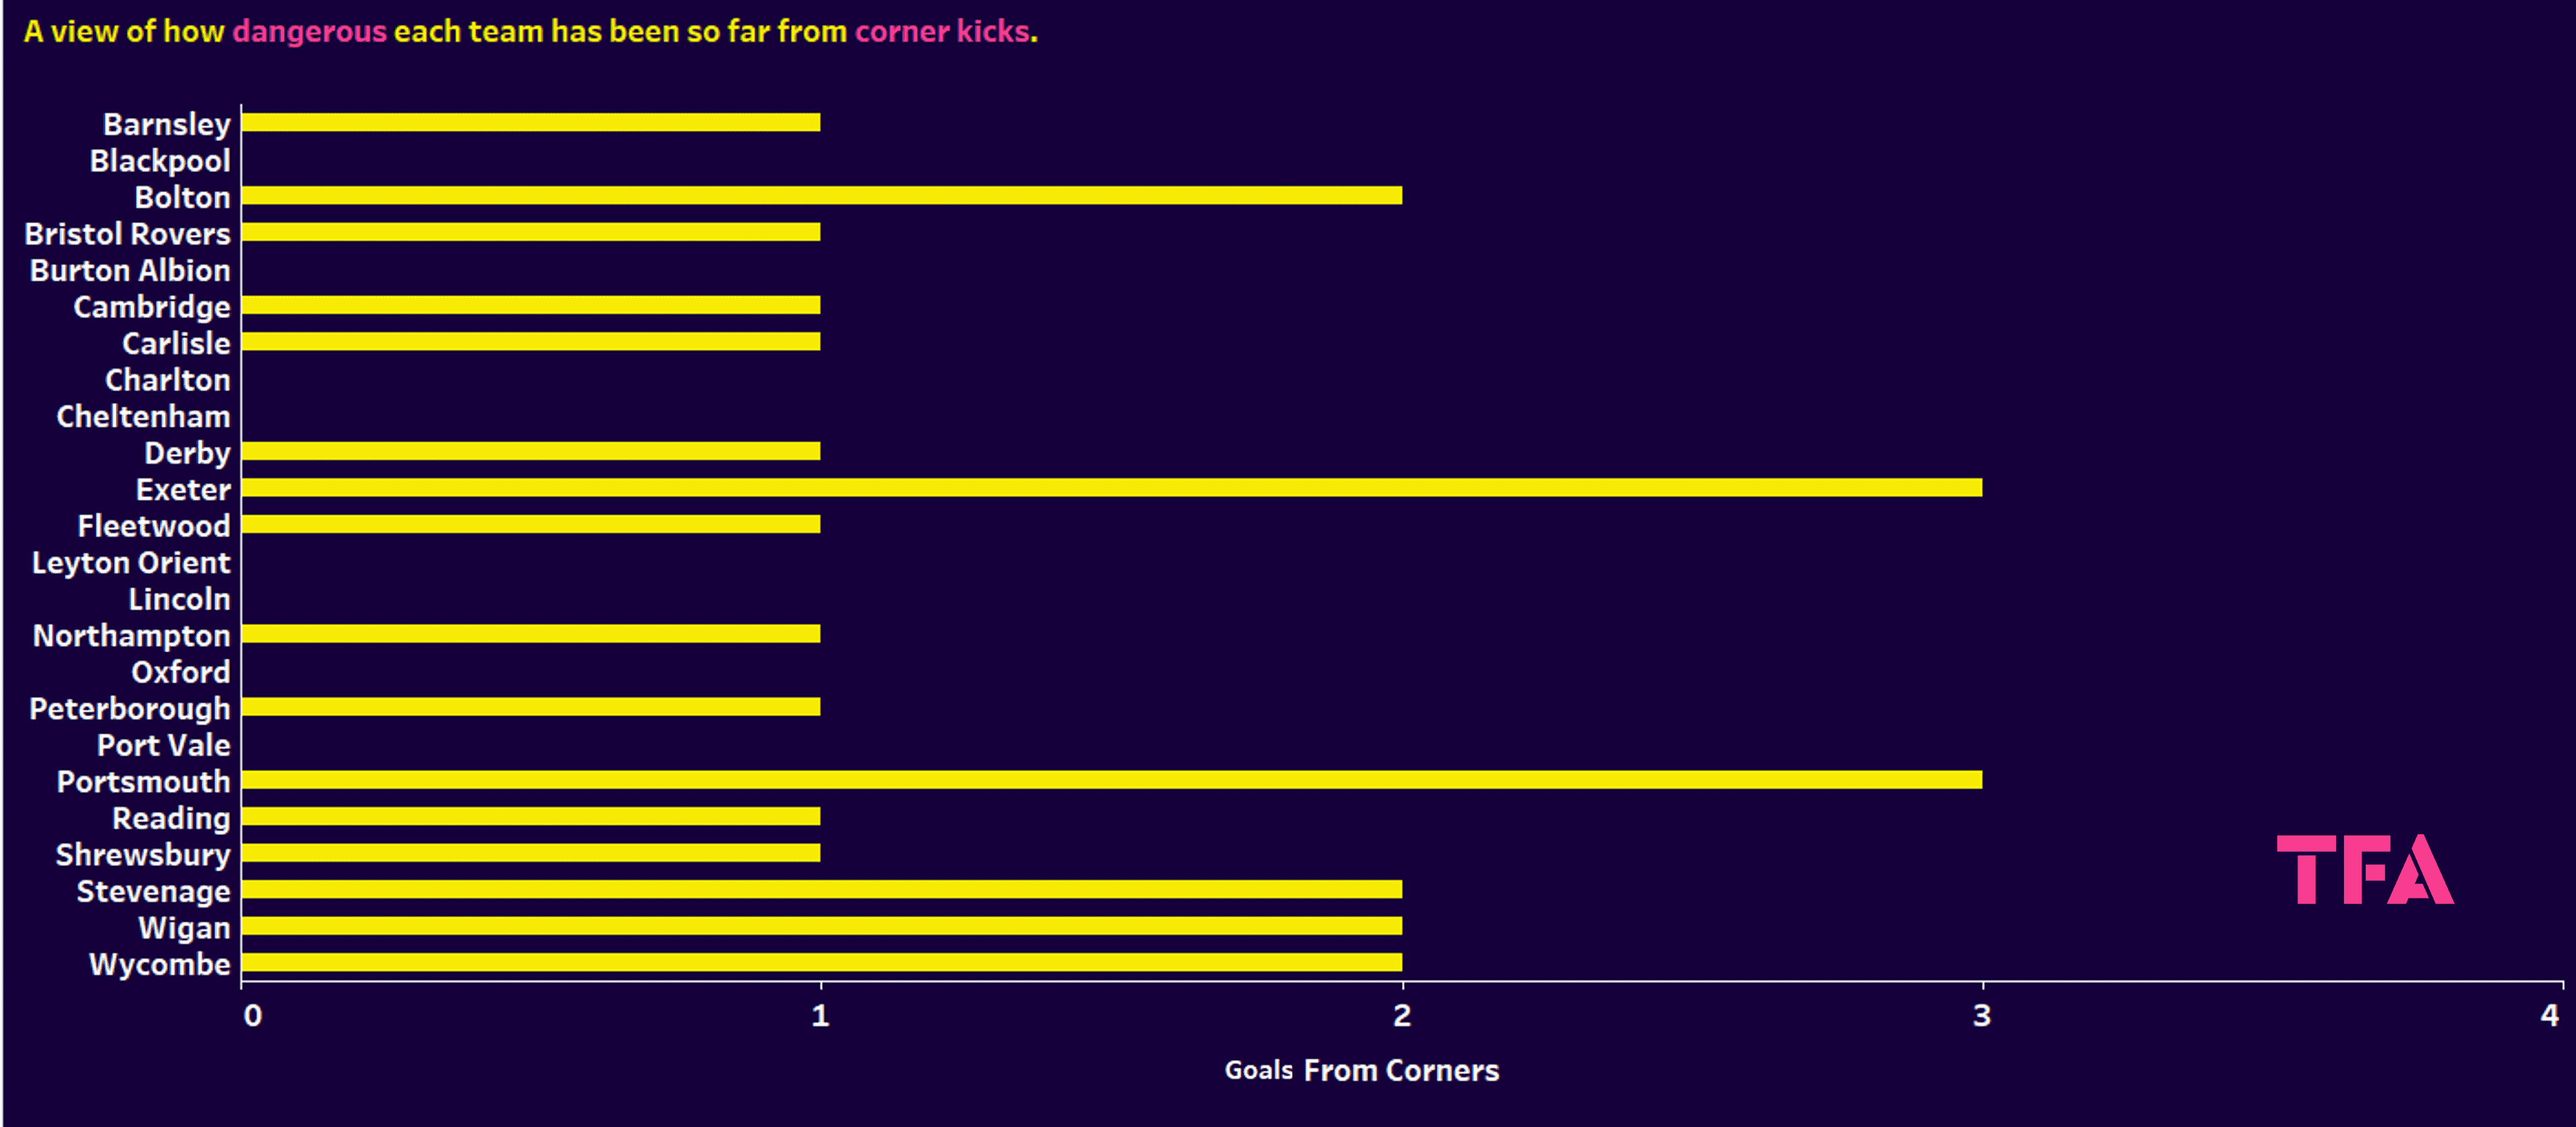
Corners are a vital aspect of attacking at any level of the game. From utilising training ground routines to using physicality to their gain, many teams heavily rely on netting from set-pieces – so far this season, Exeter City and Portsmouth tick that box, with both clubs scoring three times from corners. Bolton, Stevenage, Wigan, and Wycombe have also scored multiple times from corners, so they hope to continue to pose a threat from these areas.
Meanwhile, several teams are yet to score as a result of a corner – Blackpool, Burton, Charlton, Cheltenham, Leyton Orient, Lincoln, Oxford, and Port Vale all match that description, and this is an area of attack that they will definitely want to improve.
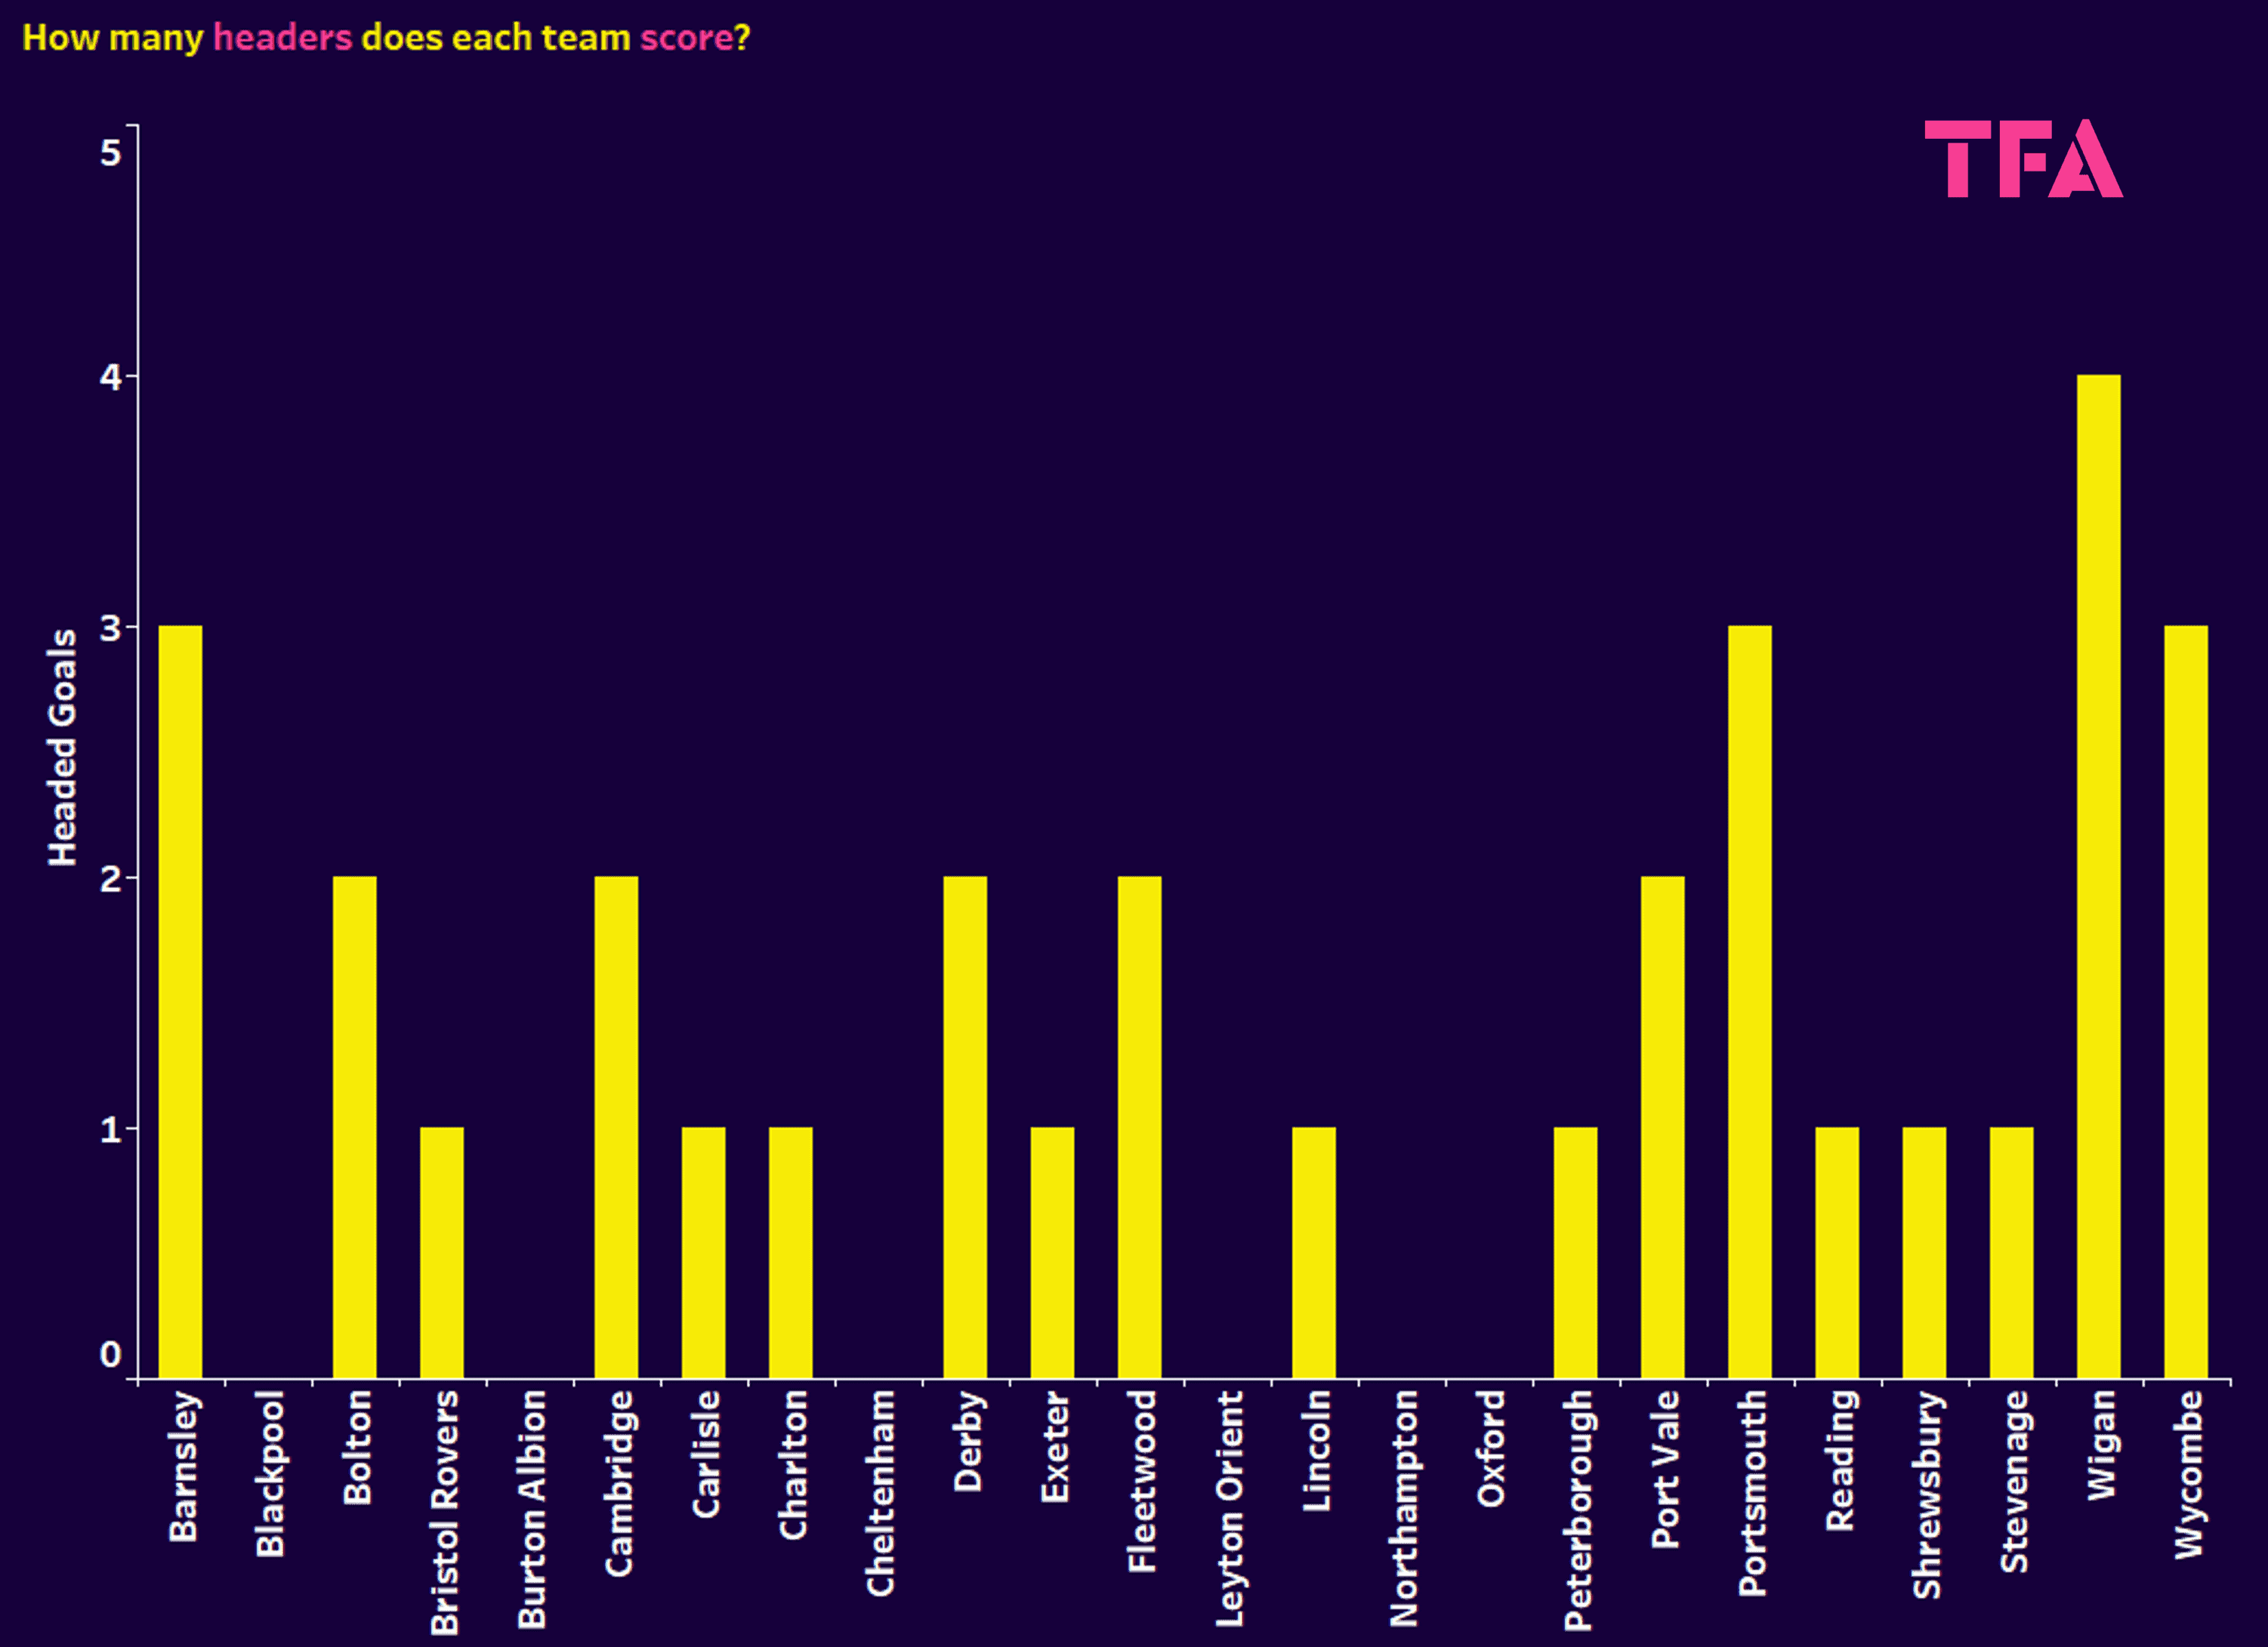
Following on from looking at the scoring rates of teams from corners, we now look at how many headed goals each team has scored. Of course, this could include any headed goals from corners, as well as any other set-piece or simply open play.
There are positive mentions again for the likes of Barnsley, Portsmouth, and Wycombe, all of whom have scored three headers this season. Still, it is former Premier League side Wigan Athletic who are currently leading the way in that area, thanks to their four headed goals.
Build-up & chance creation
While the goals are the ultimate end-product of a team’s possession, several important attacking factors in build-up phases can allow the goal to be scored. In this section of the analysis, we will look at statistics like crossing frequency and accuracy; key passes per 90, and more!
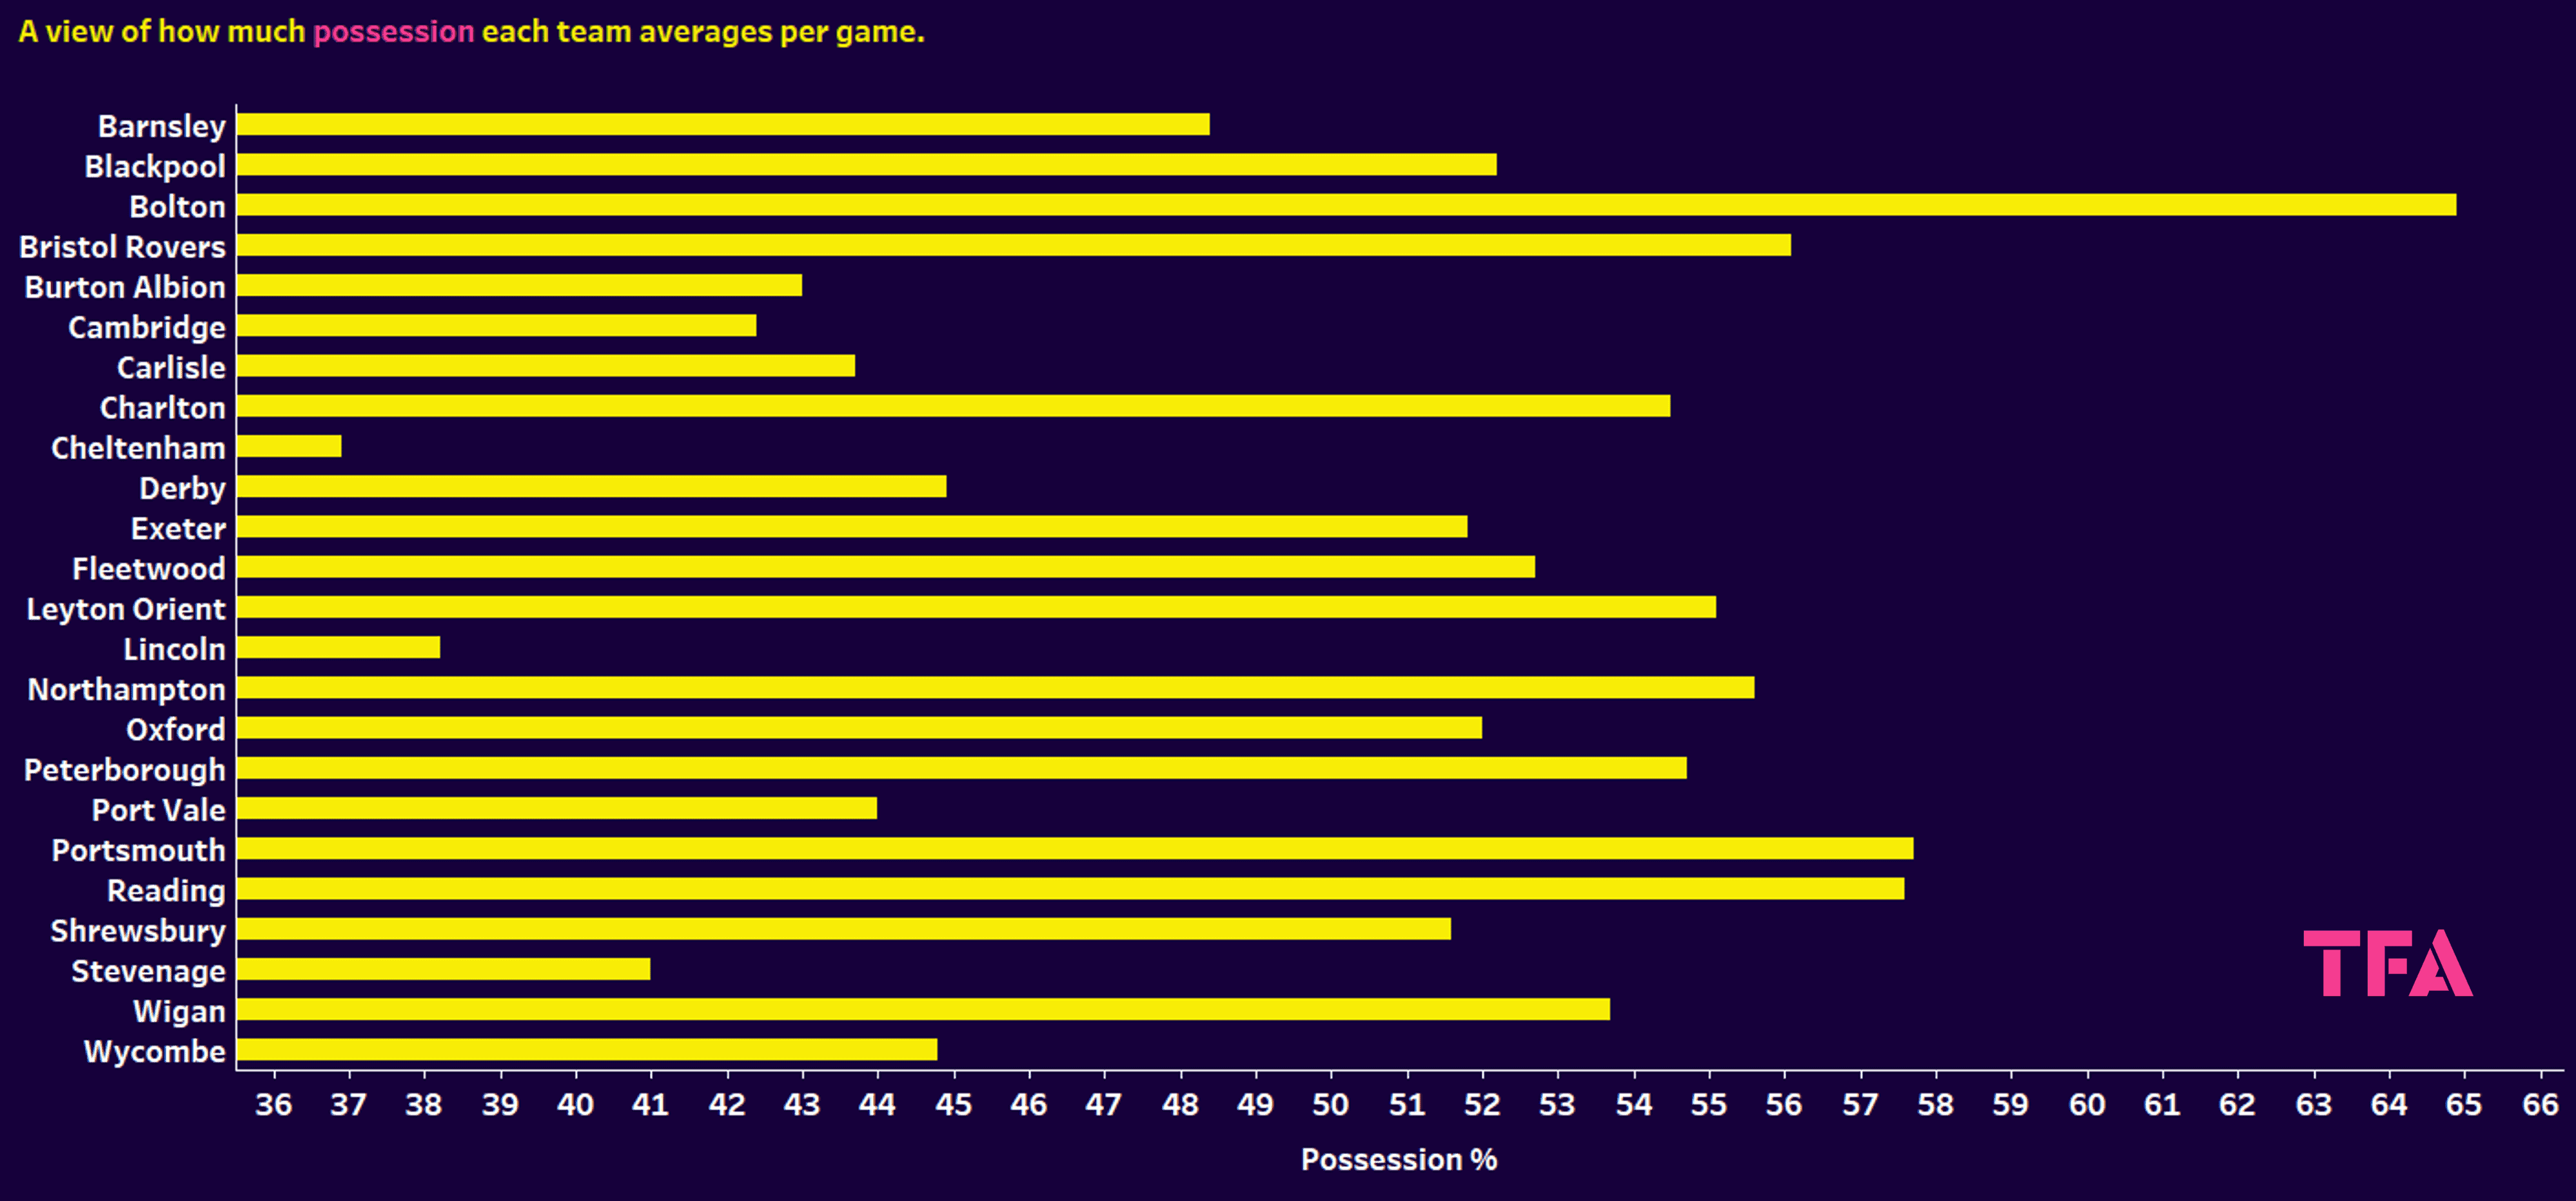
Controlling large portions of possession isn’t exactly paramount to being a thriving force in League One, or any league, really, but it can provide context to the attacking tactics of a given team. Additionally, a team that can control a large share of possession rarely gets involved in a relegation scrap!
Bolton have been the dominant possession side so far this season, averaging 64.9% per game, which will likely have played a role in them having one of the most clinical attacks in the division so far this season. Bristol Rovers (56.1%), Portsmouth (57.7%), and Reading (57.6%) all also like to dominate possession, but only Pompey have really put it to some practical use.
Elsewhere, it will come as no shock that Cheltenham concede large portions of possession, averaging just 36.9% per game – something they must rectify to help boost their luck in front of goal. Lincoln also face a lot of time without the ball, averaging 38.2% possession per 90 – but they have had a fairly strong start to their campaign overall, losing just once, with a decent attacking output to match. League leaders Stevenage are similar to Lincoln in that sense – low possession average (41%), solid attacking out, and good overall start to the season. These two teams are proof that success can be found outside of a possession-based approach.
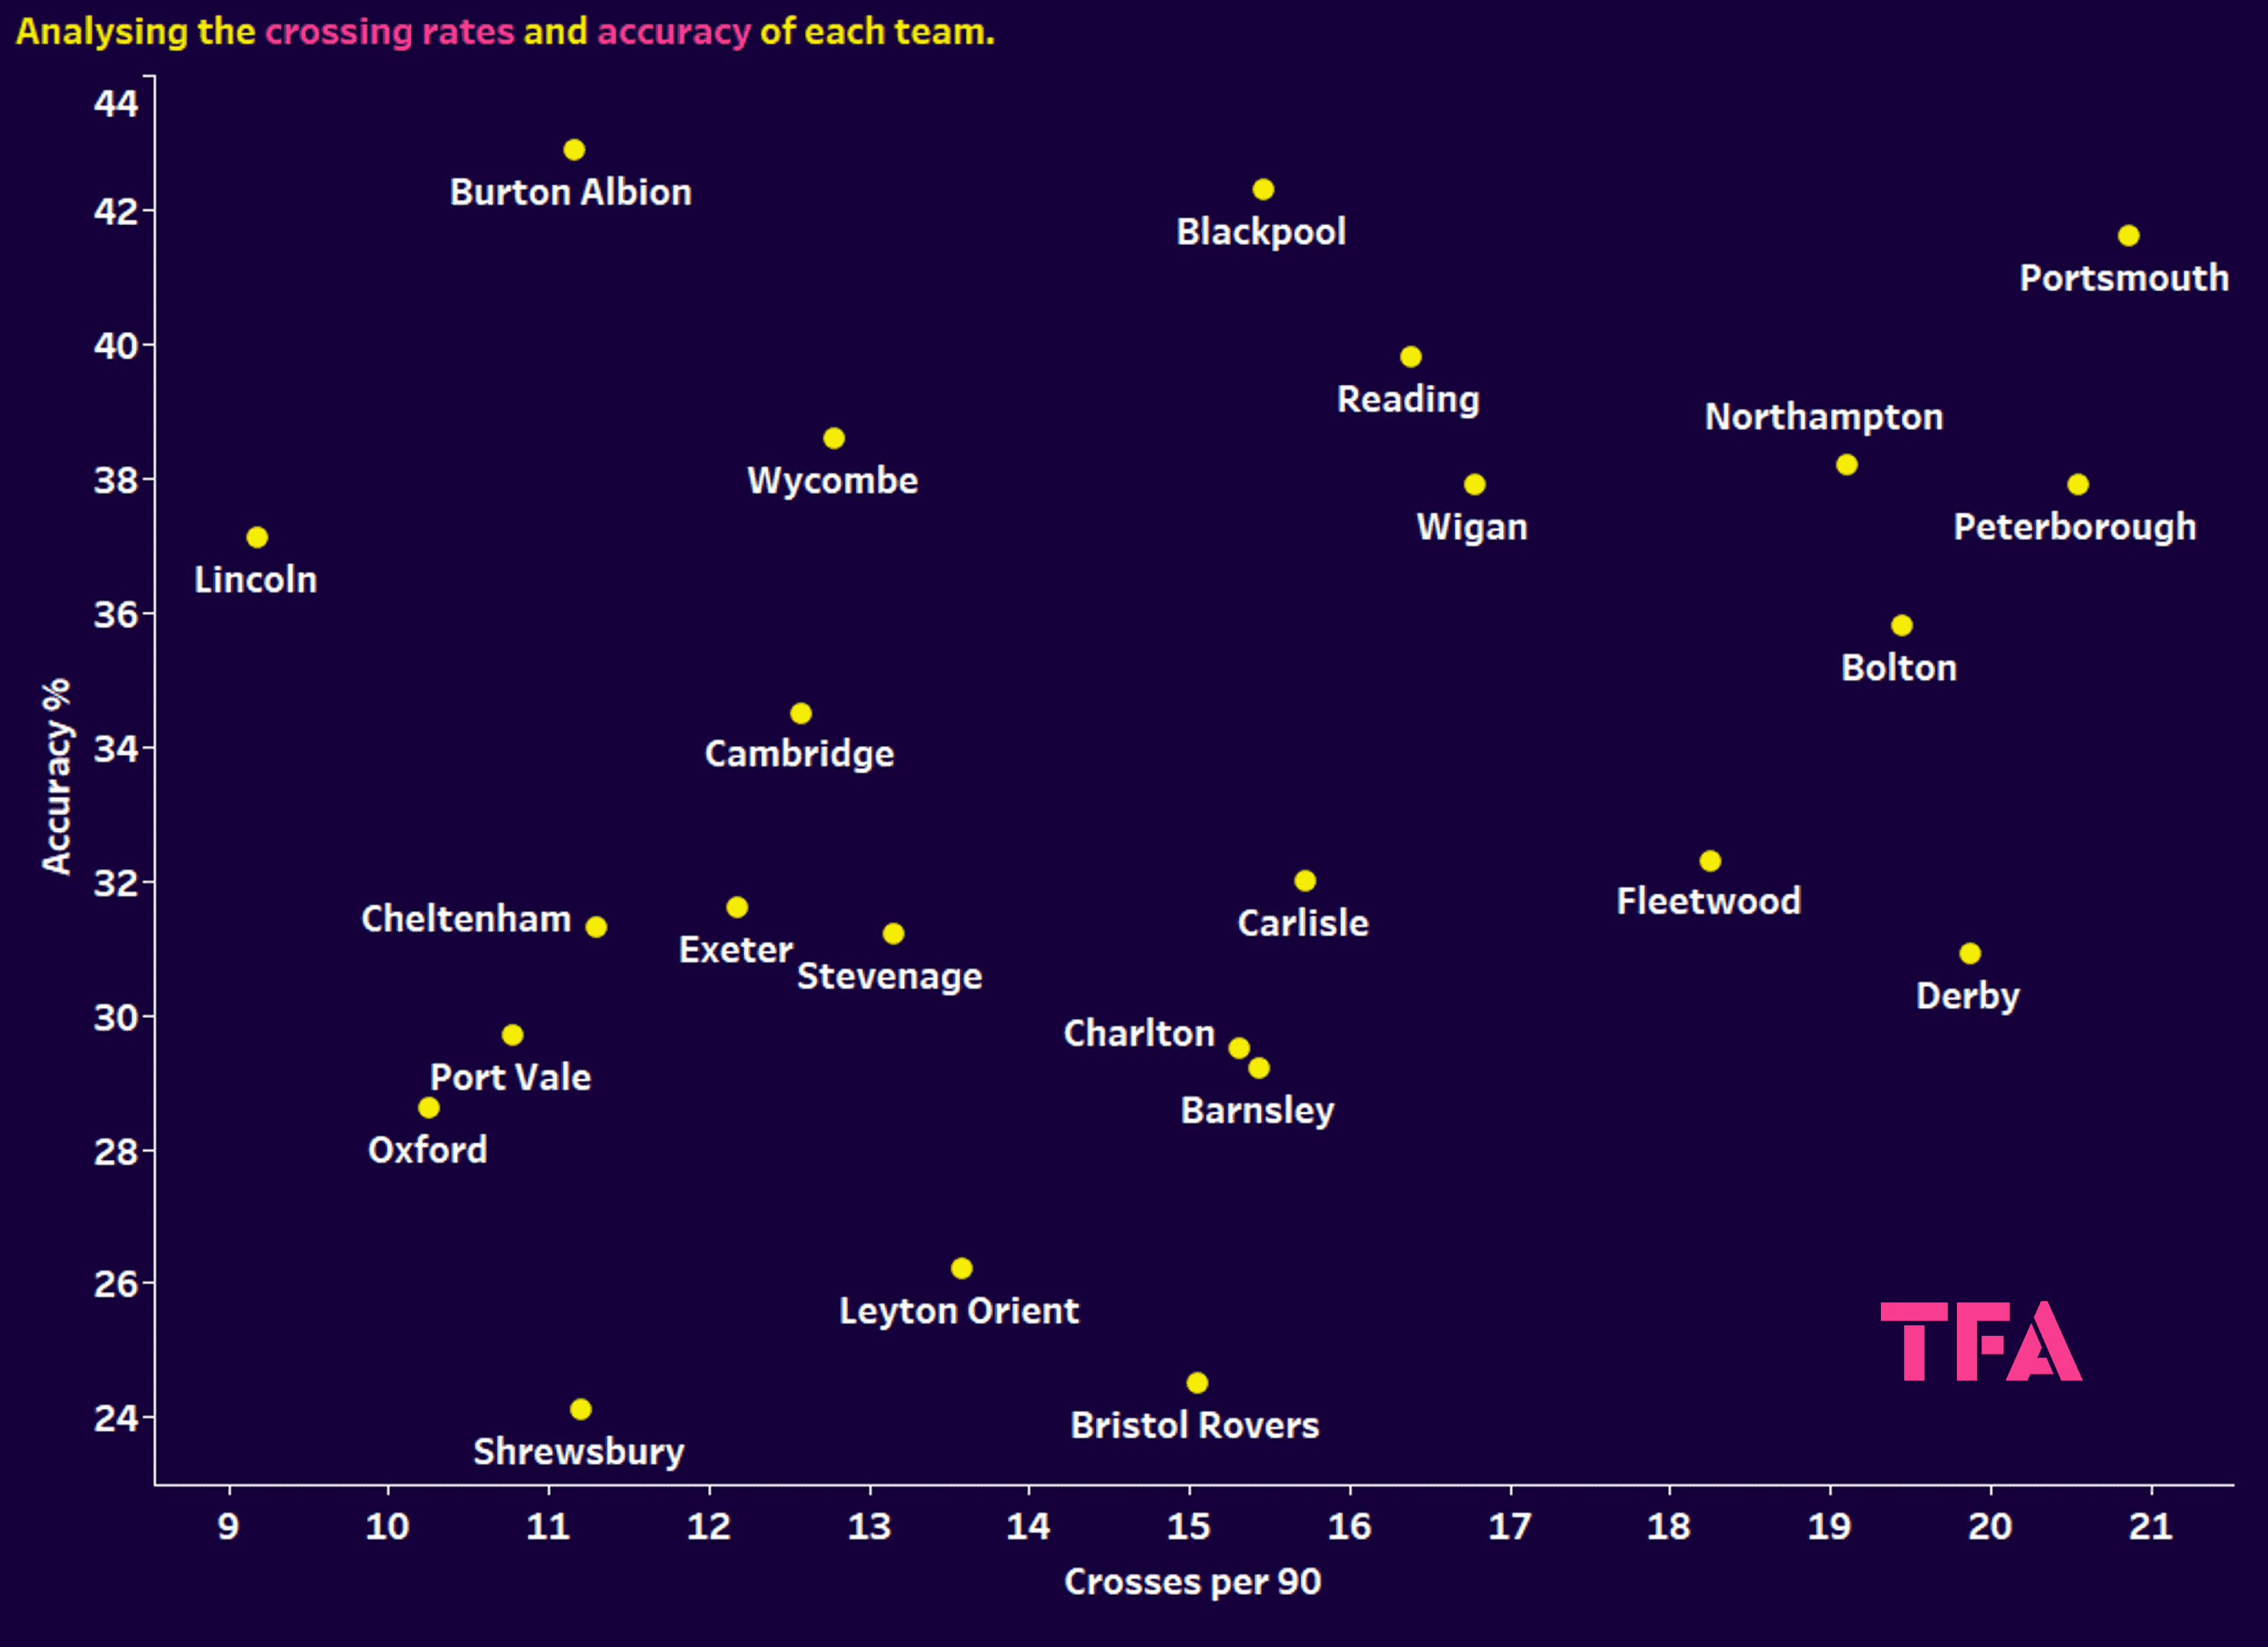
Theoretically, the metrics involved in the graph above tie into one of the statistics mentioned earlier (headed goals), but the two are not necessarily exclusive. Wing play is a popular tactic in football and always has been in some shape or form, and utilising such tactics can be an effective way of creating quality opportunities on goal.
Of course, not all crosses into the box are floated ones to be headed in; there a variety of crosses that can demand one of several actions other than a headed shot: a volley/half-volley shot on goal, cushioning the ball down for a teammate; controlling the ball for yourself, etc. This is relevant when you look at some of the data above – Peterborough, for example.
The Posh currently have the second-highest crossing average (20.55 per 90) and one of the higher accuracy rates (37.9%) but have only scored one headed goal this season, which we saw in an earlier graph.
It is often relevant to a team’s tactics. Portsmouth have the highest crossing average this season (20.86 per 90) and a very strong accuracy rating of 41.6%, and they have the numbers to show for it, as we saw earlier – three headed goals and three goals from corners. Hence, they are a team who excel in attacking crosses.
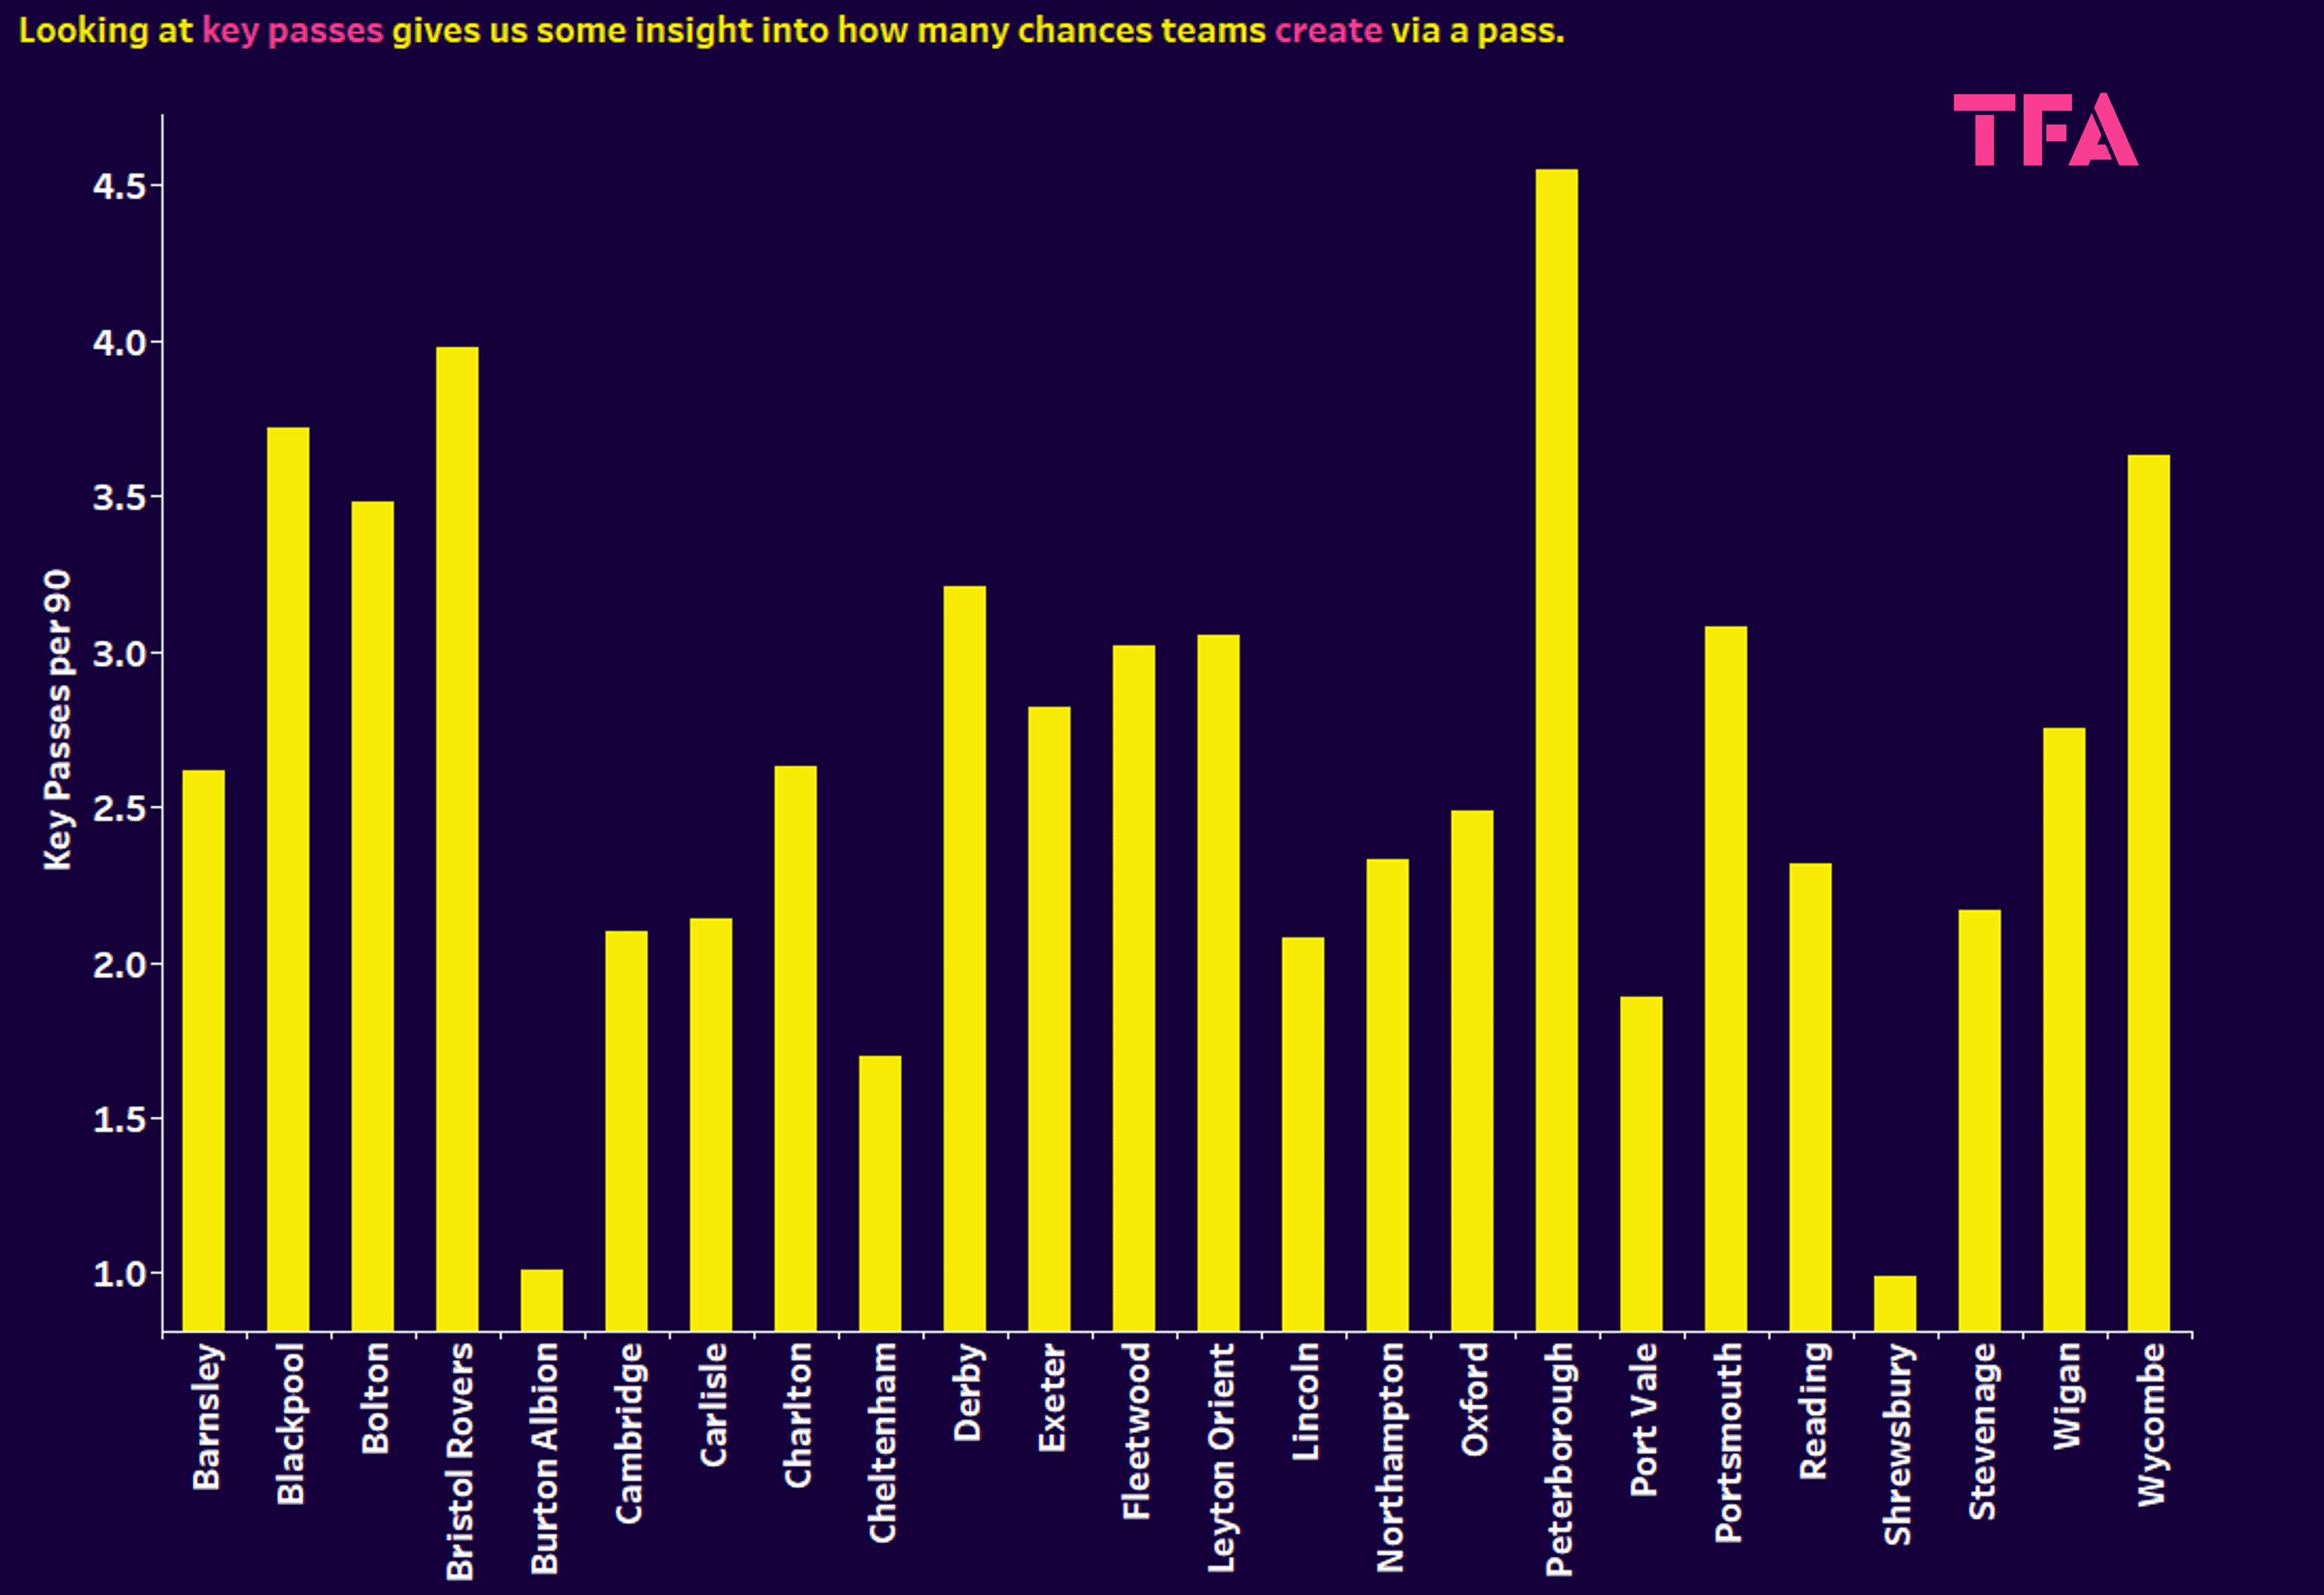
In this context, the critical pass metric is defined as a pass that leads to a clear goal-scoring opportunity for a teammate – a shot assist. This can be an important statistic as it paints a picture of how reliable and accurate a team is on the ball in crucial attacking areas. Of course, plenty of goals are scored without a key pass, but it is a vital piece of data regardless.
Peterborough are showing plenty of promise this season in attack – so far, we’ve seen them record a high xG, which has been helped by an increased number of shots per 90 and good crossing stats. Their current register for key passes per 90 (4.55) will also be a critical factor in their promising xG.
Bristol Rovers also boast a high key pass average (3.98), which is likely helped by their high possession rates, but they are around average for statistics like xG and goals scored and rank below average for shots per 90. So, it seems that part of their issue is finding a high-quality end product – their high key-pass record combined with the low numbers just mentioned could indicate that they are shooting as soon as a slight chance presents itself rather than carving out better opportunities.
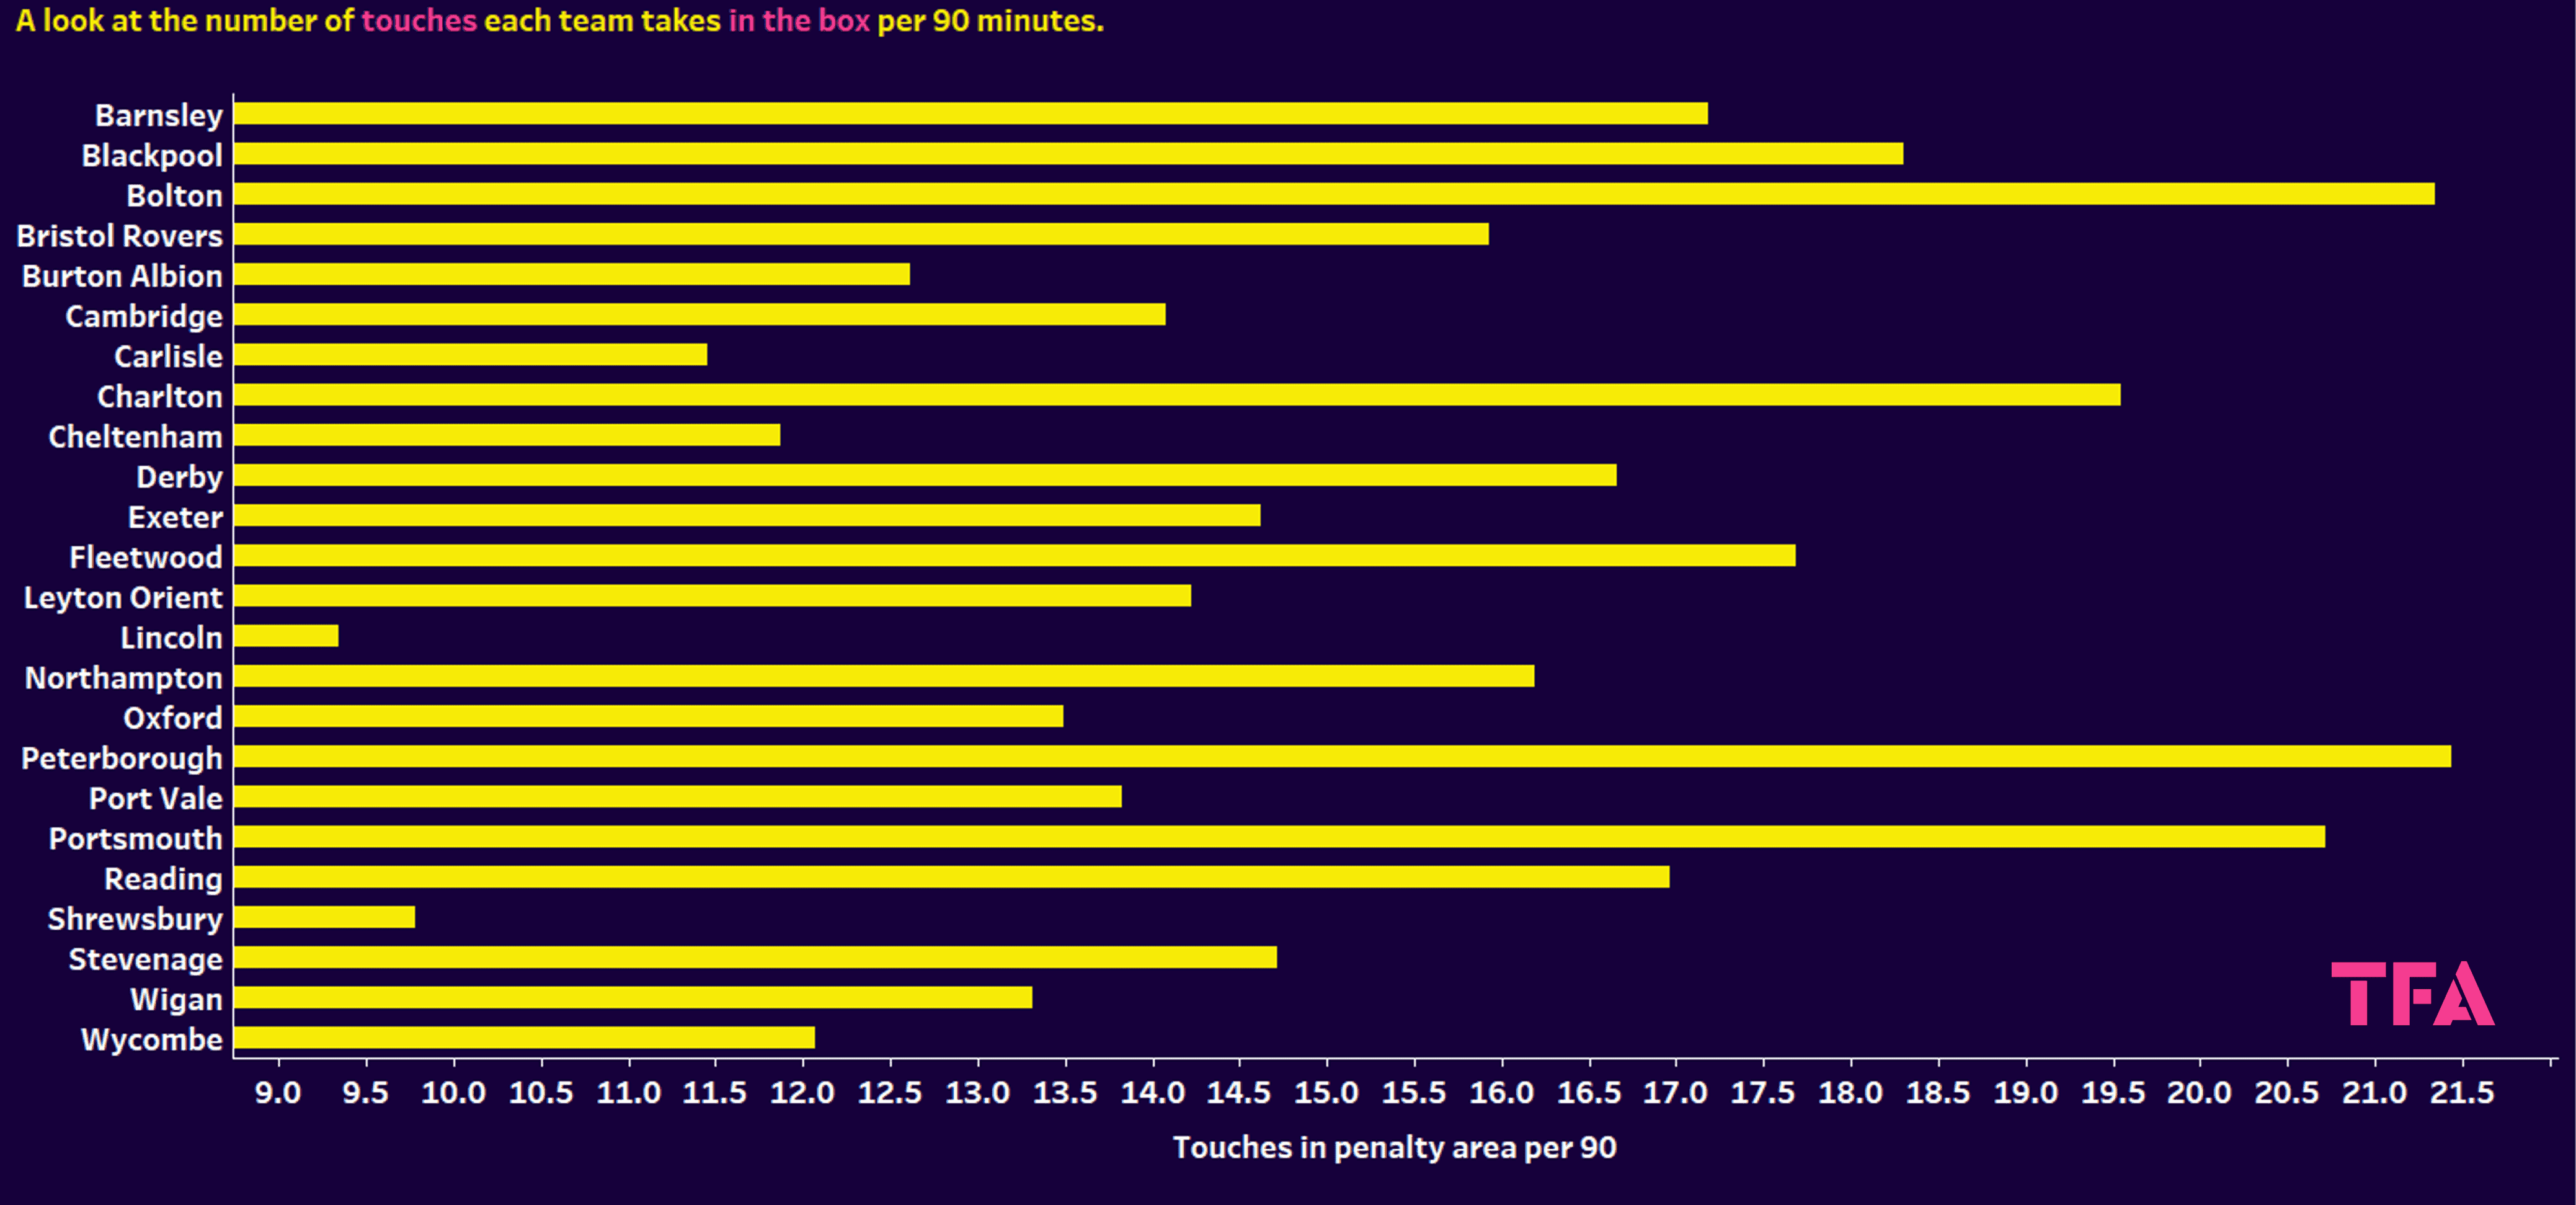
The final data to be put under the analysis microscope is touches in the penalty area per 90 – a good way of seeing how active teams are in attack. However, like some of the other stats talked about in this data analysis, this metric should also be considered alongside a team’s tactics – a low rank for this stat doesn’t necessarily mean a team is bad at attacking.
Lincoln are a good example of this – they have a low possession rate, as discussed earlier, so their attacking chances are often quick and snappy, with no time or need for patient play in and around the final third, hence their low register in this graph (9.34 touches in box per 90). Yet, they’ve been more than adequate on and off the ball so far.
The trend often goes that the higher a team’s possession rate, the more touches in the box they average. Pompey and Posh have had strong attacking starts to the season, as mentioned, and they match the description of having an above-average possession rate while also being highly active in the penalty box. In fact, Bolton also follows this trend more than anyone in the league.
Conclusion
There are some inspiring attacking teams this season in League One, with various tactics on display. The data in this analysis has highlighted some of the most effective teams in attack and in line with their tactics.
Despite opting for a non-possession-based style of football, Lincoln has found a way to still be dangerous in front of goal and has established themselves as a tricky team to play against. Portsmouth have found a knack for wing play and look very strong in attacking crosses, while Stevenage have been seen to create quality chances out of little possession.
Thus, there is no “meta” League One tactic – success comes from a combination of managerial ability – understanding his players and their ability, building tactics that suit them, and the players buying into said tactical philosophy and blossoming in such a setup that suits them.


Comments