The EPL, La Liga and Bundesliga were all completed in the 2019/20 season. However, the Belgian First Division A was one of the first leagues in Europe to be permanently cancelled due to COVID-19. Whilst the league was not fully concluded in 2019/20, the restart of the competition for the 2020/21 is scheduled for the 8th of August 2020. This data analysis will utilise data, statistics and analysis from the 2019/20 season to appraise each team and provide a preview for the 2020/21 Belgian First Division A. Key information will include each team’s manager, formation, attacking performance, defensive performance, a summary of their strengths to reinforce and weaknesses to improve.
2019/20 summary
When the league was cancelled, Club Brugge were crowned champions. There was no championship round, but it is clear to see, given their points tally, that Club Brugge were the best team in the league and would have been clear favourites going into the championship round. By winning the league, Club Brugge earned a spot in the UEFA Champions League, Gent took a UEFA Champions League qualifying spot, Charleroi were entered into the Europa League qualifying. Antwerp finished below Charleroi but gained entry to the Europa League group stage directly due to beating Club Brugge in the recently rescheduled Belgian Cup Final. With the Europa League play-offs cancelled, Standard Liège were awarded a Europa League qualifying spot due to finishing 5th.
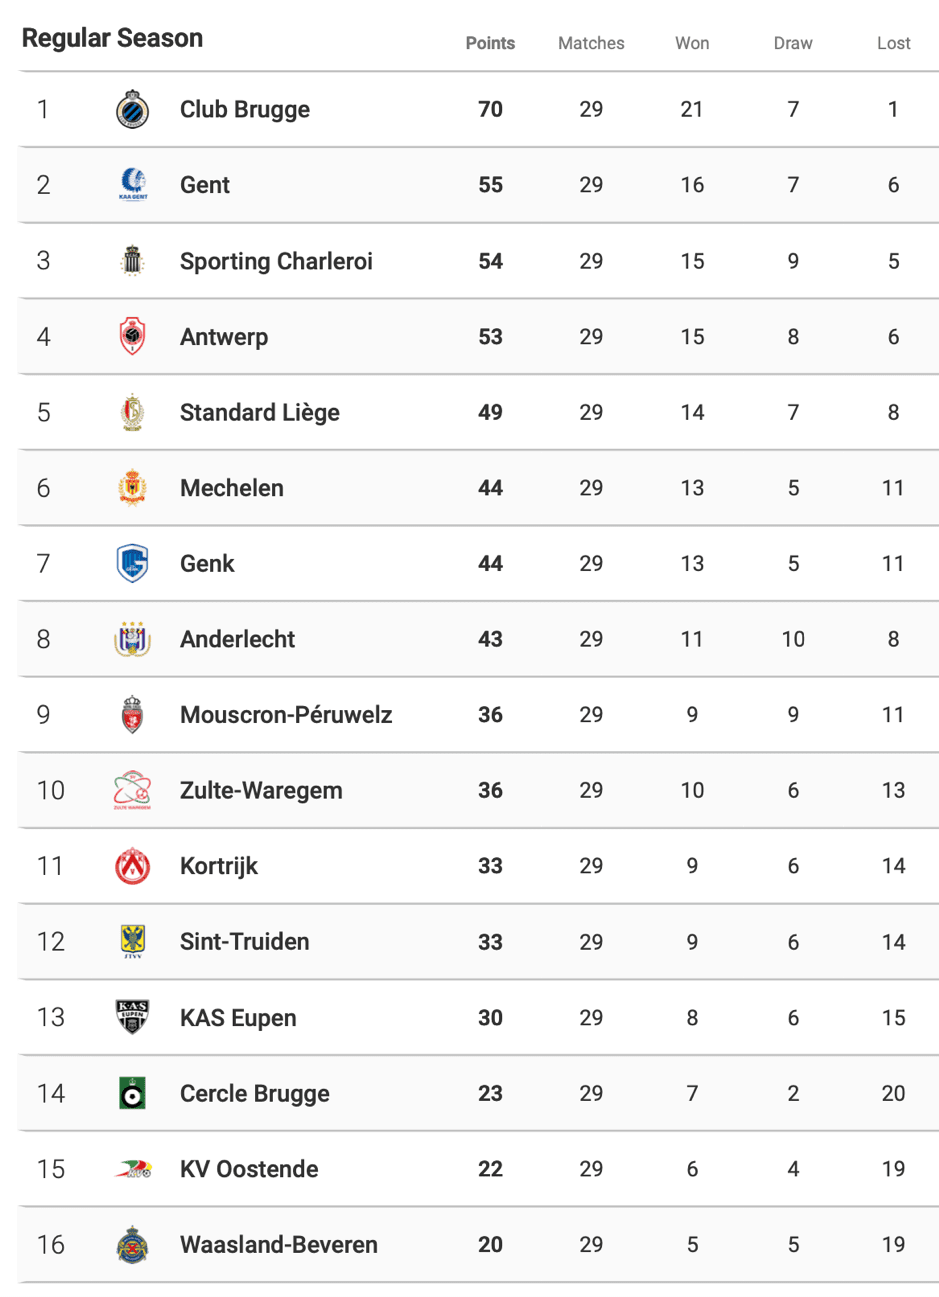
Waasland-Beveren finished last but were spared relegation due to a vote to expand the league from 16 to 18 teams. This change resulted in both teams in the promotion play-offs in the Belgian First Division B, Beerschot and OH Leuven, both being promoted to the expanded Belgian First Division A.
2020/21 preview
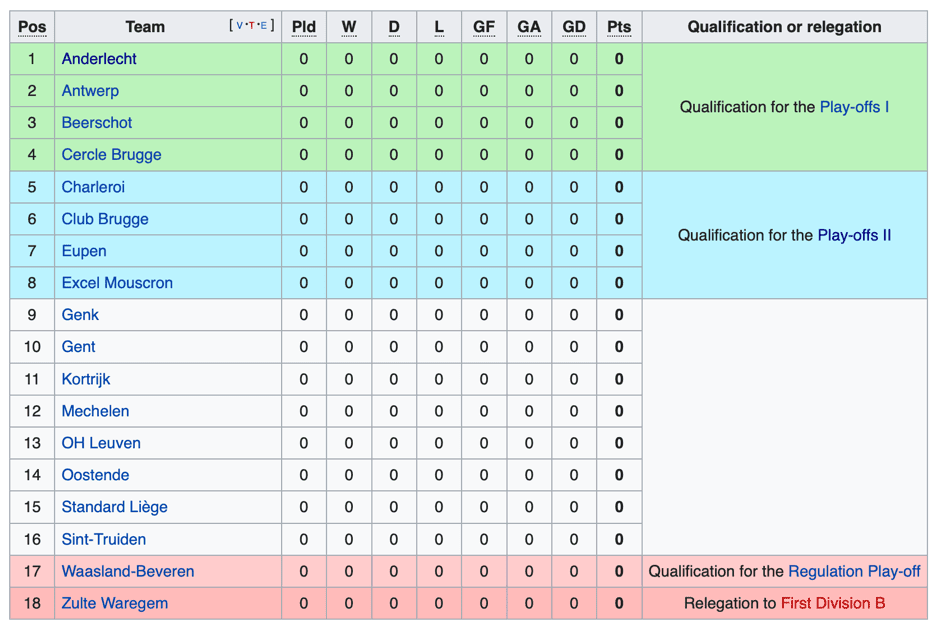
Due to the league expansion, there have also been changes to the championship round, Europa League play-offs and relegation for the 2020/21 season. The whole league system in Belgium can get very complicated, so all of the ins and outs will not be explained.
Teams will compete in a traditional league format, after all, scheduled matches, clubs will split off into different play-offs or suffer outcomes depending on their position. Now, the championship round, aka Play-offs I, only involves the top four teams, compared to the top eight in previous seasons. The Europa League playoffs, aka Play-offs II, involving teams from the First Division A and B, have been amended to only include the fifth to eighth-placed teams in Division A.
The top three teams after Play-off I will gain a place in European competition, the top two in the Champions League and third in the Europa League. The fourth-placed team after Play-off I will play the first-place team in Play-off II for a Europa League qualifying spot. The Belgian Cup winner will be awarded a Europa League group stage place and may create an extra Europa League qualifying spot, presumably for the losing team in the Play-off I vs Play-off II match up.
Relegation is a little simpler, the team finishing bottom, in 18th position, will be relegated with the first-place team in the Belgian First Division B promoted. 17th place in Division A will have a play-off against the 2nd place in Division B to try and secure their top-flight status.
Now we know the new league format, we can preview each team. All data and statistics are from the 2019/20 season, used to preview the upcoming 2020/21 season. For many stats, the league ranking is presented in brackets. For Belgian First Division A teams, there are 16 teams, for the Belgian First Division B, there are 8, this is stated when presenting Division B stats as a reminder.
Where a percentage is presented in brackets, this is the percentage of goals scored or conceded via such offensive or defensive moment. For pass length stats, the higher the length the lower the ranking. For PPDA, the lower the PPDA the lower the rank. This is not to suggest a higher pass length or lower PPDA is more successful because pass length and PPDA are stylistic, but it uses the notion that average pass length should be measured in ascending order as length increases, and PPDA should be measured in descending order as pressing intensity increases.
Anderlecht

Finishing position 2019/20: 8th
Manager: Vincent Kompany & Franky Vercauteren
Average Formation: 4-2-3-1

Attacking play:
| Possession P90 (%) | Passes P90 | Average Pass Length (m) | Dribbles P90 | Crosses P90 | |
| Anderlecht | 56 (3rd) | 477.08 (2nd) | 19.69 (15th Highest) | 29.25 (4th) | 14.59 (10th) |
| League Average | 49.9 | 388.64 | 20.63 | 27.04 | 15.03 |
| xG For | Goals Scored | xG For vs Goals Scored Differential | |
| Anderlecht | 45.41 (6th) | 45 (Joint 7th) | 0.41 Underperformance |
| League Average | 40.36 | 39.8 | 0.56 Underperformance |
| Total Goals Scored | Long Shot Goals | Counter Attack Goals | Goals After Set Pieces | Direct Freekick and Penalty Goals | |
| Anderlecht | 45 (7th) | 3 (7%) (13th) | 4 (9%) (Joint 7th) | 3 (7%) (Joint 13th) | 7 (16%) (Joint 3rd) |
| League Average | 40.9 | 5.5 | 4.7 | 6.6 | 4.8 |
Defensive Play:
| PPDA | |
| Anderlecht | 9 (7th Lowest) |
| League Average | 9.71 |
| xG Against | Goals Conceded | xG Against vs Goal Conceded Differential | |
| Anderlecht | 41.61 (8th) | 29 (3rd) | 12.61 Overperformance |
| League Average | 40.36 | 40.9 | -0.54 Underperformance |
| Total Goals Conceded | Long Shot Goals | Counter Attack Goals | Goals After Set Pieces | Direct Freekick and Penalty Goals | |
| Anderlecht | 29 (3rd) | 3 (10%) (2nd) | 2 (7%) (Joint 3rd) | 3 (10%) (2nd) | 2 (7%) (Joint 1st) |
| League Average | 40.9 | 5.5 | 4.7 | 6.6 | 4.8 |
Overview:
Anderlecht’s main strength last season was their defence. The defence and goalkeeper managed to prevent a significant number of expected goals, putting Anderlecht towards the top of the defensive metrics. Regression towards the mean is likely with their defensive metrics, so they would benefit from reducing their xG against. Their main area of improvement comes in offensive metrics, if they are to rise up the league from 8th place, their xG and goals scored could be improved.
Antwerp

Finishing position 2019/20: 4th
Manager: Ivan Leko
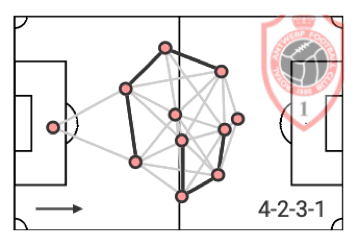
Average Formation: 4-2-3-1
Attacking play:
| Possession P90 (%) | Passes P90 | Average Pass Length (m) | Dribbles P90 | Crosses P90 | |
| Antwerp | 48 (11th) | 342.80 (13th) | 20.69 (8th Highest) | 28.59 (7th) | 15.84 (7th) |
| League Average | 49.9 | 388.64 | 20.63 | 27.04 | 15.03 |
| xG For | Goals Scored | xG For vs Goals Scored Differential | |
| Antwerp | 50.92 (3rd) | 49 (Joint 3rd) | 1.92 Underperformance |
| League Average | 40.36 | 39.8 | 0.56 Underperformance |
| Total Goals Scored | Long Shot Goals | Counter Attack Goals | Goals After Set Pieces | Direct Freekick and Penalty Goals | |
| Antwerp | 49 (Joint 3rd) | 5 (10%) (Joint 9th) | 3 (6%) (Joint 11th) | 4 (8%) (Joint 10th) | 12 (24%) (1st) |
| League Average | 40.9 | 5.5 | 4.7 | 6.6 | 4.8 |
Defensive Play:
| PPDA | |
| Antwerp | 8.46 (4th Lowest) |
| League Average | 9.71 |
| xG Against | Goals Conceded | xG Against vs Goal Conceded Differential | |
| Antwerp | 34.84 (5th) | 32 (4th) | 2.84 Overperformance |
| League Average | 40.36 | 40.9 | -0.54 Underperformance |
| Total Goals Conceded | Long Shot Goals | Counter Attack Goals | Goals After Set Pieces | Direct Freekick and Penalty Goals | |
| Antwerp | 32 (4th) | 4 (13%) (Joint 3rd) | 3 (9%) (Joint 5th) | 10 (31%) (Joint 13th) | 2 (6%) (Joint 1st) |
| League Average | 40.9 | 5.5 | 4.7 | 6.6 | 4.8 |
Overview:
Ivan Leko is a new manager for Antwerp, so it will be interesting to see what he changes. In terms of data, Antwerp’s league position is consistent with the data. The one data point to notice is the proportion of goals scored from penalties and direct free kick. Such goals accounted for 24% of their goals last season. This is a strength, but, they would benefit from improving their offensive ability in other game moments to avoid a reliance on penalties and direct free kicks.
Beerschot

Finishing position 2019/20: Champions of Belgian First Division B
Manager: Hernán Losada
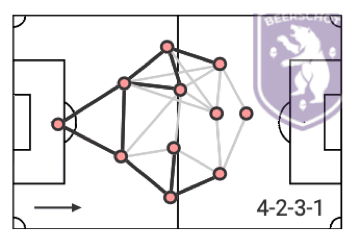
Average Formation: 4-2-3-1
Attacking play:
| Possession P90 (%) | Passes P90 | Average Pass Length (m) | Dribbles P90 | Crosses P90 | |
| Beerschot First Division B Stats | 52 (2nd/8) | 376.28 (5th/8) | 21.92 (1st/Highest/8) | 26.08 (4th/8) | 20.23 (1st/8) |
| First Division A: League Average Stats | 49.9 | 388.64 | 20.63 | 27.04 | 15.03 |
| xG For P90 | Goals Scored P90 | xG For vs Goals Scored P90 Differential | |
| Beerschot First Division B Stats | 1.56 (2nd/8) | 1.24 (6th/8) | 0.32 Underperformance |
| First Division A League Average Stats | 1.39 | 1.37 | 0.02 Underperformance |
| Total Goals Scored | Long Shot Goals | Counter Attack Goals | Goals After Set Pieces | Direct Freekick and Penalty Goals | |
| Beerschot First Division B Stats | 36 (6th/8) | 1 (3%) (8th/8) | 6 (17%) (3rd/8) | 9 (25%) (2nd/8) | 3 (8%) (Joint 3rd/8) |
Defensive Play:
| PPDA | |
| Beerschot First Division B Stats | 8.37 (2nd Lowest/8) |
| First Division A League Average Stats | 9.71 |
| xG Against P90 | Goals Conceded P90 | xG Against vs Goal Conceded Differential | |
| Beerschot First Division B Stats | 1.38 (4th/8) | 1 (2nd/8) | 0.38 |
| First Division A League Average Stats | 1.39 | 1.41 | -0.02 |
Line
| Total Goals Conceded | Long Shot Goals | Counter Attack Goals | Goals After Set Pieces | Direct Freekick and Penalty Goals | |
| Beerschot First Division B Stats | 28 (2nd/8) | 4 (14%) (3rd/8) | 4 (14%) (Joint 4th) | 4 (14%) (2nd/8) | 2 (7%) (Joint 2nd/8) |
Overview:
Beerschot are a promoted team, so severe judgement cannot be made in terms of outcome comparisons with the First Division A. However, it appears that Beerschot based their promotion on a strong defence, conceding the second-fewest goals in their league, outperforming their xG against. They will need to continue this strength to compete in the top division, whilst offering more in an attacking sense. In offence, they are strong at scoring after set-pieces which could continue to be a successful style for them. The team offers a similar average style to the First Division A, but they tend to focus many attacks on crosses. Beerschot were one of the most intense pressing teams in the lower league and press above the average rate of the top league.
Cercle Brugge

Finishing position 2019/20: 14th
Manager: Paul Clement
Average Formation: 4-2-3-1

Attacking play:
| Possession P90 (%) | Passes P90 | Average Pass Length (m) | Dribbles P90 | Crosses P90 | |
| Cercle Brugge | 49.7 (7th) | 360.97 (12th) | 21.75 (Highest – 1st) | 29.15 (5th) | 15.16 (8th) |
| League Average | 49.9 | 388.64 | 20.63 | 27.04 | 15.03 |
| xG For | Goals Scored | xG For vs Goals Scored Differential | |
| Cercle Brugge | 33.93 (11th) | 27 (15th) | 6.93 Underperformance |
| League Average | 40.36 | 39.8 | 0.56 Underperformance |
| Total Goals Scored | Long Shot Goals | Counter Attack Goals | Goals After Set Pieces | Direct Freekick and Penalty Goals | |
| Cercle Brugge | 27 (15th) | 5 (19%) (Joint 9th) | 2 (7%) (Joint 14th) | 3 (11%) (Joint 14th) | 5 (19%) (9th) |
| League Average | 40.9 | 5.5 | 4.7 | 6.6 | 4.8 |
Defensive Play:
| PPDA | |
| Cercle Brugge | 8.99 (6th Lowest) |
| League Average | 9.71 |
| xG Against | Goals Conceded | xG Against vs Goal Conceded Differential | |
| Cercle Brugge | 40.22 (7th) | 54 (14th) | -13.78 Underperformance |
| League Average | 40.36 | 40.9 | -0.54 Underperformance |
| Total Goals Conceded | Long Shot Goals | Counter Attack Goals | Goals After Set Pieces | Direct Freekick and Penalty Goals | |
| Cercle Brugge | 54 (14th) | 8 (15%) (Joint 14th) | 10 (19%) (15th) | 7 (13%) (10th) | 4 (7%) (Joint 7th) |
| League Average | 40.9 | 5.5 | 4.7 | 6.6 | 4.8 |
Overview:
Paul Clement is a new managerial addition. One thing he will need to address is the club’s severe underperformance to xG when attacking and defending, defending especially. Cercle Brugge were ranked 7th for xG created but 14th for goals conceded, matching the position the club finished in. A deeper insight as to the reasons for such underperformance will need to be done, but it could be that the Cercle Brugge goalkeeper needs to improve their shot-stopping and/or defenders need to contribute more via blocks. In attack, Cercle Brugge ranked 15th for goals scored, if they had scored as expected, they would have ranked 12th and likely boosted their league position. For the strikers, a change in luck along with improvement in finishing in is needed. Alternatively, superior reinforcements could be sought in the transfer window.
Charleroi

Finishing position 2019/20: 3rd
Manager: Karim Belhocine
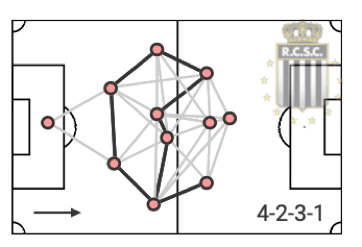
Average Formation: 4-2-3-1
Attacking play:
| Possession P90 (%) | Passes P90 | Average Pass Length (m) | Dribbles P90 | Crosses P90 | |
| Charleroi | 46 (13th) | 326.46 (15th) | 21.22 (4th Highest) | 27.44 (9th) | 12.19 (13th) |
| League Average | 49.9 | 388.64 | 20.63 | 27.04 | 15.03 |
| xG For | Goals Scored | xG For vs Goals Scored Differential | |
| Charleroi | 43.07 (7th) | 49 (Joint 3rd) | -5.93 Overperformance |
| League Average | 40.36 | 39.8 | 0.56 Underperformance |
| Total Goals Scored | Long Shot Goals | Counter Attack Goals | Goals After Set Pieces | Direct Freekick and Penalty Goals | |
| Charleroi | 49 (Joint 3rd) | 8 (16%) (2nd) | 13 (27%) (1st) | 6 (12%) (Joint 7th) | 6 (12%) (Joint 5th) |
| League Average | 40.9 | 5.5 | 4.7 | 6.6 | 4.8 |
Defensive Play:
| PPDA | |
| Charleroi | 8.78 (5th Lowest) |
| League Average | 9.71 |
| xG Against | Goals Conceded | xG Against vs Goal Conceded Differential | |
| Charleroi | 30.32 (2nd) | 23 (2nd) | 7.32 Overperformance |
| League Average | 40.36 | 40.9 | -0.54 Underperformance |
| Total Goals Conceded | Long Shot Goals | Counter Attack Goals | Goals After Set Pieces | Direct Freekick and Penalty Goals | |
| Charleroi | 23 (2nd) | 5 (22%) (Joint 7th) | 1 (4%) (Joint 1st) | 4 (17%) (Joint 3rd) | 4 (17%) (Joint 7th) |
| League Average | 40.9 | 5.5 | 4.7 | 6.6 | 4.8 |
Overview:
Charleroi are an interesting team who finished 3rd last season. They do not dominate possession and instead rely on a direct style of play, usually via counter-attacks to score a lot of their goals. The team overperformed in both offensive and defence, meaning their attackers, defenders and goalkeeper deserve credit. Regression to the mean is likely, this is not an issue in defence, where their xG against was ranked 2nd, but their xG for was ranked 7th. In this case, they will need their attackers to continue to be clinical and hopefully produce more chances, most likely from counter-attacking moments, if not from general play, to push higher up the table.
Club Brugge

Finishing position 2019/20: Champions of the Belgian First Division A
Manager: Philippe Clement
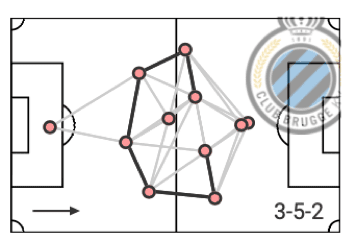
Average Formation: 3-5-2
Attacking play:
| Possession P90 (%) | Passes P90 | Average Pass Length (m) | Dribbles P90 | Crosses P90 | |
| Club Brugge | 59.4 (1st) | 487 (1st) | 20.38 (7th Highest) | 32.67 (1st) | 18.13 (2nd) |
| League Average | 49.9 | 388.64 | 20.63 | 27.04 | 15.03 |
| xG For | Goals Scored | xG For vs Goals Scored Differential | |
| Club Brugge | 56.92 (1st) | 58 (2nd) | -1.08 Overperformance |
| League Average | 40.36 | 39.8 | 0.56 Underperformance |
| Total Goals Scored | Long Shot Goals | Counter Attack Goals | Goals After Set Pieces | Direct Freekick and Penalty Goals | |
| Club Brugge | 58 (2nd) | 7 (12%) (Joint 2nd) | 4 (7%) (Joint 6th) | 14 (24%) (1st) | 2 (3%) (Joint 14th) |
| League Average | 40.9 | 5.5 | 4.7 | 6.6 | 4.8 |
Defensive Play:
| PPDA | |
| Club Brugge | 6.73 (1st – Lowest) |
| League Average | 9.71 |
| xG Against | Goals Conceded | xG Against vs Goal Conceded Differential | |
| Club Brugge | 23.12 (1st) | 14 (1st) | 9.12 Overperformance |
| League Average | 40.36 | 40.9 | -0.54 Underperformance |
| Total Goals Conceded | Long Shot Goals | Counter Attack Goals | Goals After Set Pieces | Direct Freekick and Penalty Goals | |
| Club Brugge | 14 (1st) | 1 (7%) (1st) | 1 (7%) (Joint 1st) | 2 (14%) (1st) | 2 (14%) (Joint 1st) |
| League Average | 40.9 | 5.5 | 4.7 | 6.6 | 4.8 |
Overview:
There isn’t too much that needs to be said with Club Brugge. They dominated the league and were ranked first for most metrics. They dominate the ball and do not give their opponents time to settle. They did score a large proportion of their goals after set-pieces, which could be nullified by opponents so keeping routines fresh will be important in their league defence. They have no significant moment weaknesses in defence. The club did overperform in xG against, but, their expectation of goals conceded was still the best in the league. More of the same is needed for Club Brugge and any improvements could create a bigger gap between them and second place.
Excel Mouscron

Finishing position 2019/20: 10th
Manager: Fernando Da Cruz
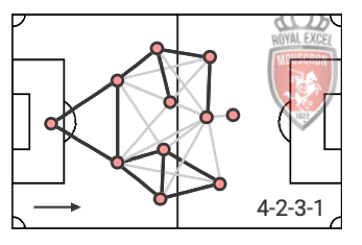
Average Formation: 4-2-3-1
Attacking play:
| Possession P90 (%) | Passes P90 | Average Pass Length (m) | Dribbles P90 | Crosses P90 | |
| Excel Mouscron | 48.8 (10th) | 386.05 (8th) | 21.32 (2ndHighest) | 22.96 (14th) | 12.30 (12th) |
| League Average | 49.9 | 388.64 | 20.63 | 27.04 | 15.03 |
| xG For | Goals Scored | xG For vs Goals Scored Differential | |
| Excel Mouscron | 30.54 (14th) | 38 (11th) | -7.46 Overperformance |
| League Average | 40.36 | 39.8 | 0.56 Underperformance |
| Total Goals Scored | Long Shot Goals | Counter Attack Goals | Goals After Set Pieces | Direct Freekick and Penalty Goals | |
| Excel Mouscron | 38 (11th) | 7 (18%) (Joint 3rd) | 5 (13%) (Joint 5th) | 9 (24%) (Joint 4th) | 6 (16%) (Joint 4th) |
| League Average | 40.9 | 5.5 | 4.7 | 6.6 | 4.8 |
Defensive Play:
| PPDA | |
| Excel Mouscron | 9.35 (8th Lowest) |
| League Average | 9.71 |
| xG Against | Goals Conceded | xG Against vs Goal Conceded Differential | |
| Excel Mouscron | 43.89 (11th) | 40 (7th) | 3.89 Overperformance |
| League Average | 40.36 | 40.9 | -0.54 Underperformance |
| Total Goals Conceded | Long Shot Goals | Counter Attack Goals | Goals After Set Pieces | Direct Freekick and Penalty Goals | |
| Excel Mouscron | 40 (7th) | 7 (18%) (Joint 10th) | 2 (5%) (Joint 2nd) | 4 (10%) (Joint 3rd) | 2 (5%) (Joint 1st) |
| League Average | 40.9 | 5.5 | 4.7 | 6.6 | 4.8 |
Overview:
Mouscron, like many other teams, have a new manager for this season. This is likely to cause a change in the Mouscron game model and see them alter their data for the 2020/21 season. Looking back, Mouscron have been more effective in defence compared to attack. An overperformance in both xG and xG against ids present, but their defending metrics have a superior ranking. Mouscron score a lot of their goals after set-pieces, which is a strength but an over-reliance should be avoided. Mouscron do not appear to be weak in defending a certain situation which puts them in a good position going into the season.
Genk

Finishing position 2019/20: 7th
Manager: Hannes Wolf
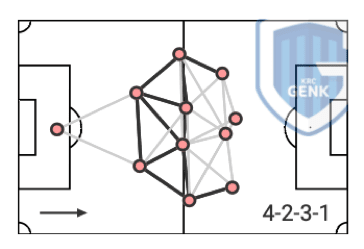
Average Formation: 4-2-3-1
Attacking play:
| Possession P90 (%) | Passes P90 | Average Pass Length (m) | Dribbles P90 | Crosses P90 | |
| Genk | 54.2 (4th) | 425.12 (4th) | 19.87 (14thLowest) | 30.96 (2nd) | 18.03 (3rd) |
| League Average | 49.9 | 388.64 | 20.63 | 27.04 | 15.03 |
| xG For | Goals Scored | xG For vs Goals Scored Differential | |
| Genk | 48.30 (4th) | 45 (7th) | 3.30 Underperformance |
| League Average | 40.36 | 39.8 | 0.56 Underperformance |
| Total Goals Scored | Long Shot Goals | Counter Attack Goals | Goals After Set Pieces | Direct Freekick and Penalty Goals | |
| Genk | 45 (7th) | 1 (2%) (16th) | 4 (9%) (Joint 7th) | 9 (20%) (Joint 4th) | 3 (7%) (Joint 9th) |
| League Average | 40.9 | 5.5 | 4.7 | 6.6 | 4.8 |
Defensive Play:
| PPDA | |
| Genk | 8.23 (3rd Lowest) |
| League Average | 9.71 |
| xG Against | Goals Conceded | xG Against vs Goal Conceded Differential | |
| Genk | 35.94 (6th) | 42 (8th) | -6.06 Underperformance |
| League Average | 40.36 | 40.9 | -0.54 Underperformance |
| Total Goals Conceded | Long Shot Goals | Counter Attack Goals | Goals After Set Pieces | Direct Freekick and Penalty Goals | |
| Genk | 42 (8th) | 4 (10%) (Joint 3rd) | 6 (14%) (13th) | 9 (21%) (12th) | 2 (5%) (Joint 1st) |
| League Average | 40.9 | 5.5 | 4.7 | 6.6 | 4.8 |
Overview:
Genk finished 7th. They press quite intensely, dribble lots with the ball and score a fifth of their goals after set-pieces. Whilst this is a strength for Genk, they are also susceptible to conceding after set pieces, something for the coaches to look into ready for the upcoming season. The good thing for Genk is they finished 7th but underperformed, should performances return to expectation, they can expect better results, points and maybe a higher position to challenge for a European spot this season.
Gent

Finishing position 2019/20: 2nd
Manager: Jess Thorup
Average Formation: 4-2-3-1
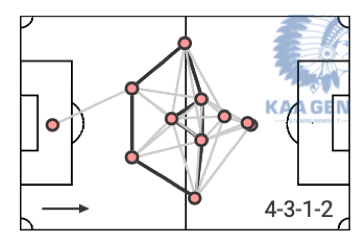
Attacking play:
| Possession P90 (%) | Passes P90 | Average Pass Length (m) | Dribbles P90 | Crosses P90 | |
| Gent | 57.1 (2nd) | 461.23 (3rd) | 19.65 (16th – Lowest) | 29.10 (6th) | 17.26 (5th) |
| League Average | 49.9 | 388.64 | 20.63 | 27.04 | 15.03 |
| xG For | Goals Scored | xG For vs Goals Scored Differential | |
| Gent | 53.73 (2nd) | 59 (1st) | -5.27 Overperformance |
| League Average | 40.36 | 39.8 | 0.56 Underperformance |
| Total Goals Scored | Long Shot Goals | Counter Attack Goals | Goals After Set Pieces | Direct Freekick and Penalty Goals | |
| Gent | 59 (1st) | 5 (8%) (Joint 9th) | 10 (17%) (2nd) | 6 (10%) (Joint 8th) | 7 (12%) (Joint 3rd) |
| League Average | 40.9 | 5.5 | 4.7 | 6.6 | 4.8 |
Defensive Play:
| PPDA | |
| Gent | 7.97 (2nd Lowest) |
| League Average | 9.71 |
| xG Against | Goals Conceded | xG Against vs Goal Conceded Differential | |
| Gent | 33 (4th) | 34 (6th) | -1 Underperformance |
| League Average | 40.36 | 40.9 | -0.54 Underperformance |
| Total Goals Conceded | Long Shot Goals | Counter Attack Goals | Goals After Set Pieces | Direct Freekick and Penalty Goals | |
| Gent | 34 (6th) | 5 (15%) (Joint 7th) | 4 (12%) (Joint 7th) | 6 (18%) (Joint 8th) | 6 (18%) (13th) |
| League Average | 40.9 | 5.5 | 4.7 | 6.6 | 4.8 |
Overview:
Gent finished as runners up last season. On the face of it, this looks like it was mainly due to their general strength in attack. They scored the most goals in the league, albeit with an over-performance to xG, they press high and have a lot of possession and have good metrics across the board. Their goals conceded is ranked 6th so in comparison to goals scored, this is the area to improve for Gent to close the gap to Club Burgee.
KAS Eupen

Finishing position 2019/20: 13th
Manager: Beñat San José
Average Formation: 4-2-3-1
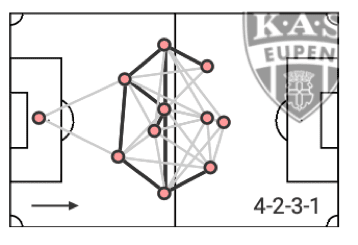
Attacking play:
| Possession P90 (%) | Passes P90 | Average Pass Length (m) | Dribbles P90 | Crosses P90 | |
| KAS Eupen | 45 (14th) | 366.70 (10th) | 21.01 (Joint 6th Highest) | 17.94 (16th) | 14.44 (11th) |
| League Average | 49.9 | 388.64 | 20.63 | 27.04 | 15.03 |
| xG For | Goals Scored | xG For vs Goals Scored Differential | |
| KAS Eupen | 26.81 (15th) | 28 (14th) | -1.19 Overperformance |
| League Average | 40.36 | 39.8 | 0.56 Underperformance |
| Total Goals Scored | Long Shot Goals | Counter Attack Goals | Goals After Set Pieces | Direct Freekick and Penalty Goals | |
| KAS Eupen | 28 (14th) | 7 (25%) (Joint 3rd) | 2 (7%) (Joint 14th) | 9 (32%) (Joint 4th) | 4 (14%) (Joint 8th) |
| League Average | 40.9 | 5.5 | 4.7 | 6.6 | 4.8 |
Defensive Play:
| PPDA | |
| KAS Eupen | 11.31 (13th Lowest) |
| League Average | 9.71 |
| xG Against | Goals Conceded | xG Against vs Goal Conceded Differential | |
| KAS Eupen | 47.53 (13th) | 51 (13th) | -3.47 Underperformance |
| League Average | 40.36 | 40.9 | -0.54 Underperformance |
| Total Goals Conceded | Long Shot Goals | Counter Attack Goals | Goals After Set Pieces | Direct Freekick and Penalty Goals | |
| KAS Eupen | 51 (13th) | 7 (14%) (Joint 12th) | 5 (10%) (Joint 9th) | 8 (16%) (11th) | 5 (10%) (Joint 11th) |
| League Average | 40.9 | 5.5 | 4.7 | 6.6 | 4.8 |
Overview:
KAS Eupen finished 13th last season and their metrics reflect this. They have little possession, low dribbles and crosses per game and they favour a more relaxed pressing approach. This is reflected in the metrics as 32% of their goals come from set-pieces. Whilst this is a strength to be commended, it could also be a double-edged sword, if Eupen become predictable then a major source of their goals could be lost. In defence, they underperform compared to xG against but their rank for both xG against and goals conceded is 13th, which was also their final rank. To push on, the club and the new manager would need to adopt a more offensive mindset when appropriate and attack in set-piece situations and other forms of play to enhance their offensive numbers.
Kortrijk

Finishing position 2019/20: 11th
Manager: Yves Vanderhaeghe
Average Formation: 4-2-3-1
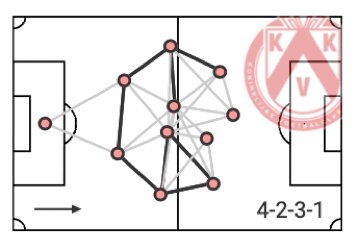
Attacking play:
| Possession P90 (%) | Passes P90 | Average Pass Length (m) | Dribbles P90 | Crosses P90 | |
| Kortrijk | 49.7 (8th) | 386.82 (7th) | 21.12 (5thHighest) | 20.82 (15th) | 17.84 (4th) |
| League Average | 49.9 | 388.64 | 20.63 | 27.04 | 15.03 |
| xG For | Goals Scored | xG For vs Goals Scored Differential | |
| Kortrijk | 40.55 (10th) | 40 (10th) | 0.55 Underperformance |
| League Average | 40.36 | 39.8 | 0.56 Underperformance |
| Total Goals Scored | Long Shot Goals | Counter Attack Goals | Goals After Set Pieces | Direct Freekick and Penalty Goals | |
| Kortrijk | 40 (10th) | 7 (18%) (Joint 3rd) | 4 (10%) (Joint 7th) | 11 (28%) (3rd) | 4 (10%) (Joint 8th) |
| League Average | 40.9 | 5.5 | 4.7 | 6.6 | 4.8 |
Defensive Play:
| PPDA | |
| Kortrijk | 9.36 (9th Lowest) |
| League Average | 9.71 |
| xG Against | Goals Conceded | xG Against vs Goal Conceded Differential | |
| Kortrijk | 46.99 (12th) | 44 (10th) | 2.99 Overperformance |
| League Average | 40.36 | 40.9 | -0.54 Underperformance |
| Total Goals Conceded | Long Shot Goals | Counter Attack Goals | Goals After Set Pieces | Direct Freekick and Penalty Goals | |
| Kortrijk | 44 (10th) | 4 (9%) (Joint 3rd) | 3 (7%) (5th) | 6 (14%) (Joint 8th) | 12 (27%) (15th) |
| League Average | 40.9 | 5.5 | 4.7 | 6.6 | 4.8 |
Overview:
Kortrijk like to play the ball in a more direct fashion compared to other teams in the league and put more crosses into the box. They finished 11th and their goals scored, goals conceded and expected metrics match this. They are another team who score a lot after set-pieces which is a positive to strengthen but also to be cautious about, with many teams conducting in-depth set piece analysis to determine routines and nullify opposition. Kortrijk do concede a lot of goals from direct freekicks and penalties, so decreasing this number, potentially high due to silly fouls in and around the box, will help Kortrijk this season.
Mechelen

Finishing position 2019/20: 6th
Manager: Wouter Vrancken
Average Formation: 4-4-2
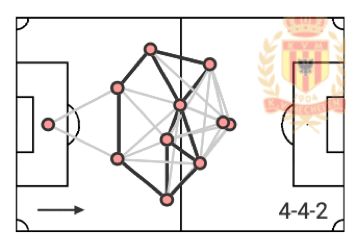
Attacking play:
| Possession P90 (%) | Passes P90 | Average Pass Length (m) | Dribbles P90 | Crosses P90 | |
| Mechelen | 46.7% (12th) | 361.38 (11th) | 20 (13thHighest) | 25.26 (13th) | 16.07 (6th) |
| League Average | 49.9 | 388.64 | 20.63 | 27.04 | 15.03 |
| xG For | Goals Scored | xG For vs Goals Scored Differential | |
| Mechelen | 41.31 (8th) | 46 (6th) | -4.69 Overperformance |
| League Average | 40.36 | 39.8 | 0.56 Underperformance |
| Total Goals Scored | Long Shot Goals | Counter Attack Goals | Goals After Set Pieces | Direct Freekick and Penalty Goals | |
| Mechelen | 46 (6th) | 7 (15%) (Joint 3rd) | 5 (11%) (Joint 5th) | 13 (28%) (2nd) | 3 (7%) (Joint 13th) |
| League Average | 40.9 | 5.5 | 4.7 | 6.6 | 4.8 |
Defensive Play:
| PPDA | |
| Mechelen | 11.10 (12th Lowest) |
| League Average | 9.71 |
| xG Against | Goals Conceded | xG Against vs Goal Conceded Differential | |
| Mechelen | 42.6 (10th) | 43 (9th) | -0.4 Underperformance |
| League Average | 40.36 | 40.9 | -0.54 Underperformance |
| Total Goals Conceded | Long Shot Goals | Counter Attack Goals | Goals After Set Pieces | Direct Freekick and Penalty Goals | |
| Mechelen | 43 (9th) | 8 (19%) (Joint 14th) | 5 (12%) (Joint 9th) | 10 (23%) (Joint 13th) | 2 (5%) (Joint 1st) |
| League Average | 40.9 | 5.5 | 4.7 | 6.6 | 4.8 |
Overview:
Mechelen’s data is quite straight forward, they do not dominate possession, they play a more direct style and like to cross the ball. They overperformed in terms of goals scored and were ranked 10th for xG against, a high rank for a team finishing 6th in the league. Despite finishing 6th, which is a successful season, Mechelen were effective at scoring long shots, scoring after counter-attacks and after set-pieces, although they also rank poorly for conceding from long shots and after set-pieces.
OH Leuven

Finishing position 2019/20: Runner-up in Belgian First Division B
Manager: Marc Brys
Average Formation: 4-2-3-1

Attacking play:
| Possession P90 (%) | Passes P90 | Average Pass Length (m) | Dribbles P90 | Crosses P90 | |
| OH Leuven First Division B Stats | 46.1 (7th/8) | 357.67 (8th/8) | 21.01 (2ndHighest/8) | 28.78 (3rd/8) | 20.08 (2nd/8) |
| First Division A League Average Stats | 49.9 | 388.64 | 20.63 | 27.04 | 15.03 |
| xG For | Goals Scored | xG For vs Goals Scored Differential | |
| OH Leuven First Division B Stats | 1.45 (3rd/8) | 1.53 (1st/8) | -0.08 Overperformance |
| First Division A League Average Stats | 1.39 | 1.37 | 0.02 Underperformance |
| Total Goals Scored | Long Shot Goals | Counter Attack Goals | Goals After Set Pieces | Direct Freekick and Penalty Goals | |
| OH Leuven First Division B Stats | 46 (1st/8) | 9 (20%) (1st/8) | 8 (17%) (1st/8) | 7 (15%) (5th/8) | 2 (4%) (3rd/8) |
Defensive Play:
| PPDA | |
| OH Leuven First Division B Stats | 12.64 (6th Lowest/8) |
| First Division A League Average Stats | 9.71 |
| xG Against | Goals Conceded | xG Against vs Goal Conceded Differential | |
| OH Leuven First Division B Stats | 1.50 (6th/8) | 1.5 (6th/8) | 0.00 |
| First Division A League Average Stats | 1.39 | 1.41 | -0.02 Underperformance |
Line
| Total Goals Conceded | Long Shot Goals | Counter Attack Goals | Goals After Set Pieces | Direct Freekick and Penalty Goals | |
| OH Leuven First Division B Stats | 45 (6th/8) | 6 (13%) (6th/8) | 8 (18%) (Joint 8th/8) | 10 (22%) (Joint 6th/8) | 5 (11%) (Joint 7th/8) |
Overview:
OH Leuven are the second promoted team. The data for OH Leuven and their rankings compared to the First Division B are interesting. Leuven do not dominate the ball, do not press high and are ranked 6th/8 for conceding goals. Despite this, Leuven have the best goals per 90 in their league from last season and effectively score from long shots and counters when compared to opponents. The pendulum style of Leuven in effective attacks and poor defending will be interesting to see in the top division this year.
Oostende

Finishing position 2019/20: 15th
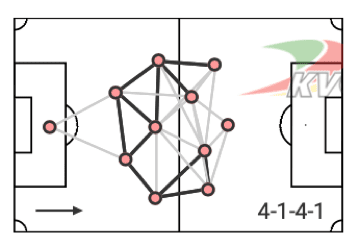
Manager: Alexander Blessin
Average Formation: 4-1-4-1
Attacking play:
| Possession P90 (%) | Passes P90 | Average Pass Length (m) | Dribbles P90 | Crosses P90 | |
| Oostende | 40.9 (16th) | 304.92 (16th) | 21.24 (3rdHighest) | 27.33 (10th) | 12.10 (14th) |
| League Average | 49.9 | 388.64 | 20.63 | 27.04 | 15.03 |
| xG For | Goals Scored | xG For vs Goals Scored Differential | |
| Oostende | 30.88 (13th) | 29 (13th) | 1.88 Underperformance |
| League Average | 40.36 | 39.8 | 0.56 Underperformance |
| Total Goals Scored | Long Shot Goals | Counter Attack Goals | Goals After Set Pieces | Direct Freekick and Penalty Goals | |
| Oostende | 29 (13th) | 2 (7%) (Joint 14th) | 3 (10%) (Joint 11th) | 1 (3%) (16th) | 3 (10%) (Joint 11th) |
| League Average | 40.9 | 5.5 | 4.7 | 6.6 | 4.8 |
Defensive Play:
| PPDA | |
| Oostende | 12.79 (16th Lowest) |
| League Average | 9.71 |
| xG Against | Goals Conceded | xG Against vs Goal Conceded Differential | |
| Oostende | 50.81 (15th) | 58 (15th) | -7.19 Underperformance |
| League Average | 40.36 | 40.9 | -0.54 Underperformance |
| Total Goals Conceded | Long Shot Goals | Counter Attack Goals | Goals After Set Pieces | Direct Freekick and Penalty Goals | |
| Oostende | 58 (15th) | 4 (7%) (Joint 3rd) | 8 (14%) (14th) | 12 (21%) (16th) | 4 (7%) (Joint 7th) |
| League Average | 40.9 | 5.5 | 4.7 | 6.6 | 4.8 |
Overview:
Oostende finished 15th last season and the data suggests reasons why. Oostende had the lowest possession per 90, the least intense press and they conceded the second most amount of goals out of all teams, their xG against also matched this. There may be underlying issues with the goalkeeper and defence after a significant underperformance in goals conceded compared to xG against, this is definitely something that the club should have looked at and it will be interesting to see the tweaks and data production this season. Oostende were slightly better in offensive metrics but were still ranked 13th. This analysis may provide a justification for why Oostende have appointed a new manager.
Standard Liège

Finishing position 2019/20: 5th
Manager: Philippe Montanier
Average Formation: 4-1-4-1

Attacking play:
| Possession P90 (%) | Passes P90 | Average Pass Length (m) | Dribbles P90 | Crosses P90 | |
| Standard Liège
|
51.5 (6th) | 383.49 (9th) | 20.87 (9th) | 27.33 (11th) | 19.24 (1st) |
| League Average | 49.9 | 388.64 | 20.63 | 27.04 | 15.03 |
| xG For | Goals Scored | xG For vs Goals Scored Differential | |
| Standard Liège | 46.26 (5th) | 47 (5th) | -0.74 Overperformance |
| League Average | 40.36 | 39.8 | 0.56 Underperformance |
| Total Goals Scored | Long Shot Goals | Counter Attack Goals | Goals After Set Pieces | Direct Freekick and Penalty Goals | |
| Standard Liège | 47 (5th) | 13 (28%) (1st) | 7 (15%) (3rd) | 4 (9%) (Joint 10th) | 2 (4%) (Joint 14th) |
| League Average | 40.9 | 5.5 | 4.7 | 6.6 | 4.8 |
Defensive Play:
| PPDA | |
| Standard Liège | 9.75 (11th Lowest) |
| League Average | 9.71 |
| xG Against | Goals Conceded | xG Against vs Goal Conceded Differential | |
| Standard Liège | 30.45 (3rd) | 32 (4th) | -1.55 Underperformance |
| League Average | 40.36 | 40.9 | -0.54 Underperformance |
| Total Goals Conceded | Long Shot Goals | Counter Attack Goals | Goals After Set Pieces | Direct Freekick and Penalty Goals | |
| Standard Liège | 32 (4th) | 7 (22%) (11th) | 4 (13%) (Joint 7th) | 5 (16%) (Joint 6th) | 4 (13%) (Joint 7th) |
| League Average | 40.9 | 5.5 | 4.7 | 6.6 | 4.8 |
Overview:
Standard Liège were successful in gaining a Europa League spot, albeit via some good fortune with the way the league cancellation was handled and the destination of the Belgian Cup. Nonetheless, the club were successful in getting into the European scene. Their data matches their final position in terms of offensive and defensive metrics. Standard put the most crosses in per 90 and score a lot of their goals from long shots. Interestingly, they also concede over 20% of goals from long shots, something both the club sand their opponents will be aware of. Unless tactics are changed or personnel altered, Standard Liège matches could be the source of more exciting long-range goals. Despite a successful season in terms of European football, Standard Liège also have a new manager.
Sint-Truiden

Finishing position 2019/20: 12th
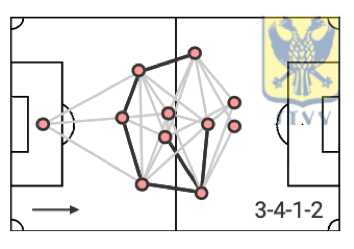
Manager: Kevin Muscat
Average Formation: 3-4-1-2
Attacking play:
| Possession P90 (%) | Passes P90 | Average Pass Length (m) | Dribbles P90 | Crosses P90 | |
| Sint-Truiden | 52.7 (5th) | 412.62 (5th) | 20.09 (12thHighest) | 30.85 (3rd) | 10.34 (16th) |
| League Average | 49.9 | 388.64 | 20.63 | 27.04 | 15.03 |
| xG For | Goals Scored | xG For vs Goals Scored Differential | |
| Sint-Truiden | 31.80 (12th) | 33 (12th) | -1.2 Overperformance |
| League Average | 40.36 | 39.8 | 0.56 Underperformance |
| Total Goals Scored | Long Shot Goals | Counter Attack Goals | Goals After Set Pieces | Direct Freekick and Penalty Goals | |
| Sint-Truiden | 33 (12th) | 2 (6%) (Joint 14th) | 3 (9%) (Joint 11th) | 6 (18%) (Joint 7th) | 1 (3%) (16th |
| League Average | 40.9 | 5.5 | 4.7 | 6.6 | 4.8 |
Defensive Play:
| PPDA | |
| Sint-Truiden | 11.41 (14th Lowest) |
| League Average | 9.71 |
| xG Against | Goals Conceded | xG Against vs Goal Conceded Differential | |
| Sint-Truiden | 54.86 (16th) | 50 (12th) | 4.86 Overperformance |
| League Average | 40.36 | 40.9 | -0.54 Underperformance |
| Total Goals Conceded | Long Shot Goals | Counter Attack Goals | Goals After Set Pieces | Direct Freekick and Penalty Goals | |
| Sint-Truiden | 50 (12th) | 9 (18%) (16th) | 5 (10% (9th) | 5 (10%) (Joint 6th) | 13 (26%) (16th) |
| League Average | 40.9 | 5.5 | 4.7 | 6.6 | 4.8 |
Overview:
Sint-Truiden finished 12th in the 2019/20 season. They like to carry the ball via dribbles, they try to dominate possession and pass the ball with a high frequency. The team does not press intensely. Sint-Truiden’s attacking stats match their position, however, the club did have the worst record for conceding chances. A big weakness to improve upon is the number of goals conceded from direct freekicks and penalties. As mentioned earlier, this could a simple error where players are too eager to win the ball and therefore give freekicks and penalties away. If those fouls are limited, the opponents’ chances are limited and Sint-Truiden could perform better defensively to improve their success. With a new manager, Sint-Truiden will be hoping the new man can galvanise the squad, enhance their strengths and eradicate their weaknesses.
Waasland-Beveren

Finishing position 2019/20: 16th
Manager: Arnauld Mercier
Average Formation: 4-2-3-1

Attacking play:
| Possession P90 (%) | Passes P90 | Average Pass Length (m) | Dribbles P90 | Crosses P90 | |
| Waasland-Beveren | 44 (15th) | 333.67 (14th) | 21.01 (Joint 6th Highest) | 25.59 (12th) | 11.84 (15th) |
| League Average | 49.9 | 388.64 | 20.63 | 27.04 | 15.03 |
| xG For | Goals Scored | xG For vs Goals Scored Differential | |
| Waasland-Beveren | 24.24 (16th) | 21 (16th) | 3.24 Underperformance |
| League Average | 40.36 | 39.8 | 0.56 Underperformance |
| Total Goals Scored | Long Shot Goals | Counter Attack Goals | Goals After Set Pieces | Direct Freekick and Penalty Goals | |
| Waasland-Beveren | 21 (16th) | 3 (14%) (Joint 12th) | 0 (16th) | 3 (14%) (Joint 13th) | 3 (14%) (Joint 11th) |
| League Average | 40.9 | 5.5 | 4.7 | 6.6 | 4.8 |
Defensive Play:
| PPDA | |
| Waasland-Beveren | 12.36 (15th Lowest) |
| League Average | 9.71 |
| xG Against | Goals Conceded | xG Against vs Goal Conceded Differential | |
| Waasland-Beveren | 47.95 (14th) | 60 (16th) | -12.05 Underperformance |
| League Average | 40.36 | 40.9 | -0.54 Underperformance |
| Total Goals Conceded | Long Shot Goals | Counter Attack Goals | Goals After Set Pieces | Direct Freekick and Penalty Goals | |
| Waasland-Beveren | 60 (16th) | 6 (10%) (Joint 9th) | 5 (8%) (Joint 9th) | 10 (17%) (Joint 13th) | 7 (12%) (14th) |
| League Average | 40.9 | 5.5 | 4.7 | 6.6 | 4.8 |
Overview:
Waasland-Beveren were set to be relegated after finishing last, the decision to create an 18 team league has saved them. The big question is, can they finish above two other teams to definitely maintain their top-flight status. It is hard to compare to the promoted teams, but in terms of the First Division A sample, Waasland-Bevern had the worst attack and defence, hence their bottom-placed finish. In defence, the goalkeeper and defenders underperformed massively, of course, this applies to the whole team, but until a closer look into the xG against differential, it mainly suggests a poor goalkeeping performance that isn’t helped by effective defenders to block shots. Waasland-Beveren have a new manager, their players and fans will be hoping the new man can turn their performances around.
Zulte-Waregem

Finishing position 2019/20: 9th
Manager: Francky Dury
Average Formation: 4-4-2

Attacking play:
| Possession P90 (%) | Passes P90 | Average Pass Length (m) | Dribbles P90 | Crosses P90 | |
| Zulte-Waregem | 49.3 (9th) | 401.94 (6th) | 20.09 (11thHighest) | 27.73 (8th) | 15.12 (9th) |
| League Average | 49.9 | 388.64 | 20.63 | 27.04 | 15.03 |
| xG For | Goals Scored | xG For vs Goals Scored Differential | |
| Zulte-Waregem | 41.10 (9th) | 41 (9th) | 0.10 Underperformance |
| League Average | 40.36 | 39.8 | 0.56 Underperformance |
| Total Goals Scored | Long Shot Goals | Counter Attack Goals | Goals After Set Pieces | Direct Freekick and Penalty Goals | |
| Zulte-Waregem | 41 (9th) | 6 (15%) (8th) | 6 (15%) (4th) | 4 (10%) (Joint 11th) | 8 (20%) (2nd) |
| League Average | 40.9 | 5.5 | 4.7 | 6.6 | 4.8 |
Defensive Play:
| PPDA | |
| Zulte-Waregem | 9.74 (10th Lowest) |
| League Average | 9.71 |
| xG Against | Goals Conceded | xG Against vs Goal Conceded Differential | |
| Zulte-Waregem | 41.63 (9th) | 49 (11th) | -7.37 Underperformance |
| League Average | 40.36 | 40.9 | -0.54 Underperformance |
| Total Goals Conceded | Long Shot Goals | Counter Attack Goals | Goals After Set Pieces | Direct Freekick and Penalty Goals | |
| Zulte-Waregem | 49 (11th) | 6 (12%) (Joint 9th) | 11 (22%) (16th) | 4 (8%) (Joint 3rd) | 5 (10%) (Joint 11th) |
| League Average | 40.9 | 5.5 | 4.7 | 6.6 | 4.8 |
Overview:
Zulte-Waregem finished 9th and have average metrics across the board to suggest a mid0table finish was warranted. Zulte did underperform in terms of conceding goals which could be looked at. Their main strengths included scoring from freekicks and penalties, whilst they are officially the worst in the league for the number of counter-attack goals conceded. Another potential issue to resolve to boost the club from mid to upper positions.
Conclusion
Overall, there is much to look forward to in the 2020/21 Belgium First Division A season. If Club Brugge maintain their levels, can anyone catch them? Will the new league format increase competition for playoff places? Will the two newly promoted teams be able to stay up, or at the very least earn a relegation playoff match? This data analysis has provided a preview to the season and suggested the style along with important areas of strength and weakness of each club going into the season, all we can do now is watch it unfold!





Comments