Bundesliga is undoubtedly one of Europe’s top divisions and has seen its team’s develop and get better over the years. A league very well known for its fast-paced football with lots of transitions as also seen new coaches and new styles of play come into some teams creating more tactical diversity and, therefore, making games more interesting and different. This change in the Bundesliga panorama had Pep Guardiola and his Bayern Munich side as one of the big propellors with the Catalan coach winning lots of silverware in his time in German football. Time has passed and managers like Julian Nagelsmann, Lucien Favre and Marco Rose are a few of the current mangers that try and innovate and play unique brands of football which is something that really contributes to football and for those who watch it.
In this data analysis we will take a look at tactical trends in the Bundesliga in the current season, an analysis of key metrics will allow us to identify main traits of styles of play within the various teams as well as make a comparison between them all. Furthermore, a tactical analysis of spaces commonly exploited, will allow us to see what type of football teams are attempting to play in the Bundesliga nowadays.
Data analysis
In this first section of this analysis we are going to take a look at the data, statistics for each team were gathered from Wyscout and are referent to matches played this season. We are going to take a look at various metrics that allow us to identify key aspects of the team’s style of play related to the various phases of the game. Our data pool are the 18 teams competing in the Bundesliga in the 2020/2021 season.
Build-up play
To start off our analysis we are going to take a look at the team’s approach in the build-up phase, we are going to determine wether they adopt a more positional approach or if the preference falls on counterattacking, if they prefer to play a more possession based game or if they try and get to finishing areas with the least touches possible and what style of passing is mostly used by each team. We will also take a look at the most used formations by each team this season and try and demonstrate the connection between that and the teams’s approaches to their build play in general.
Most used formations
First in our build-up play sections is an overall look at the teams’s most used formations, for this, we will use passing maps taken from Wyscout. The passing maps show us the teams’ average formation based on the players’ average positions on the pitch, at the same time, it highlights the most frequent passing lanes between players giving us a general notion of how teams attempt to build their play.
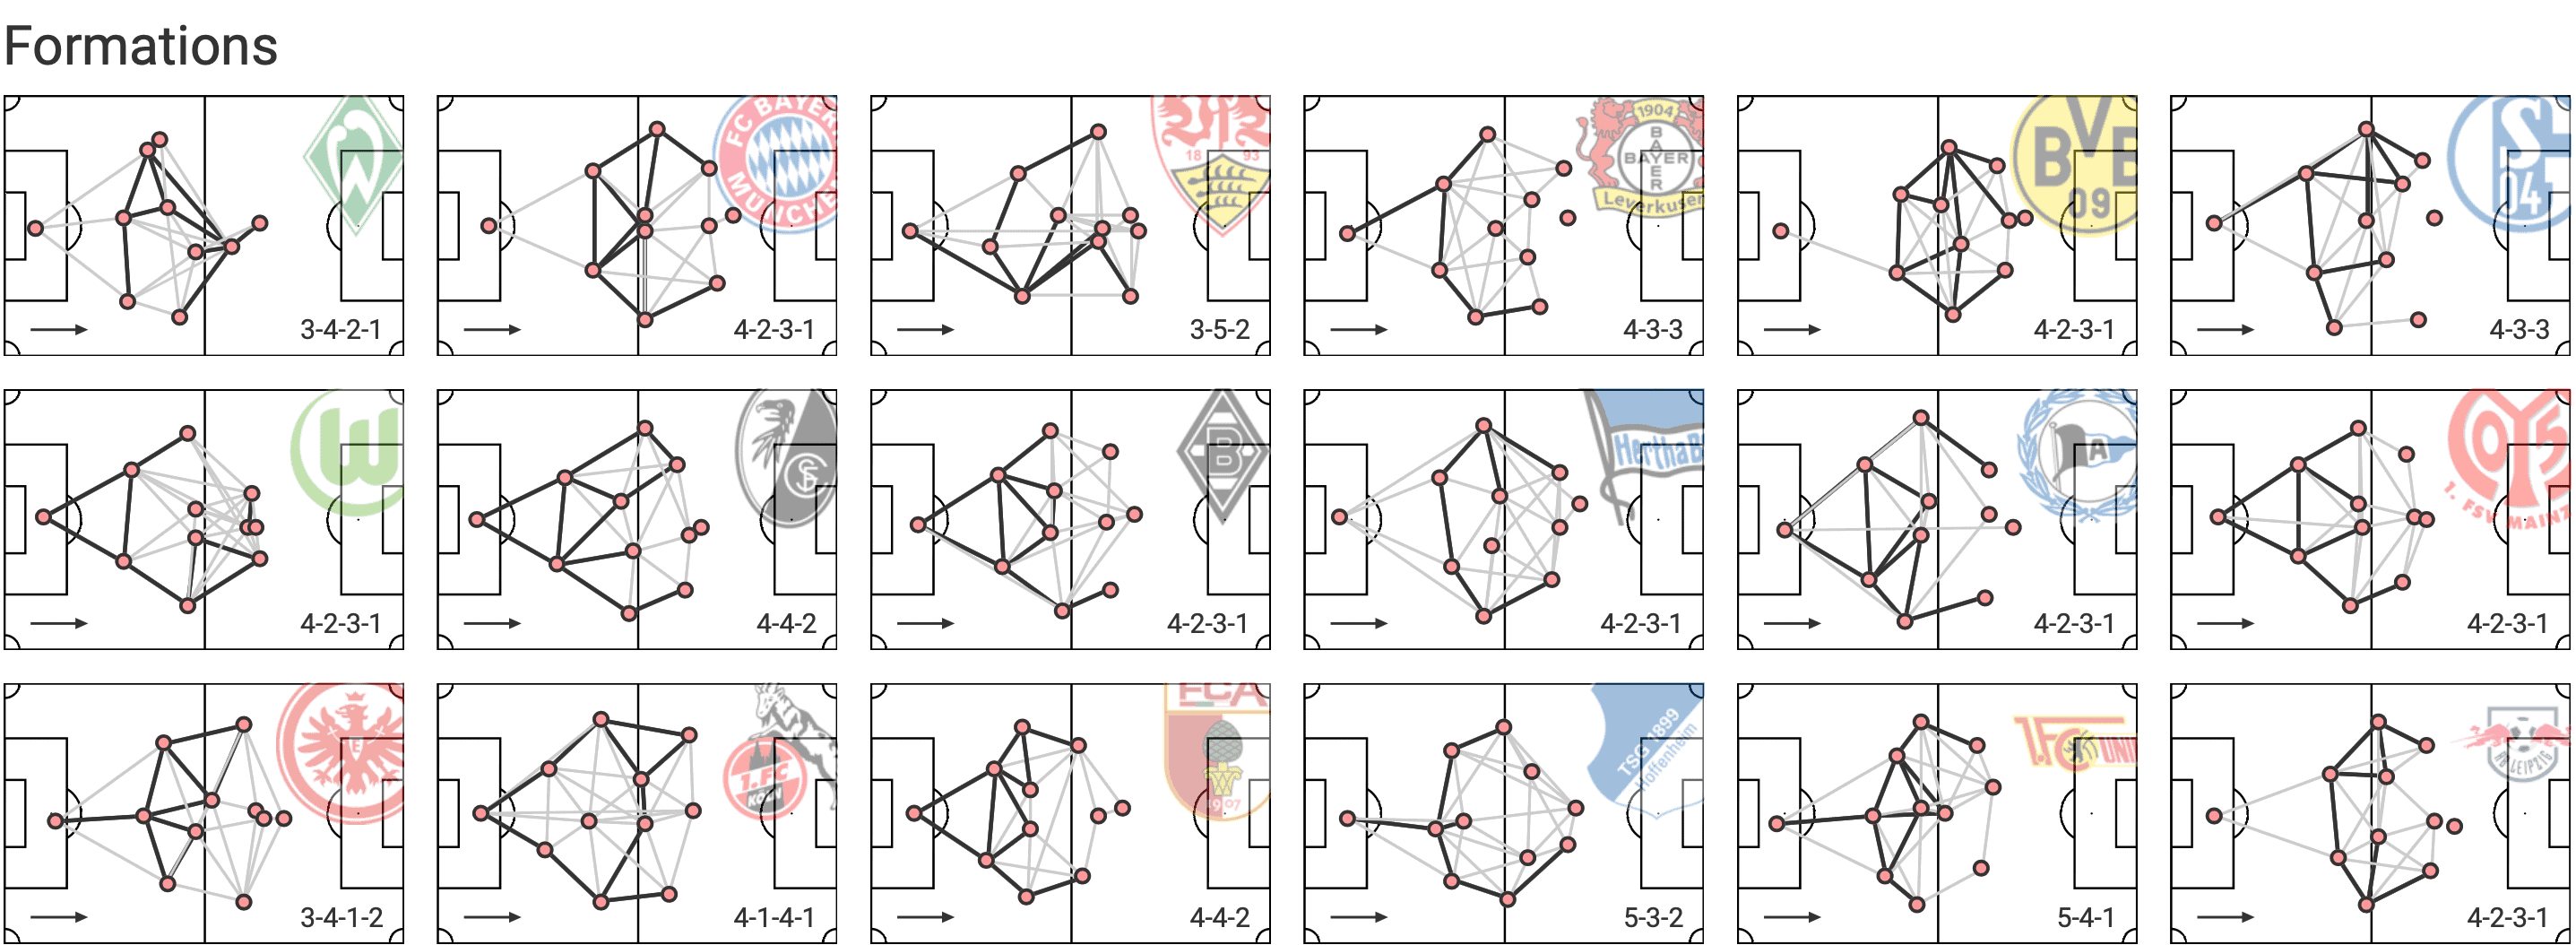
Looking at the maps we can start by identifying 4-2-3-1 as the most used formation so far with 8 teams preferring to set up in that manner, followed by 4-3-3 and 4-4-2 with 2 teams each. Two teams line up with five at the back (Union Berlin and Hoffenheim) but in different formations, 5-4-1 and 5-3-2. Lastly, we have one Koln who lines up in a 4-1-4-1 and two teams with a line of three in defence (Frankfurt and Werder Bremen) in both a 3-4-1-2 and 3-4-2-1 formations. The formations we see in the maps are based in the player’s average positions and they don’t reflect the changes that happen in teams tactics and formations in the different moments of the game but, in some cases, they reflect the most common moment for the teams quite well. For example, teams like Borussia Dortmund, Bayern Munich or Leipzig are teams that usually dominate games and possession of the ball, for that reason, they all play with a line so they can maintain the team compact to counter-press effectively. In the maps of those 3 teams we can clearly see the high lines when compared to others and the teams in general is more compact although so high up the pitch. Other teams that don’t spend that much time attacking and aren’t able to established themselves in the final third as well have much lower defensive lines and possibly teams who’s maps reflect more of the defensive moment of the game than the others. Al lot of this we’ll see, as a correspondence with the data and the metrics that we’ll be analysing will help to explain some of the characteristics of the maps that were mentioned.
Positional attack vs counter-attacking
We start off with a section that immediately brings to memory what was said earlier about the Bundesliga being known for its fast-paced and transition filled football. It is true that nowadays the game has evolved in the league and different styles of play are starting to flourish, we’ve seen that too, but how does all that translate into facts, better speaking, to data? To answer that question we’ll start taking a look at the scatter plot below, it is set to show the average number of positional attacks and counterattacks made by teams per 90 minutes.
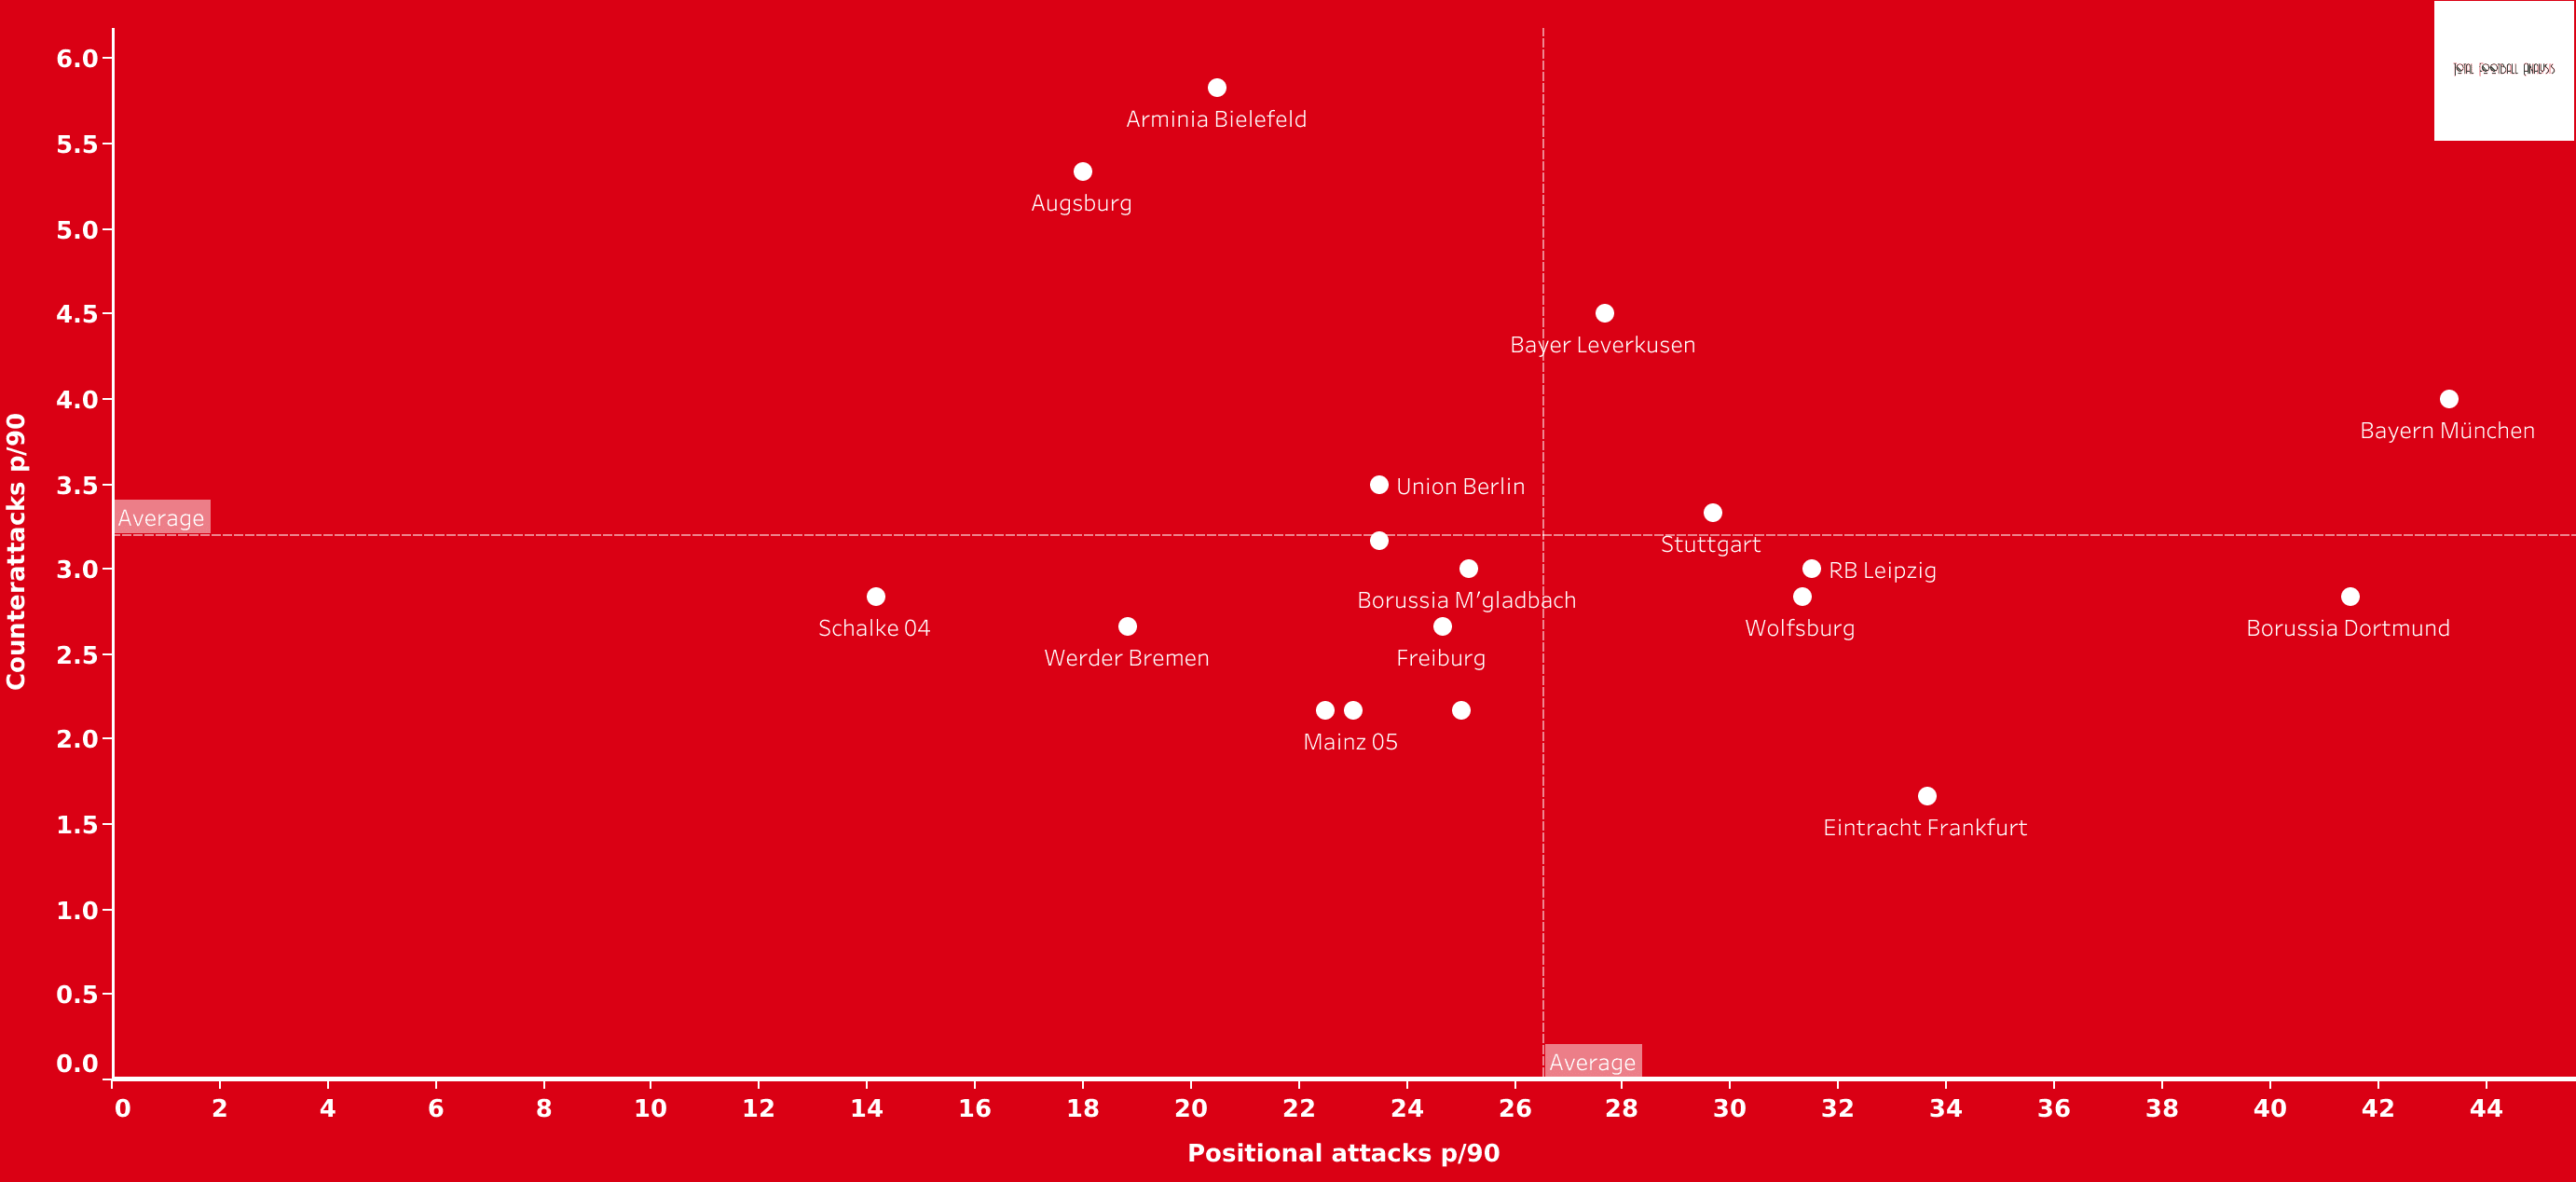
An analysis of this first graphic allows us to identify a certain diversity, in other words, even though there are teams that clearly have a positional or counter-attacking oriented style of play, others show a more balanced profile. The reasons for this can be of various natures, it can be because the team is trying to attack using both ways, they are trying to attack in one way and are not being successful and it can also be influenced by the quality of their players and opponents. Many other reasons could be added to those said before, the point is, we can identify teams with clear focus on one type of attacking play , and teams with more mixed profiles.
Clearly on the positional play side are Bayern Munich and Borussia Dortmund with the two highest numbers of positional attacks per 90 and the only two clubs above the 40 mark. Also favouring positional play and with numbers that reflect so are Frankfurt, Wolfsburg, RB Leipzig, Stuttgart and Bayer Leverkusen. These are all teams that are above average in terms of positional attacks per 90 and, since there are no teams that have more counterattacks per 90 than positional attacks, we can say that the ones that rank above average on positional attacks are the ones who have real intentions to attack that way, or at least who are being more successful in doing so. With a positional attacks number close to the league average are teams like Mochengladbach, Freiburg and Hoffenheim who all average around 25 positional attacks per 90. Hertha BSC, Koln, Mainz and Bielefeld are the last teams of the league that average above 20 positional attacks per 90, judging only by the numbers, we would say these are teams that trying to attack through positional play but might not be having the biggest number of attacks per 90. In the particular case of Arminia Bielefeld we have to mention the number of counterattacks per 90, the newly promoted side averages 5.83 counterattacks per 90 ranking first in this respect between all the teams. Also worth mentioning in terms of counterattacking play are Bayern Munich, Bayer Leverkusen and Augsburg. Despite the predominance in positional play for both Bayern Munich and Bayer Leverkusen the two teams like to exploit counterattacking situations as well and data suggests they are being successful in doing with numbers around 4 for both teams, in the case of Augsburg, we have a team with a lot less attacks of both types but with a high number of counterattacks proving they resort to them a lot in order to try and score and maybe intentionality concede possession to the opposition.
Possession vs direct
Next we’ll take a look at the average possession of the ball for each team as well as the average number of passes per possession, this will allow us to have a clearer idea of which teams aim to play possession based football with a positional organisation and which are either unable to do so or just prefer to concede possession and wait for errors or counterattacking opportunities. For this a scatter plot was created with both referred metrics plotted in the axes.
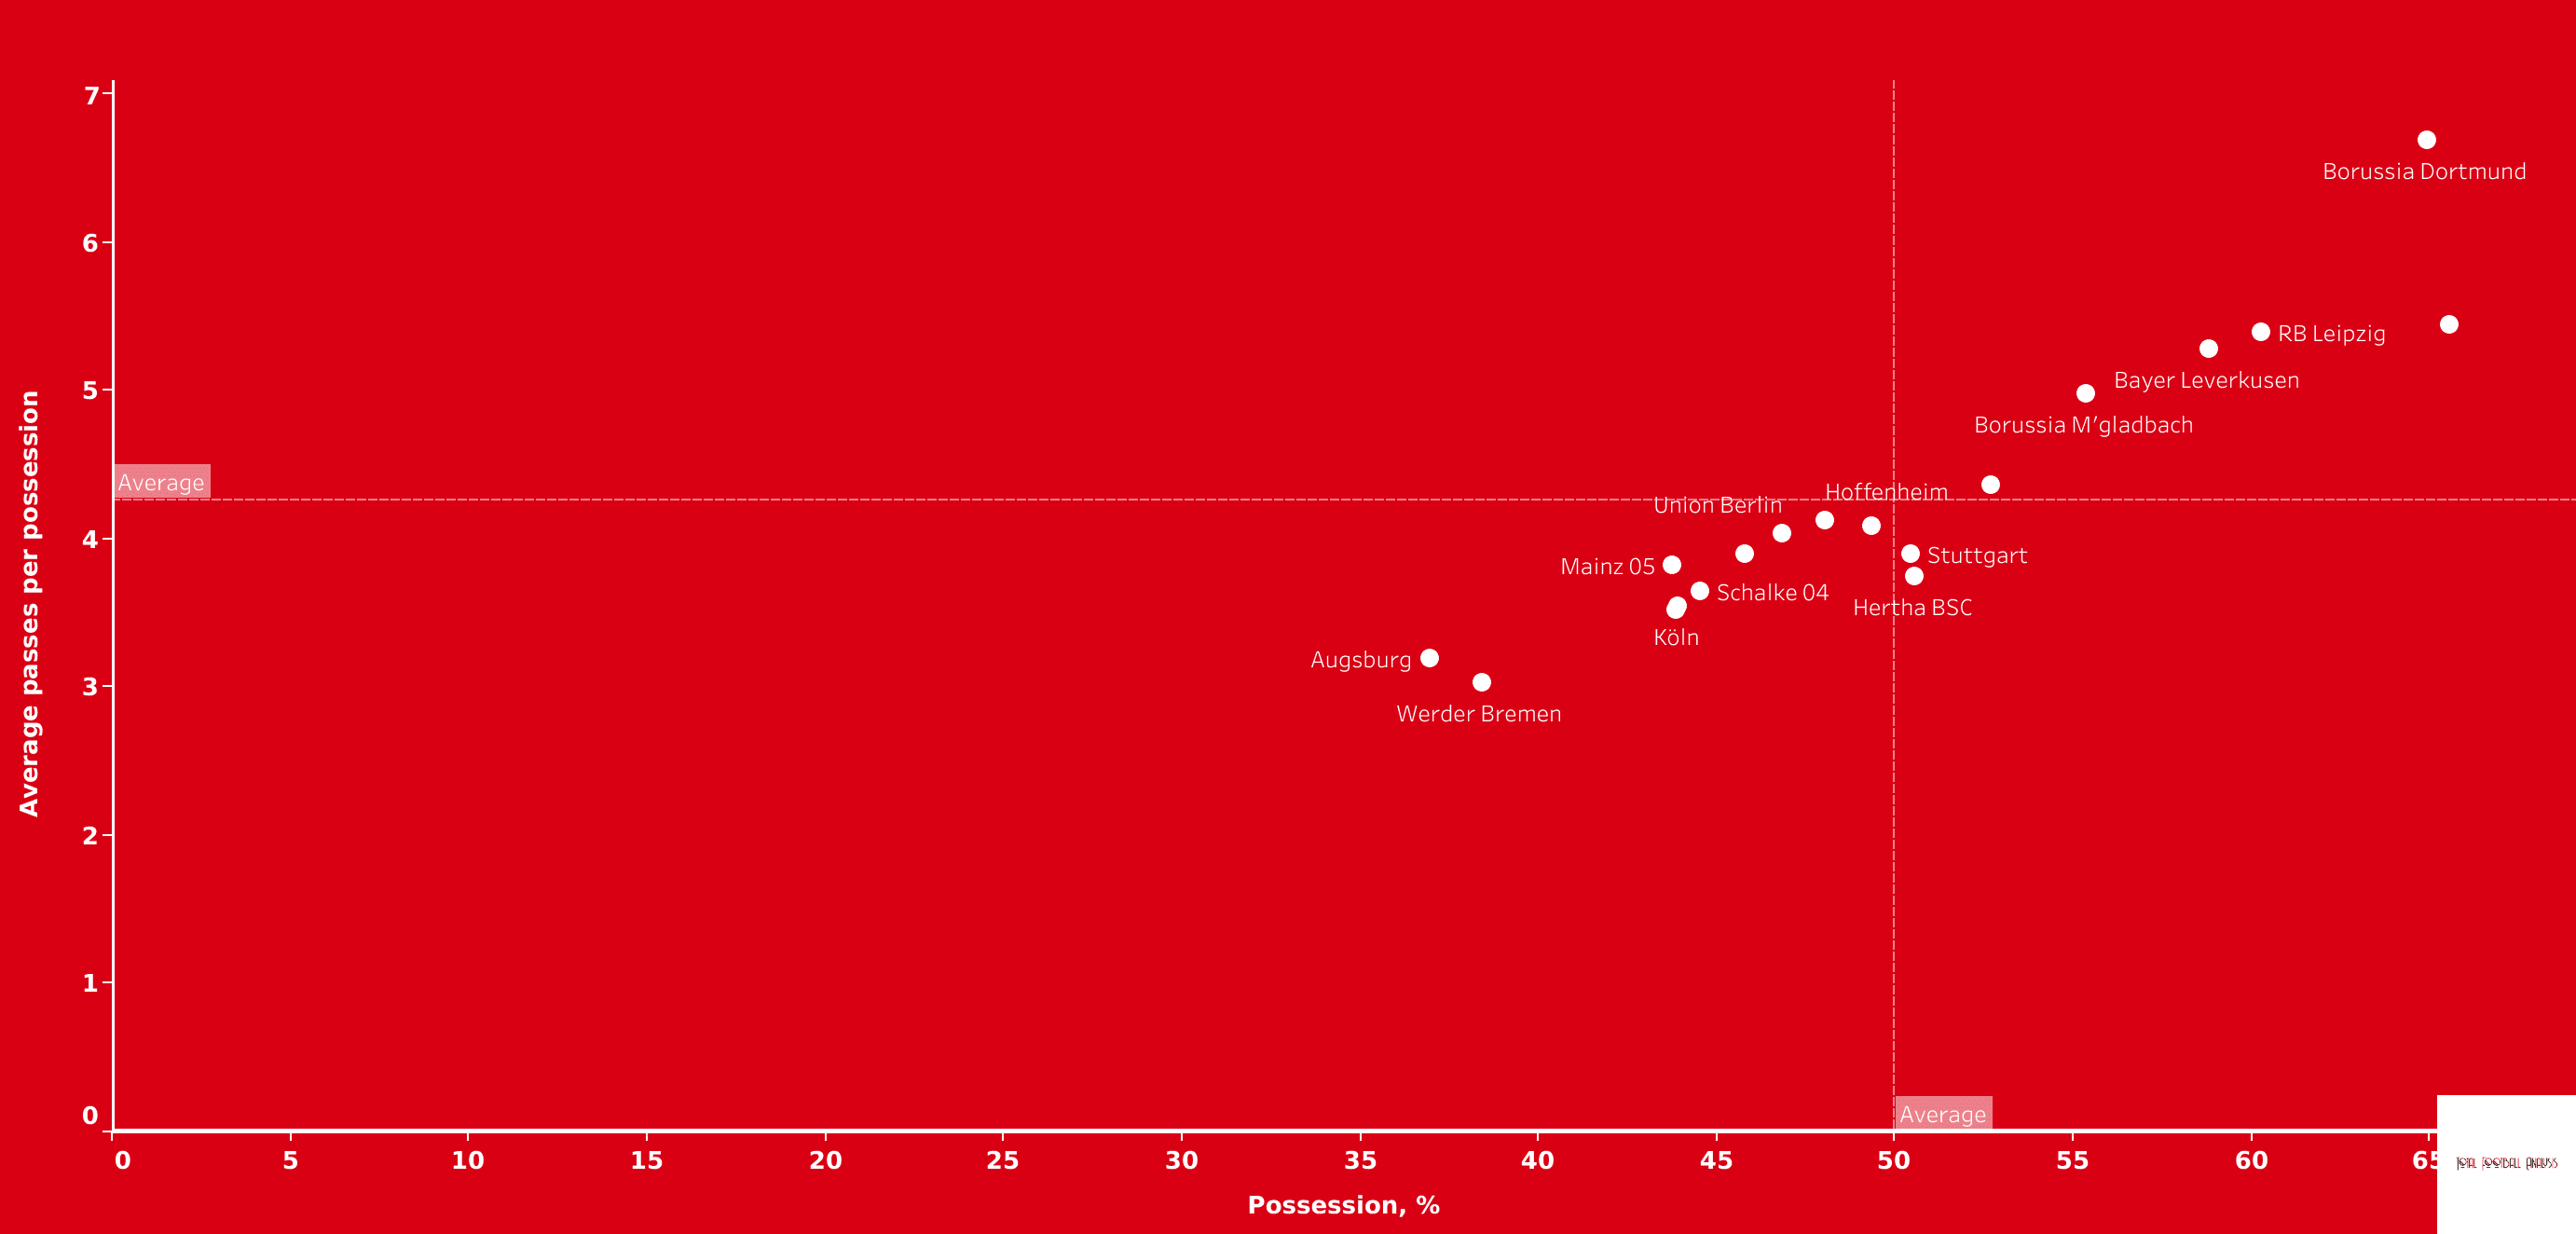
Looking at this scatter plot we can clearly see a correspondence between the teams that averaged the most positional attacks and the ones that want and are able to retain possession better during games. The same 7 teams that were above average in terms of positional attacks are the ones that are also above average in terms of possession (%) with only one addition in Hertha Berlin. Borussia Dortmund (64.91%) Bayern Munich (65.57%) and Leipzig (60.27%) are the teams with the better average possession (%), Bayer Leverkusen appears right behind the trio with 58.79% and the lot of teams above average is completed by Borussia Monchengladbach (55.35%), Frankfurt (52.70%) , Stuttgart (50.46%) and Hertha Berlin (50.54%). Some of the mentioned teams average high percentages of possession and those who do also average a high number of passes per possession showing a clear intent of keeping the ball and attack through positional play, however, there are teams that despite ranking above average for possession percentage score below the average for passes per possession like Stuttgart and Hertha BSC. This can happen due to strategy and the team wanting to move the ball up the pitch with few passes, but also due to lack of success in putting their style of play into practice. All the other teams display not only lower possession (%) values but also a lot less passes per possession falling below the average of 4.3. If we put these values into perspective, averaging less than 4 passes per possession while also having a low percentage of possession of the ball is either a strategy or lack of capability by the team when attacking, either way, this teams tend to try and get the ball up the pitch fast and without trying to string many passes together.
Short vs long
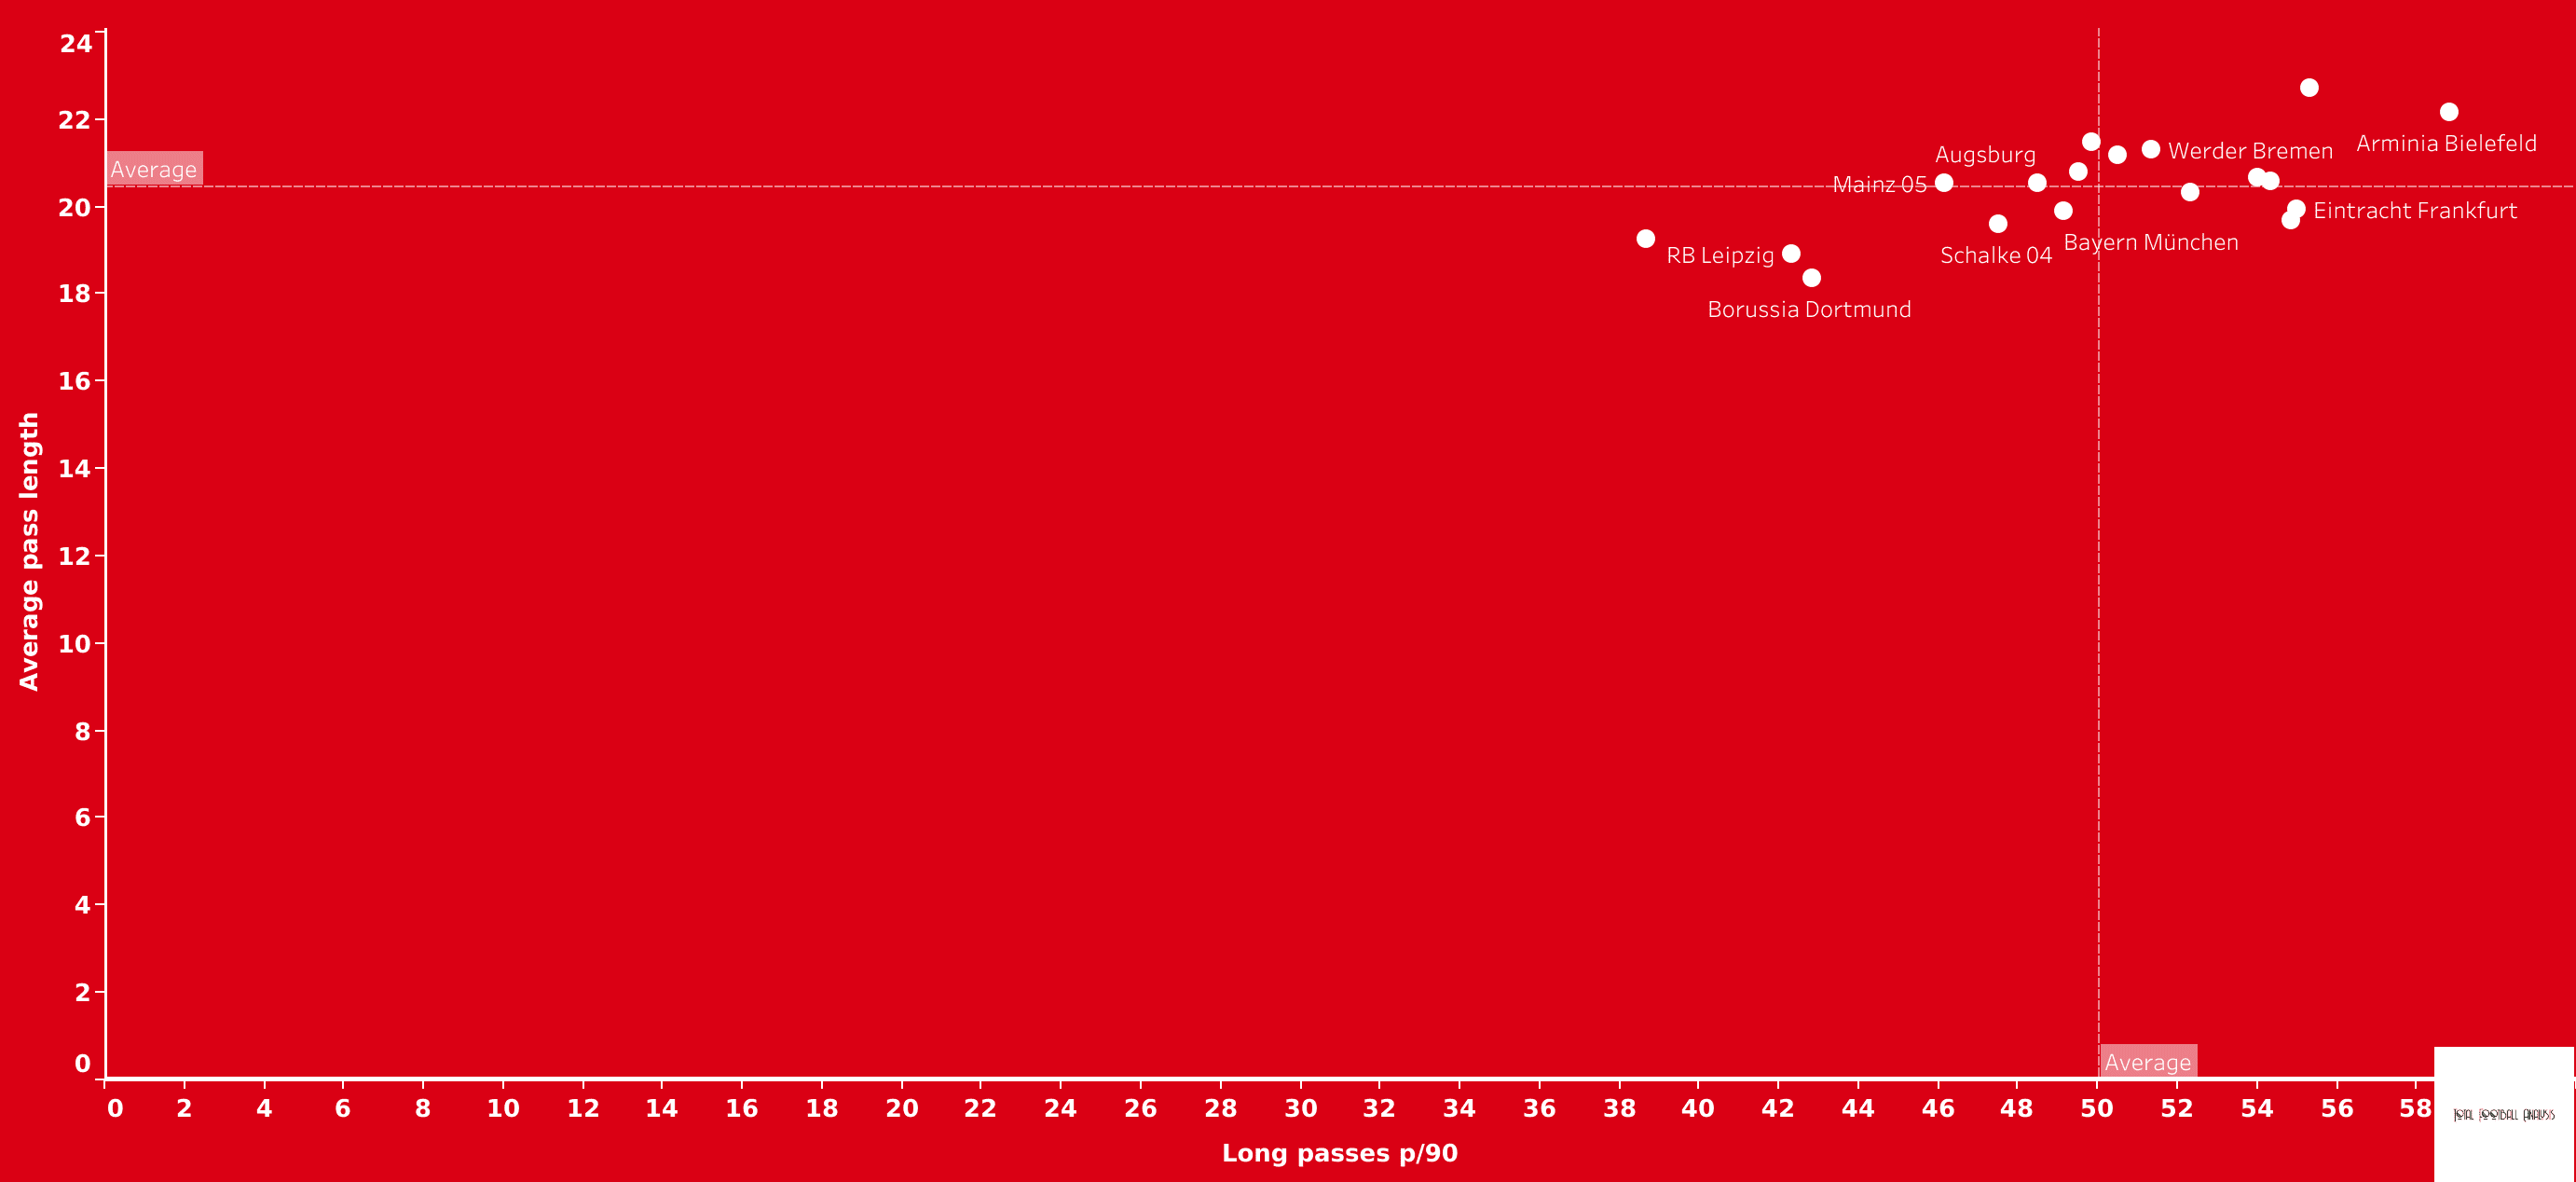
Next we are going to take a look at the teams’s approach in terms of pass length and directness of play, for that, we’ll analyse a scatter plot with the metrics average pass length and long passes per 90 on both axes.
Chance creation
We’ve seen how teams try and build their play, there are teams who adopt a more positional approach to the game and try to play possession football, teams who prefer to be more direct and exploit space on the counter attack and teams who are a mix of both with the most important point to be taken being the fact that each teams has his unique style and that some are better imposing it to their opponents than others. Now we are going to see how teams try and create chances, once their past their initial build-up process, how do they behave?
First of all we are going to analyse the teams’s numbers in terms of passes per shot, this will start to hint wether a team tries to go for goal as fast as possible or instead pass the ball around and tries to break down the defence patiently. Let’s look at the bar chart below.

Again, Bayern Munich, Borussia Dortmund, RB Leipzig and Bayer Leverkusen are teams that like to play possession based football and to have the control of the game via the control off the ball and they are also the teams with the most passes per shot. Dortmund’s case is impressive with the team averaging 129.2 passes per shot, Leipzig are the second best with 84.6 and Bayer Leverkusen is this best with 73 passes per shot. Bayern Munich and union Berlin are the two other teams above average in this metric and of in Bayern’s case we said it was expected than Union Berlin’s was certainly not. This can be influenced by a low number of shots, however, it is still an indicator of some passage of play happening and some intent to keep the ball for a while. As for the teams below average in this metric, they seem to adopt a different aproach and look to shoot the ball having played less passes beforehand, this indicates that they get to finishing areas with less passes or at least try to do so. Again, we should never forget that these numbers are highly influenced by the teams’s performances, therefore, a team like Schalke 04 who has scored very low in most metrics analysed so far is less accurate to analyse through data because they are most likely not being able to put their ideas to practice.
Next we are going to take a look at teams’s number of touches in the penalty area as well as their average shot distance, this will allow us to see hoe close do teams usually finish their plays, in other words, if they try and work the ball deep into the box before trying to shoot or if they try to finish the plus from further away.
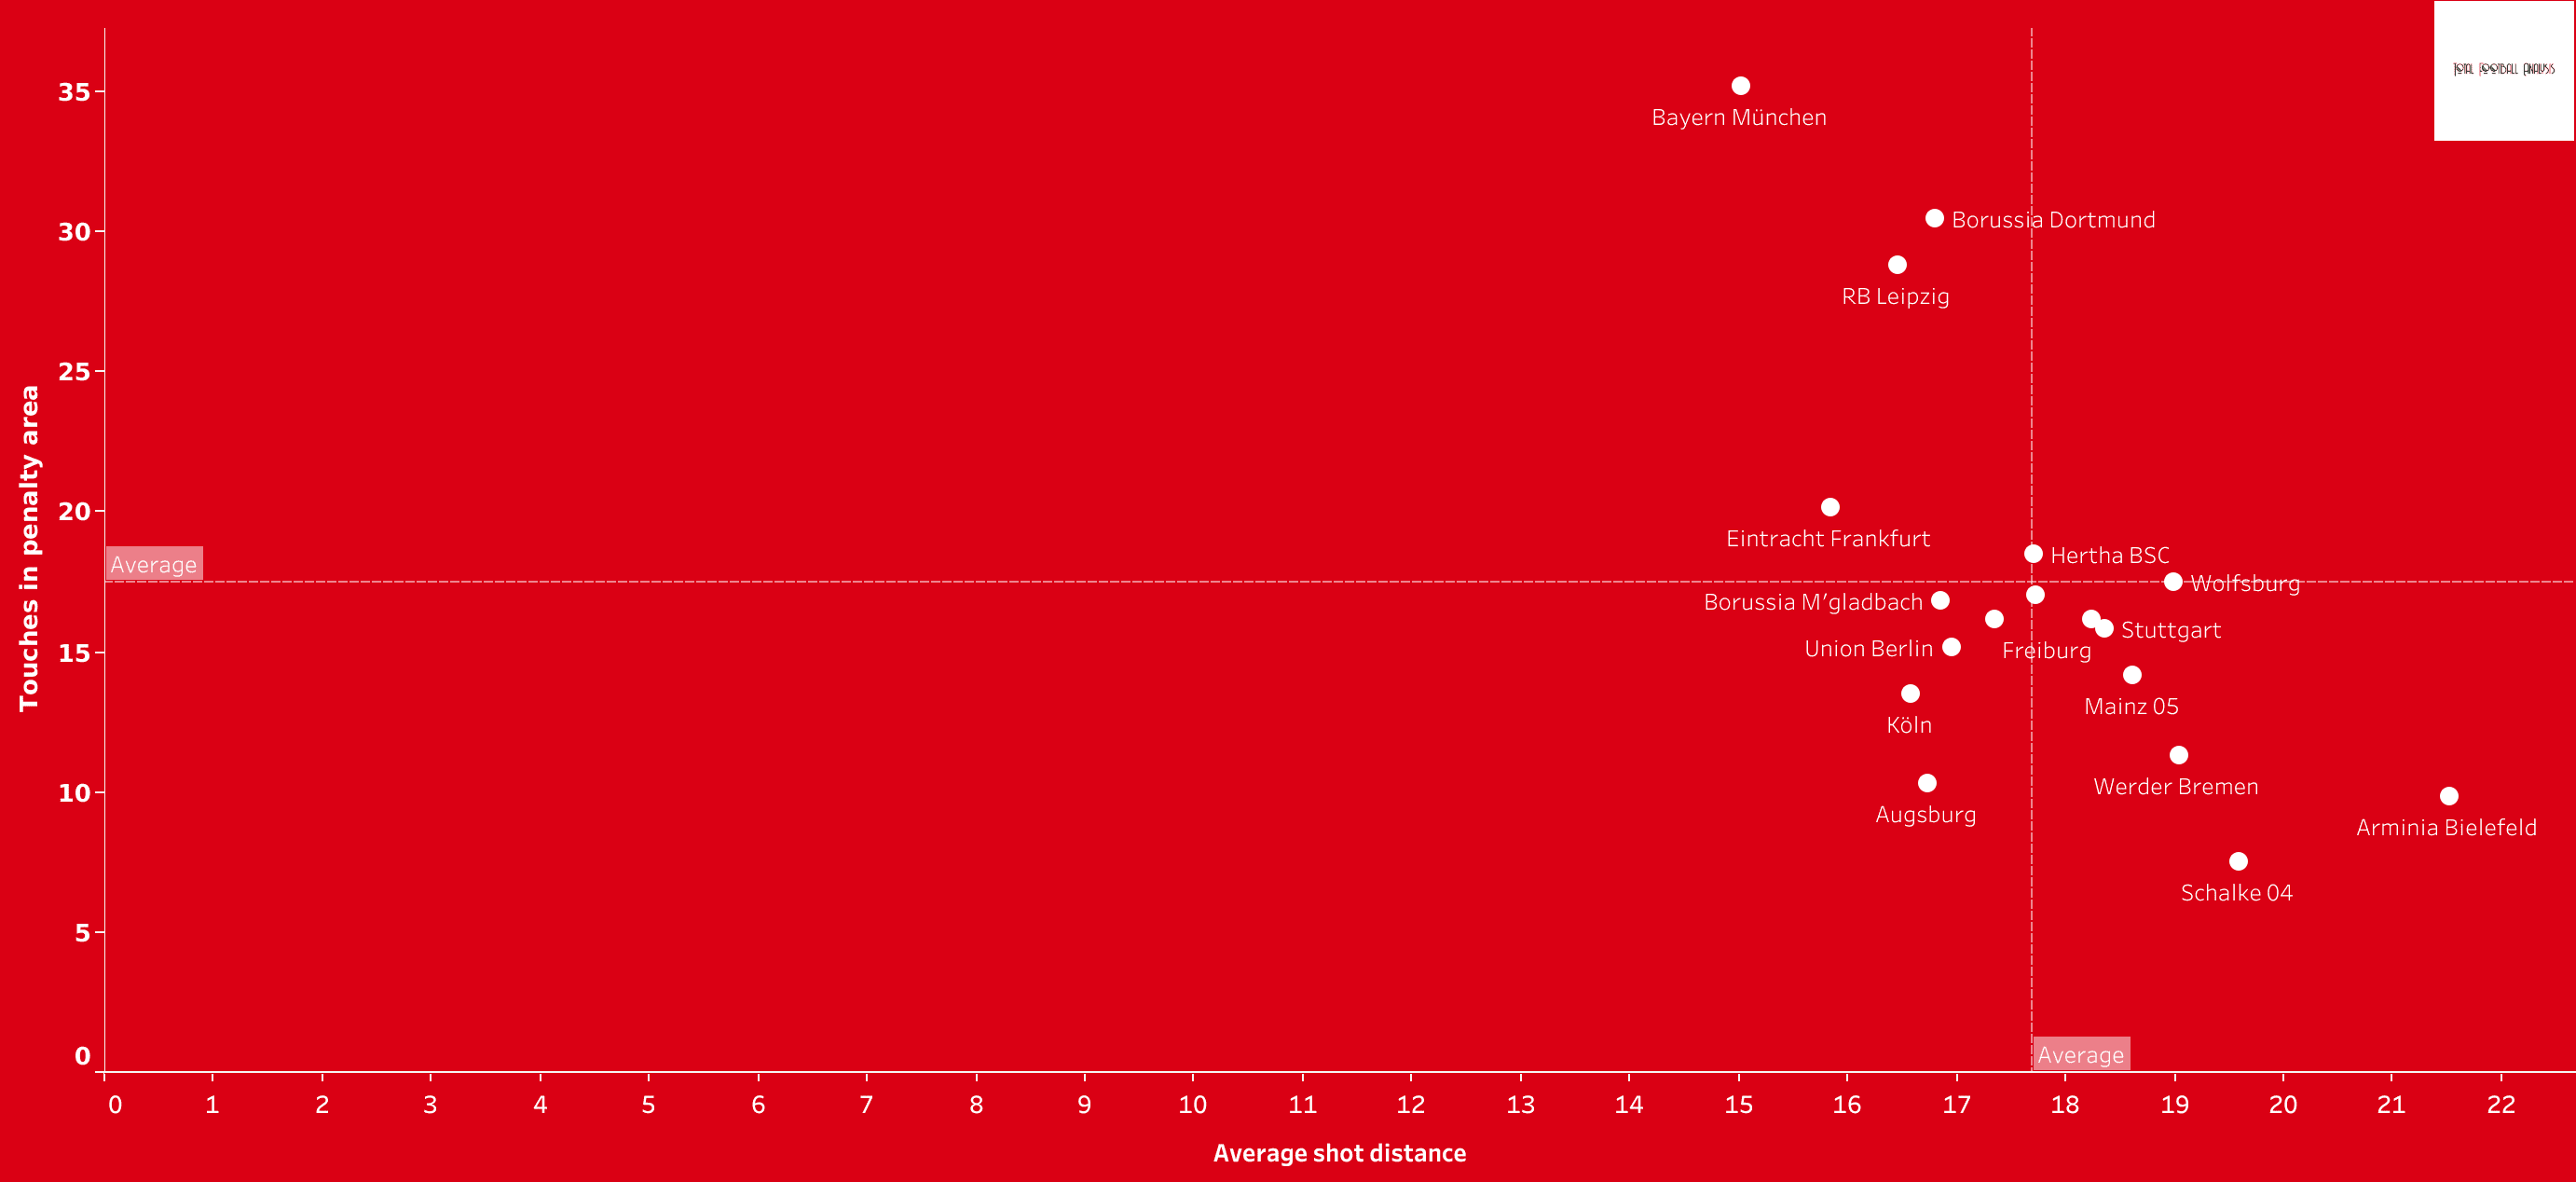
Teams with more passes per shot have a tendency to get more touches in the box and a lower average shot distance and that is easily understood knowing that they attempt to play possession based football and build their play through passing combinations. This results in getting the ball into the box in a more controlled way and, many times, with a lot more frequently if a team is being successful in keeping the ball. Proof of that is that we see the same teams that have more passes per shot (Bayern Munich, Borussia Dortmund, RB Leipzig) haven the most touches in the penalty area and with Frankfurt, Hertha Berlin and Wolfsburg also ranking above average on this metric. It is also curious to see that teams associated before with positional play are either below average or near it when it comes to average shot distance, it is the case of Borussia Mochengladbach, Vfb Stuttgart or Bayer Leverkusen who pretty much ranks in the average for both metrics. Teams with less offensive output and that are less able to get to the penalty area obviously have a higher average shot distance and many of them are teams that recur to counterattacking football as a main weapon a lot more such as Bielefeld.
Now that we’ve seen how teams start to build-up their play and hoe do they behave in terms of getting the ball up the pitch into finishing positions we will take a look at the teams’s penalty area entries and analyse how they attempt to exploit those spaces. The bar chart below shows us the the teams total penalty area entries per 90 divided by three different categories: passes, runs or carries and crosses.

An analysis of the bar chart shows us the teams with the most penalty area entries are the same ones that had the most touches in the box which is natural, what it is curious to see is the balance between the three different types of entries in each team. The first things to mention is the fact that Koln, Union Berlin and Werder Bremen are the only three teams to have more penalty area entries through crosses (8.33, 7.17 and 10.33) than through passes (7.17, 5 and 9.67) and that is a big indicator of the teams’s style of play as well as of the spaces they are able to exploit best. All the other teams have more penalty area entries through passes than through crosses, however, the balance between the two varies according to the teams’s style of play. Bayer Munich, Borussia Dortmund and Leipzig are the teams with the highest penalty area entries in total as well as in terms of entries through passes. Bayern Munich pairs its 19.5 penalty area entries through passes with 13.17 through crosses showing the variety of ways in which the reigning champions are able to get the ball into finishing areas. Dortmund and Leipzig have a more unbalanced profile with the passes (18.17 and 17.50) clearly surpassing crosses (9 and 9.33). Frankfurt, Hoffenheim, Stuttgart and Hoffenheim are teams with high numbers and a more balanced profile between crosses and passes which is clearly the tendency in most teams.
Pressing and recoveries
Lastly, we are going to take look at the teams’s pressing intensity as well as the areas of the pitch were teams loose and recover the ball most often. This will allow us to understand the teams’s approach to pressing and transitions, wether they try and counterpleas or regroup into shape and how much time teams give their opponents on the ball.
To start off we are going to take a look at a scatter plot with the metrics Ppda (passes per defensive action) and recoveries per 90. Ppda tells us how many passes a team allows his opponent until a defensive action is made in the final 60% of the pitch.
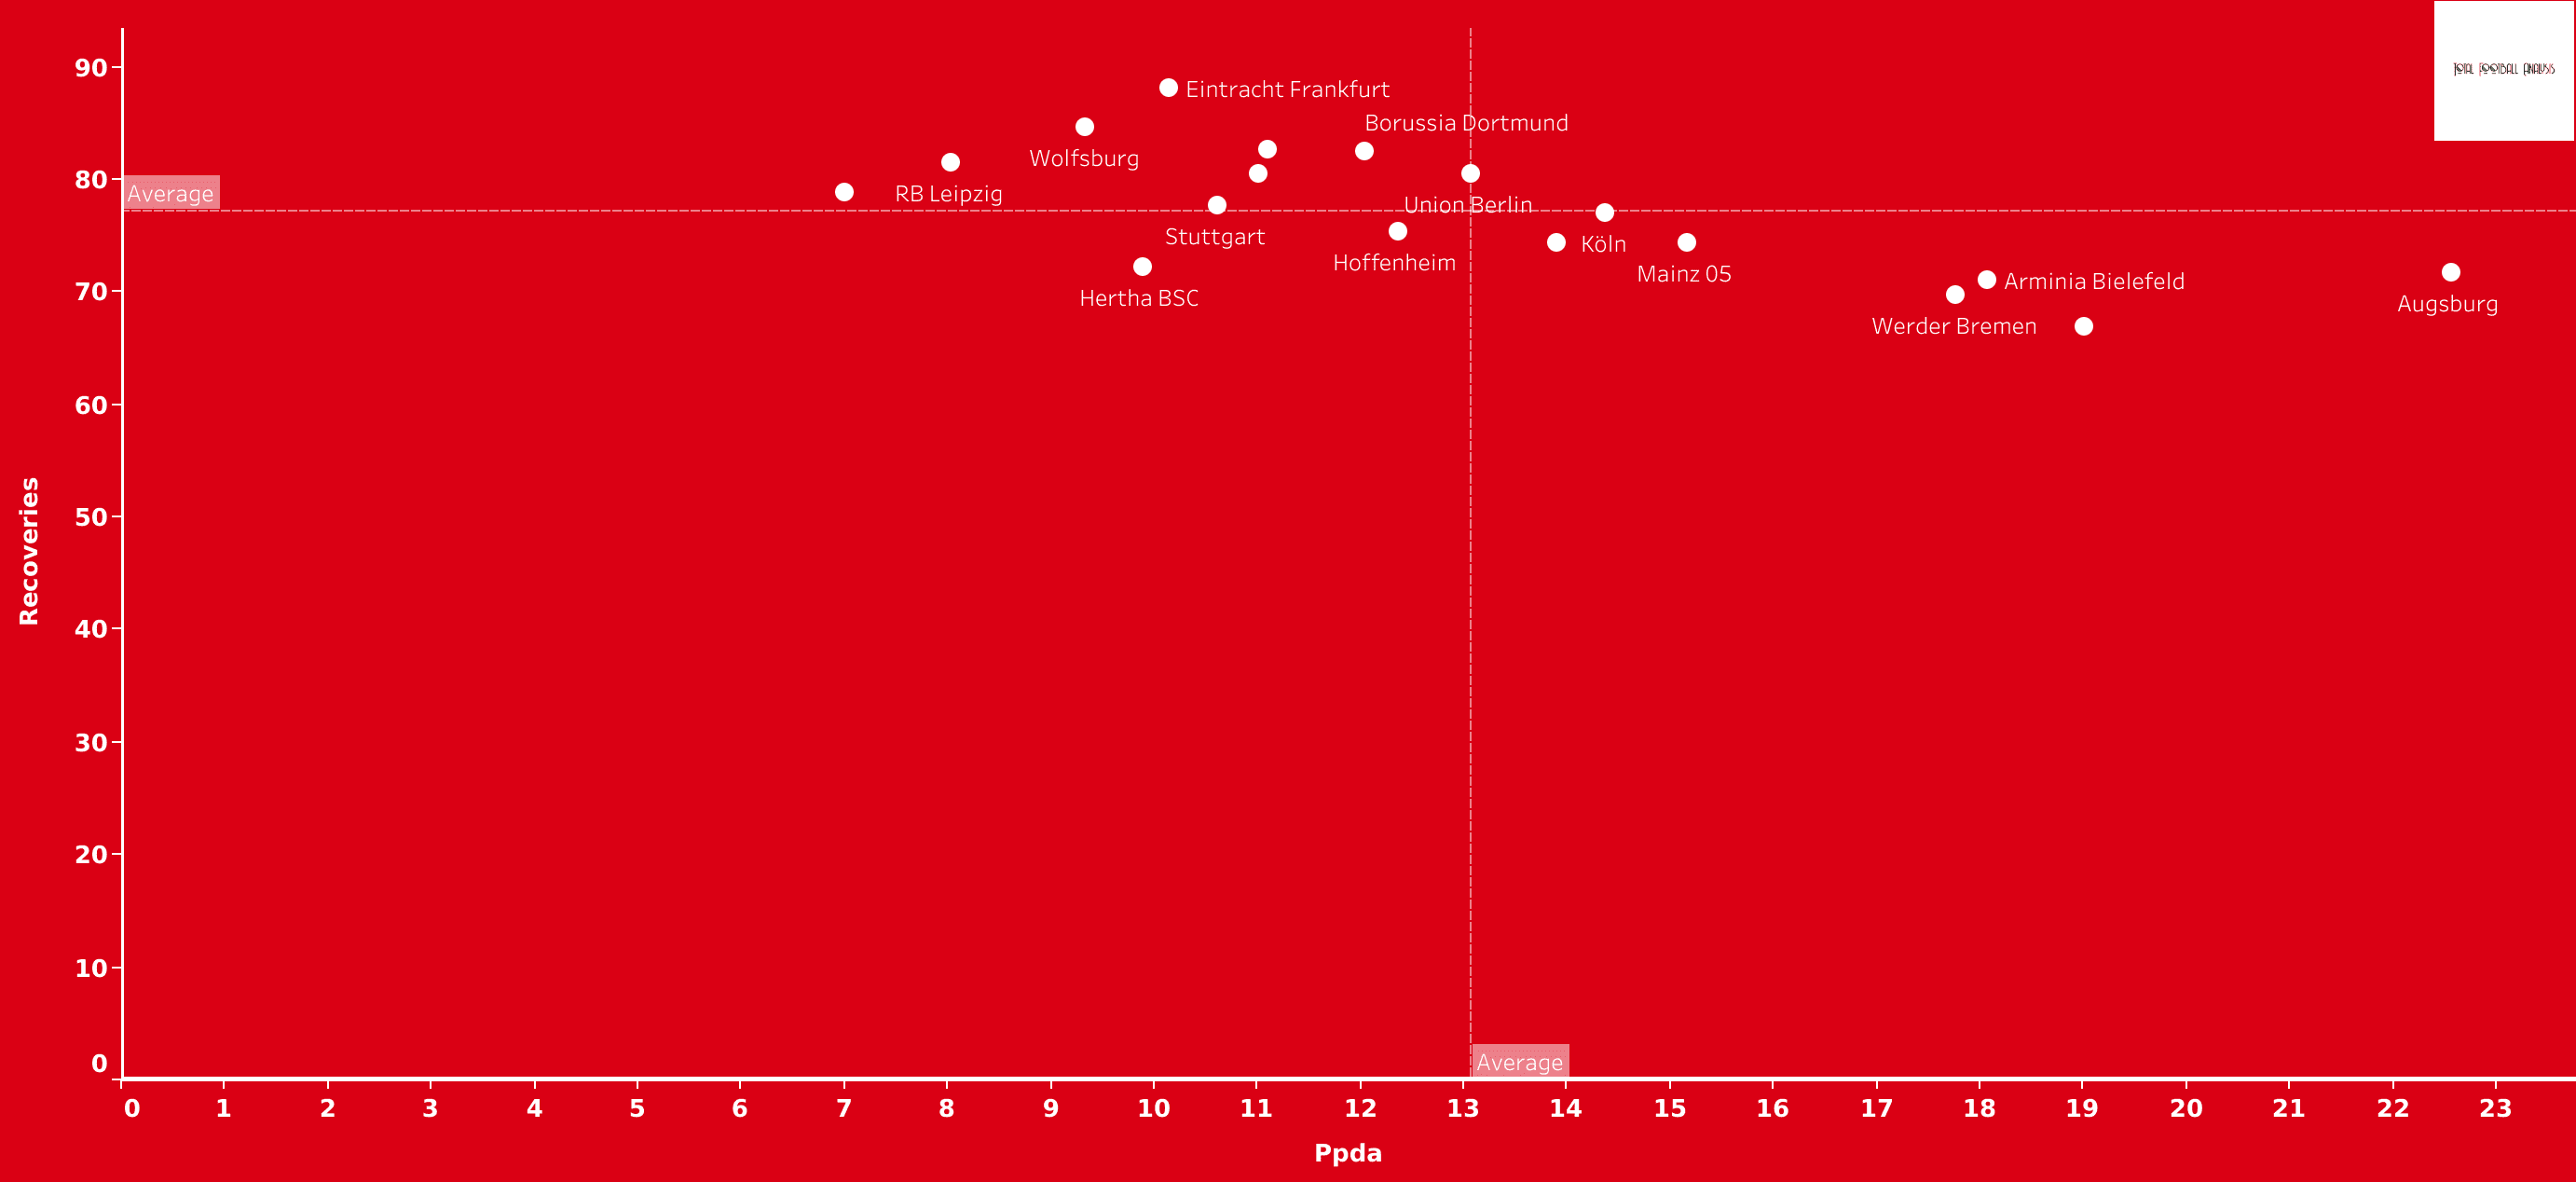
Looking at this scatter plot we can pick up on some hints given to us by the pass maps seen in the first section. In those maps we pointed out that some teams had a more compact shape than others and that some averaged positions higher up the pitch when compared to other teams. In this graphic we can establish a correspondence between those aspects and the teams’s Ppda values. Teams like Bayern Munich, RB Leipzig, Bayer Leverkusen, Wolfsburg, Frankfurt and others that area below average in terms of Ppda are teams’s who’s pass maps show us a compact shape with good distances between the lines and that allows them to be able to press their opponents better. Bayern Munich’s case is particularly impressive with a Ppda of only 7 with Leipzig following with 8.03 and Wolfsburg in third with 9.34. Teams that area above average in terms of Ppda are usually teams that concede more space for opponents to play and are also teams’s who’s pass maps tend to display a less compact team with bigger distances between the various lines. Particularly noticeable is the distance between the lines in Schalke’s and Bielefeld’s pass map and they are also teams that have high Ppda values of 19.01 and 18.08 respectively. Interesting but not surprising to see is the fact that teams that allow more passes to opponents before a defensive actions, hence with high Ppda values, have less recoveries than teams with low Ppda values and that is something easy to see in the scatter plot above. Allowing less time on the ball to the other team and being more urgent when pressing seems to lead to more recoveries of the ball if done properly.
To better understand Bundesliga teams’ approach to pressing we are going to take a look at the the areas of the pitch where teams lose and recover the ball back. This will allow us to see if teams attempt to counter press or if they regroup into shape. First we are going to take a look at losses of possession, the bar chart below will show us the total losses of possession categorised by the area of the pitch were they happened.
Losses

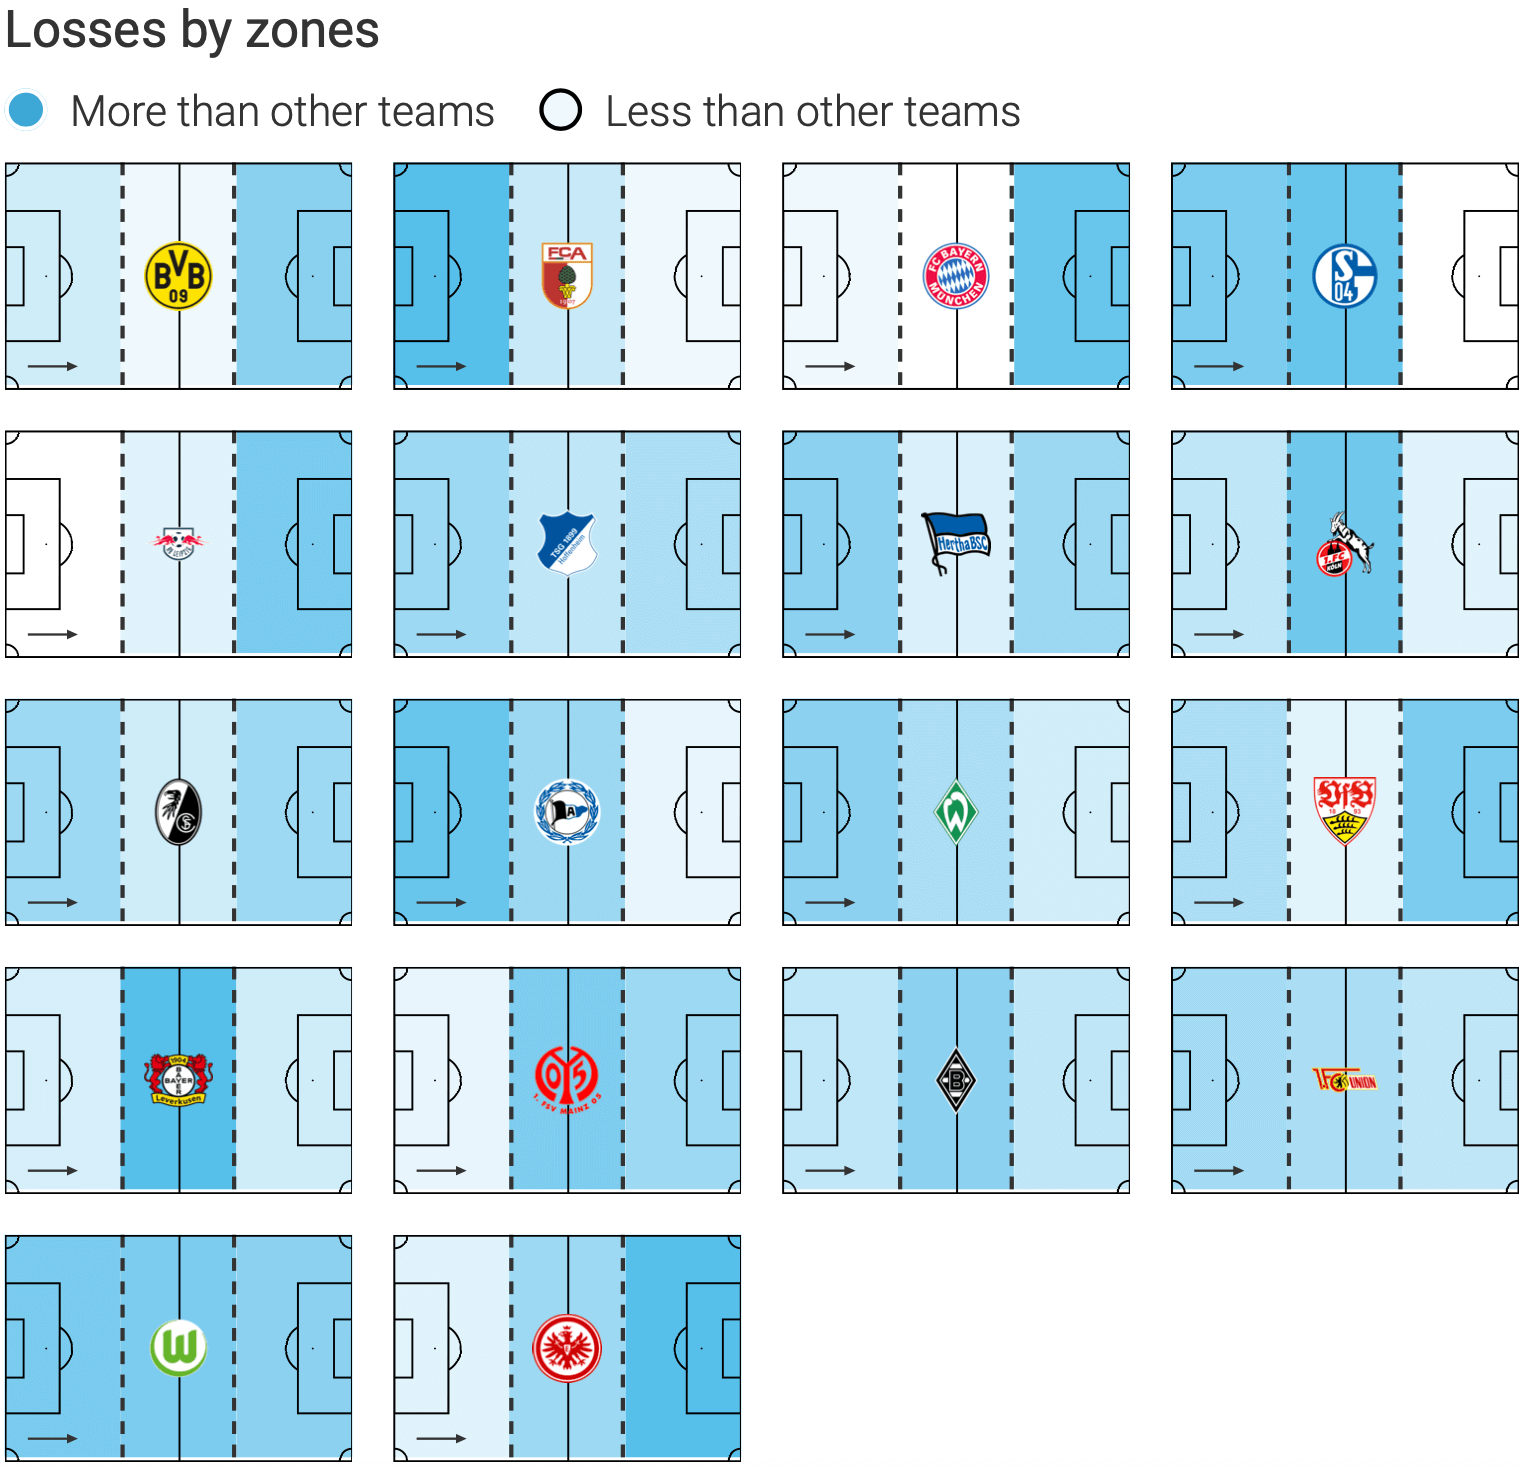
It is no surprise to see that in all teams the area of the pitch were less losses of possession happen is in their own third, if it weren’t this way, it would be a very bad sign for teams since this is the area of the pitch were it is most dangerous to lose possession. Most teams have more losses of possession in the final third than in the middle of the park, however, the balance between the two varies from team to team. Teams we saw had a lot more offensive power and that play higher up the pitch like Bayern Munich, Dortmund, Leipzig, Frankfurt or Borussia Mochengladbach have a bigger difference between the losses in the final third and in the mid-third and that is easy to understand because they spend a lot more time in those areas. Other teams present a rather balanced profile between those two areas which is consistent with the fact that they are not so dominant and not so installed in the final third throughout the game. Finally we Schalke who are the only team that have more losses in the mid third than in the final third, bak in the first section we also saw that Schalke where one of the teams with less attacks in general both positional and counterattacks.
To have a more graphical view of this distribution of losses in the pitch for each team here is a graphic taken from Wyscout.
Recoveries
Having seen the areas of the pitch were teams lose possession the most, we are now going to take a look at the areas of the pitch were teams recover possession the most. This will allow us to have a better notion of how teams react to losing possession and were in the pitch they attempt to get it back, in order to do so, we are going to take a look at a bar chart similar to to the one shown for losses of possession.

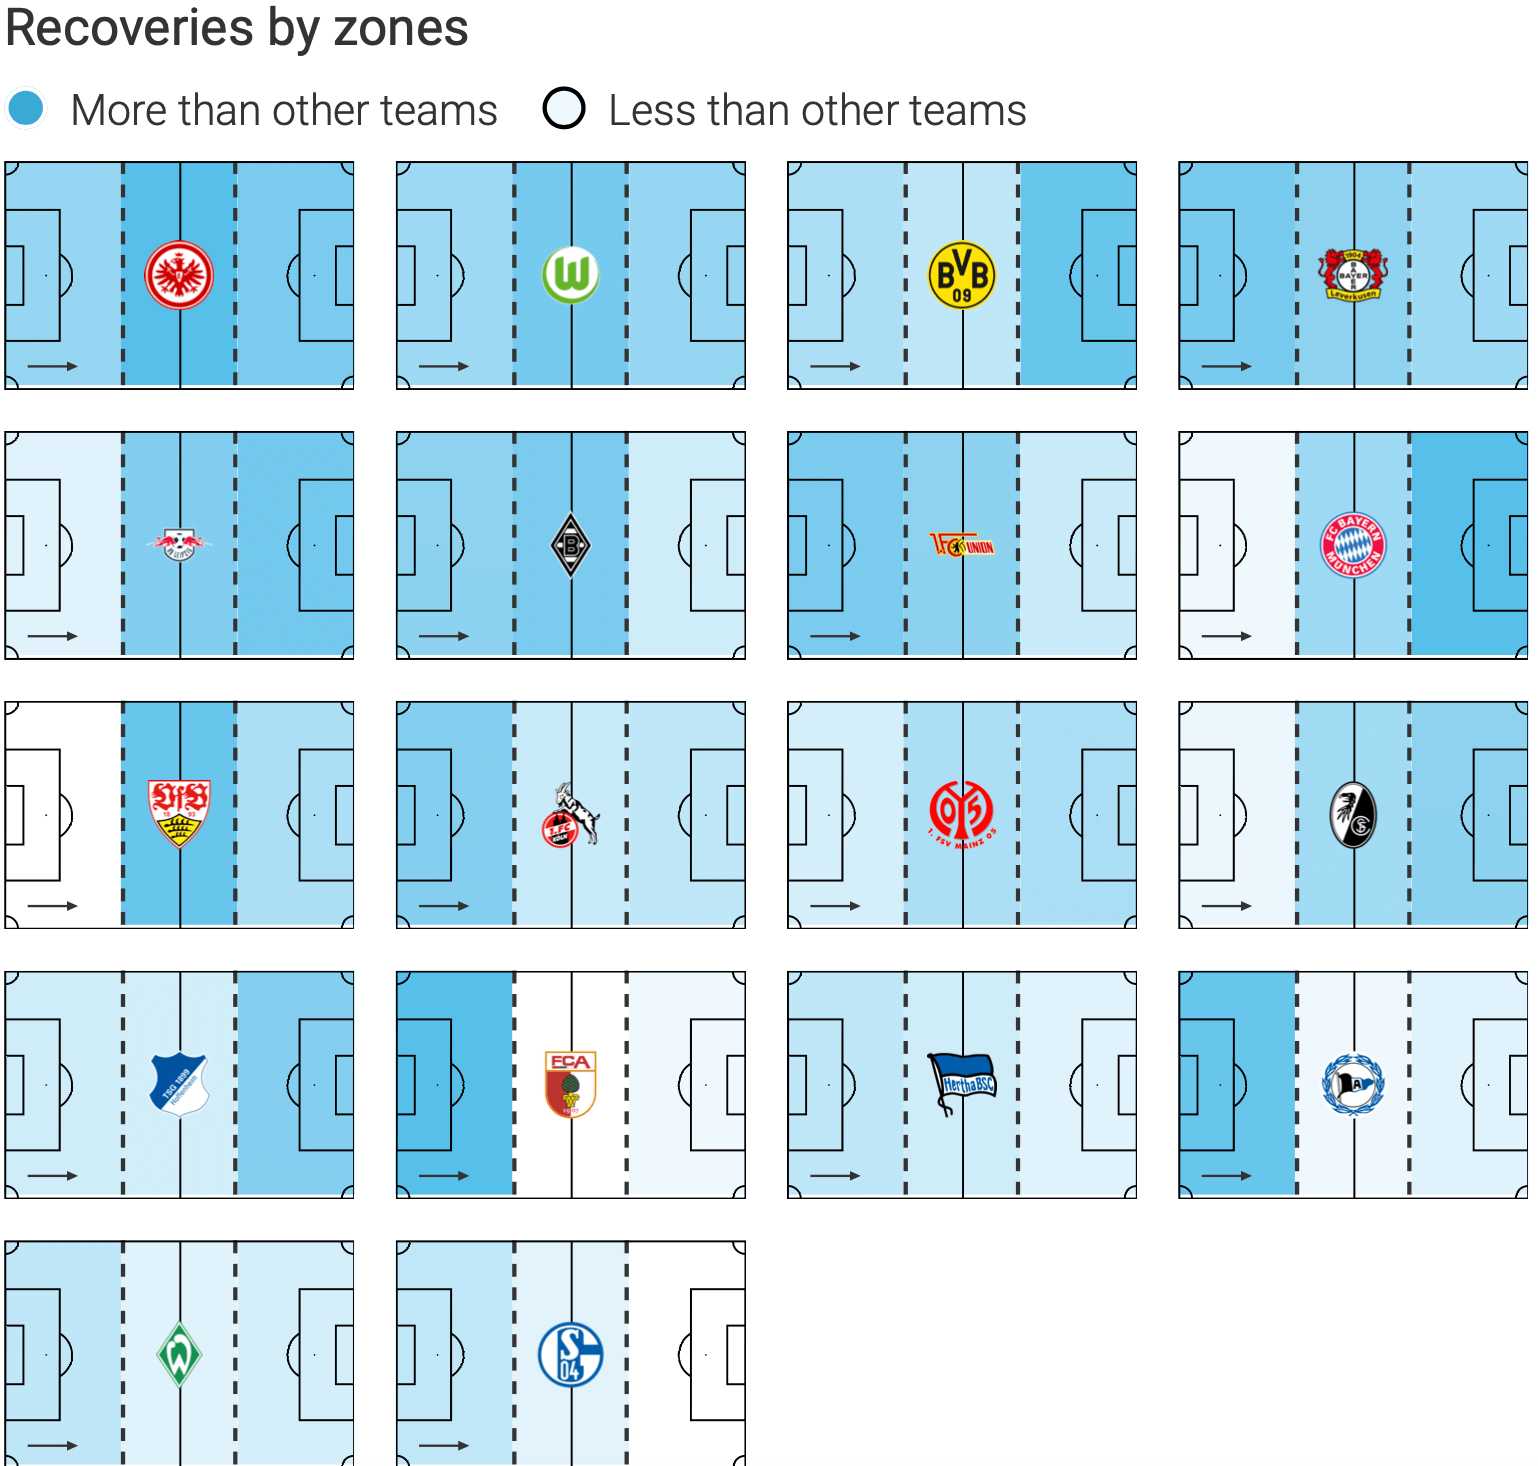
An analysis of the bar chart shows us that there is some correspondence between the areas of the pitch were teams lose possession and were they recover it. Teams like Bayern Munich, Dortmund, Leipzig or Frankfurt are teams that we saw that have a higher number of losses of possession in the final third than others, furthermore, they are also the teams that have the most recoveries of possession in the final third. This hints that these teams try to get the ball back in the same are where they lose it, in other words, these are teams that like to counter press and win the ball back as fast as possible. In the opposite side, teams like Schalke 04, Augsburg and Bielefeld that have the lowest numbers in terms of recoveries in the final third are also the teams with the highest numbers of recoveries in their own third, meaning they usually defend deeper and regroup into shape upon losing possession. With a more balanced profile are teams like Freiburg, Koln or Mainz and they present similar numbers in terms of recoveries in their own third and in the middle third, this teams are teams that can have different reactions to losing possession and more difficult to establish a connection between their loss and recovery areas, however, we can say that wether it is by counterpressing or by regrouping into shape, they aren’t able to do so as high as Dortmund or Leipzig but succeed in maintaining their opponents further from their goal and get the ball back in the middle of the park more often.
To have a more graphical view of this distribution of recoveries in the pitch for each team here is a graphic taken from Wyscout.
Conclusion
In this data and tactical analysis we have covered the teams’s approach to the different phases of the game and attempted to establish comparison between them all, we’ve seen how positional play and possession based football has made is way into the Bundesliga with some success over the years and continues to thrive nowadays. We’ve also seen how even teams that play possession based football are very keen to try and attack in the counter in a way sticking to part of the nature associated with German football. Interesting conclusions like the ability a lot of teams have to recover the ball high up the pitch or the use of a mix between short and long passing are some examples of the tactical diversity present in the Bundesliga nowadays.
Bundesliga is definitely an exciting league and hopefully this analysis will spark up the curiosity to watch different teams from this league playing this season both in the league and in the Champions League.


Comments