2021 Copa América ended with a dream final, a 28-year trophyless drought smashed and a first international title for Lionel Messi.
Pre-tournament chaos to identify a host nation set the tone for an end-to-end event that averaged 14% more fouls than the Euros, 23% more yellow cards and 45% more red cards per match. High pressing, energetic counterpresses and vulnerable rest defences led to an uptick in tactical fouls, but it’s the celebratory image of the legendary Barcelona forward that will forever define this tournament.
With three of the seven knockout round matches ending in penalty kicks and three more ending with a one-goal margin, the Copa América 2021 provided endless drama for a memorable summer.
Much like the Euro 2020 data analysis from a couple of weeks ago, this Copa América 2021 analysis will look at the analytical trends of the tournament. InStat’s Copa América 2021 tournament report is our data source. This data analysis focuses on how goals were scored, themes in possession, defensive statistics and set-piece trends.
How they scored
Let’s start by examining how each team got their goals. InStat’s report gives us insight into each nation’s level of success, shooting locations, attack duration and the average number of passes in goal-scoring moves. We’ll also see the breakdown in open play goals, distinguishing positional attack goals from counterattacking success and examining the role of set pieces.
Looking at the location of conceded goals, oddly enough, Bolivia and Venezuela, the two nations to miss out on the quarterfinals, bookend the list. Peru was the side to concede the most goals from outside of the box while Uruguay was the nation that conceded the fewest goals, allowing just two. One thing to note is these stats include penalty kicks taken during shootout. You’ll notice Peru conceded 14 goals, but three of those came in the shootout victory over Paraguay.

Argentina not only averaged the furthest distance on goals scored with a total of 13.8, but they also scored the most goals from outside of the box, registering three. There’s a significant disparity between first place Argentina and second place Columbia (13.8 to 9.7). The average distance on a goal was 6.6 in the Copa América, which compares to the average of 8 m distance from Euro 2020.
For the tournament, 69% of goals came from within 12 m, 19% and that second zone that reaches the top of the box, 6% from approximately 18 to 25 m and 5% from 25 m+.
One interesting stat from the Euro 2020 Report is that goal-scoring moves averaged a 21-second duration and 7.4 completed passes. South American teams were far more efficient, which again points to the aggressive pressing high up the pitch and end-to-end action. In the Copa América 2021, the average goal-scoring attack took just 14.4 seconds and 4.9 passes, which is much more in line with the contemporary game.

Penalty kicks offered another interesting pattern as shooters tended to prefer the top left and bottom right corners of the goal. Remember that the statistics include shootout, which generally leads to a higher percentage of missed spot-kicks due to the psychological burden of the high stakes shot. The penalty kick success rate of 67% falls 9 percentage points shy of the standard 76% xG rate.
Turning now to positional and set-piece goal analysis, 62% of the tournament’s open play goals came from positional attacks, 38% from counterattacks. For the sake of comparison, the breakdown in the Euros was 73% and 27% respectively. Interestingly, there’s very little disparity in the region in which the attack originated, with the left flank accounting for 7% more goals than the right flank and centre.

Set piece goals ended with a four-way tie with four goals apiece. Paraguay and Peru had the most successful corner kicks while Columbia and Ecuador made the most of their free kick attacks. To no one’s surprise, Argentina’s two goals from direct free kicks from the left foot of Messi led the tournament.
Argentina and Brazil let the tournament in total goals, as well as shots and shots on target per game. Argentina average 12.9 per match while the Brazilians were just a tick lower at 12.7, though the Seleção did manage to put 51% of their shots on frame, the high for the tournament.

It was Uruguay that produced the most chances per match, averaging 9, while Bolivia and Venezuela were far below the rest of the competition, each averaging 1.5 chances per game.
Chile’s struggles in the tournament are highlighted by their 4.2 chances per match, which ranks eighth in the set of 10. That comes despite averaging the second-highest number of successful actions per game at 669 with an 81% success rate, trailing just Brazil in both categories. Chile greatly struggled to produce high-quality scoring opportunities, that despite owning the attacking initiative for a high percentage of the tournament. We’ll dive into that more in the next section.
Trends in possession
Advancing to possession-based statistics, we want to correlate the data below with the analysis from above. Knowing which teams produced the most goals and the best scoring opportunities, as well as the inverse, we can then see what role their attacking style played on the end product.
Referring back to open play goals, the teams with the highest tallies are Brazil, Argentina, Peru, Paraguay and Colombia. Of those five, Brazil was third in possession percentage while Paraguay ranked fifth. Peru, Argentina and Colombia rank 6 through 8 respectively, each with a 49% possession share.

Ecuador’s 57% possession share was the highest of the tournament, but it only produced two open play goals, a mark that only bettered Bolivia’s one. Chile, which held the second-highest mark in possession percentage, only scored two open play goals as well. This is not only a case of possession not equating to goals scored, but that more possession with less talented sides is detrimental to the end product.
This idea is furthered by the ball possession statistics and the number of entries into specific zones of the field. In terms of box entrances, Ecuador managed 14 per game and Chile 13, but only 14% of Ecuador’s possessions reached the box while 15% of Chile’s progressed that far. The tournament average was 14%, which again is heavily impacted by Venezuela’s 9% and Bolivia 6% rates. Brazil and the nations with middling possession statistics achieved the highest percentage of possessions entering the box. Uruguay’s mark of 50% possession and 20% of possessions entering the box is easily our most efficient side.
The attack statistics further the claim that less talented sides with more possession end up with fewer successful attacks. Once again, it’s Brazil and the nations with middling possession numbers that generated the most attacks with shots during the Copa, whereas Ecuador and Chile posted below-average numbers. If you look at positional attacks leading to shots, Ecuador just manages to hit 8%, average for the data set, while Chile sits at 7%.
For positional attacks, those numbers are essentially average, but the kicker is the connection with counterattacking success rates. Chile hit the tournament average of 12 counterattacks per game with an above-average percentage of counterattacks leading to shots. Ecuador, on the other hand, produced just 11 counterattacks per game with 9% leading to shots.

Looking at the nations with the highest percentage of counterattacks leading to shots, the leaders are Argentina, Peru and Uruguay. You could certainly argue Argentina had plenty of talent to play a more possession dominant style, but the level of pragmatism these three nations showed resulted in a tremendous level of counterattacking success.
To no one’s surprise, it’s the three teams with the lowest percentages of possession that completed the fewest passes. Those three, Bolivia, Venezuela and Colombia, also average the longest passes in the tournament and lowest passing accuracy rates. On the other end of the spectrum, it was possession dominant Brazil with the shortest passes (17m) and Argentina (17.4m) with their middling possession percentage that average the shortest passes.

The final image in the section is a 4-in-1. First, we have our passes into the penalty box. Uruguay led the way with 35 per match, followed by the 34th Ecuador and 31 of both Paraguay and Brazil.

Ecuador was cross heavy but had mid-table numbers in key passes per match. Meanwhile, Chile sent fewer crosses per game but still averaged 4.2 shots from them, a 36% success rate which is best in the tournament.
In terms of match tempo, Brazil led the way with 16.5, followed closely by Chile’s 16.3 and a two-way tie between Paraguay and Uruguay at 16.2.
The key takeaways from the final image are Brazil’s excellent work in the final third, using their creativity, individual talent and cohesive attacking style to produce goal-scoring opportunities. For Uruguay, a high-tempo, direct attack gave them an impressive rate of entry into the box. For the champions, Argentina, the style was very pragmatic and opportunistic.
Defensive work
Next, we have each team’s defensive work, much like our Euro 2020 data analysis, we’ll look at challenges, both from the air and on the ground, as well as dribbling challenges. We’ll also look at more traditional stat lines like tackles and interceptions. With interceptions and recoveries in a more general sense, let’s take a look at where teams recover the ball, holding them in comparison to our data from Euro 2020.
Let’s first look at challenges. It’s a clean sweep for Brazil by air, land and dribble. The presence of Real Madrid‘s Casemiro certainly helped Brazil’s numbers in this section of the report, but it’s important to remember that PSG‘s Marquinhos had an excellent tournament as well.

Looking elsewhere, Bolivia and Chile consistently rated near the bottom of the database while the other teams’ performances were highly variable.
Moving on to tackles, it’s the hard-nosed Uruguayan side that led the tournament in tackles per game, finishing top with Peru. In terms of tackling efficiency, Brazil 67% success rate easily takes the cake over Ecuador’s 58% rating.

The worst tackling team by a significant margin, Bolivia’s 36% success rate in tackles is coupled with the highest number of interceptions per match at the Copa América with 46. Given they played in a deep block with a defensive initiative, the tournament leading interception total is reasonable.
The tournament average for interceptions in the opposition’s half was eight. Interestingly, the four sides with the fewest interceptions per match each averaged at least eight in the opposition’s half. Brazil and Ecuador led the way with 11 and 10 respectively, which is due to their possession dominant styles of play.
Uruguay picked up the most free balls per game as well as in the opposition’s half. Their pressing style was highly effective in this tournament; only the final product was missing.
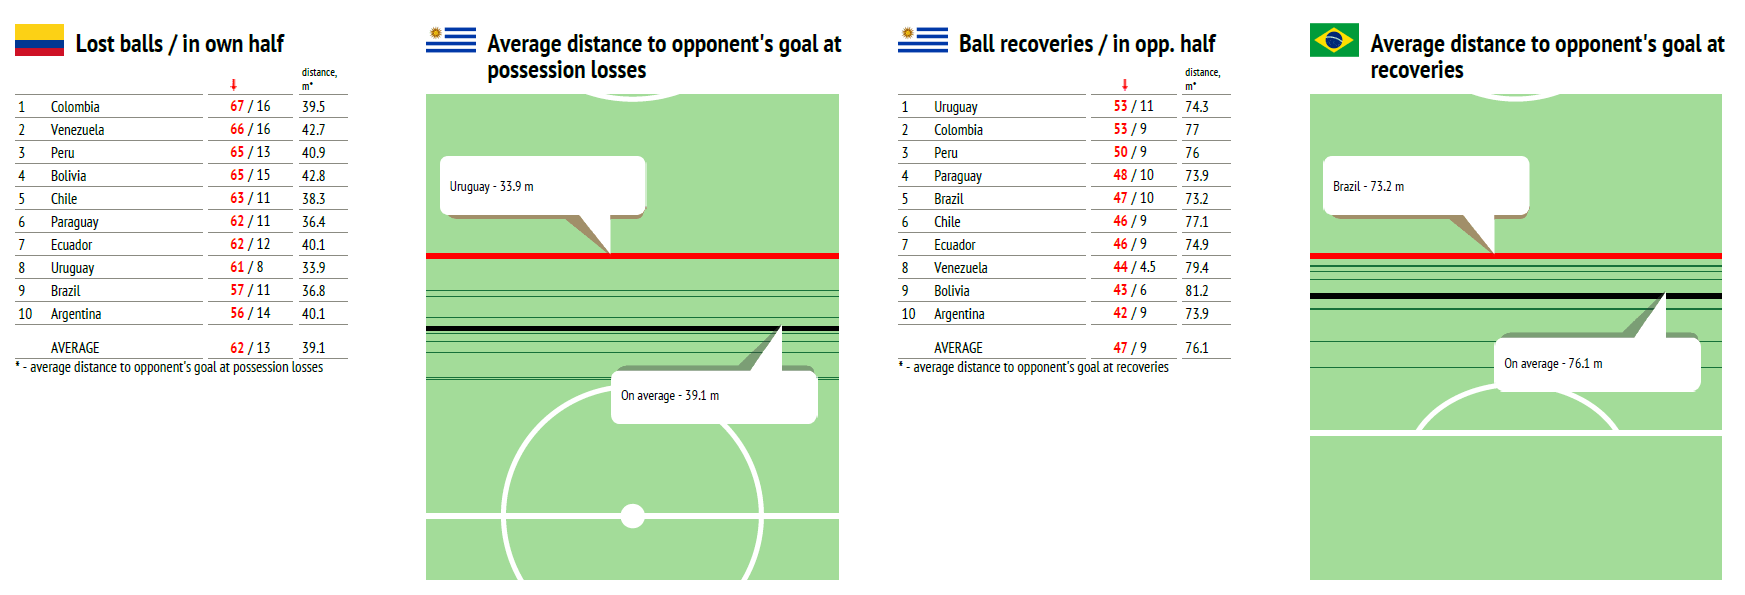
The final image in the section examines lost balls and ball recoveries, noting the total number, stats targeting the opposition’s half and average distances from the opponent’s goal.
Oddly enough, Argentina had the fewest lost balls and ball recoveries per match. When they lost the ball, they tended to lose it from a slightly deeper position, but their recoveries were an average of 73.9 m from the opposition school, tying them with Paraguay for second behind Brazil’s mark of 73.2 m.

Columbia rated at the top of the lost balls category and second to Uruguay and Paraguay recoveries, giving an idea of the frenetic action in their matches.
Comparing the two tournaments, the Copa América averaged 34 tackles per match to the Euros 31, 41 interceptions for the Copa to 46 at the Euros. Picking up free balls was also more common at the Euros where the Europeans averaged 54 to the South Americans’ 51. The slight preference for tackles over interceptions at the Copa América is largely down to the more open gameplay at the tournament. Again, with the end-to-end action and rest defences not situated to deal with a counterpress-breaking pass, there was a greater reliance on individual defending than a team-wide network.
Set pieces
Our final section looks at set-pieces. The total number of set pieces per game is our starting point, but we also want to look at the location of the deliveries and the success rates of each zone. We also want to give credit to the teams that performed well in the set-piece category, which in turn, gives us coaches, analysts and super-fans an opportunity for additional study.
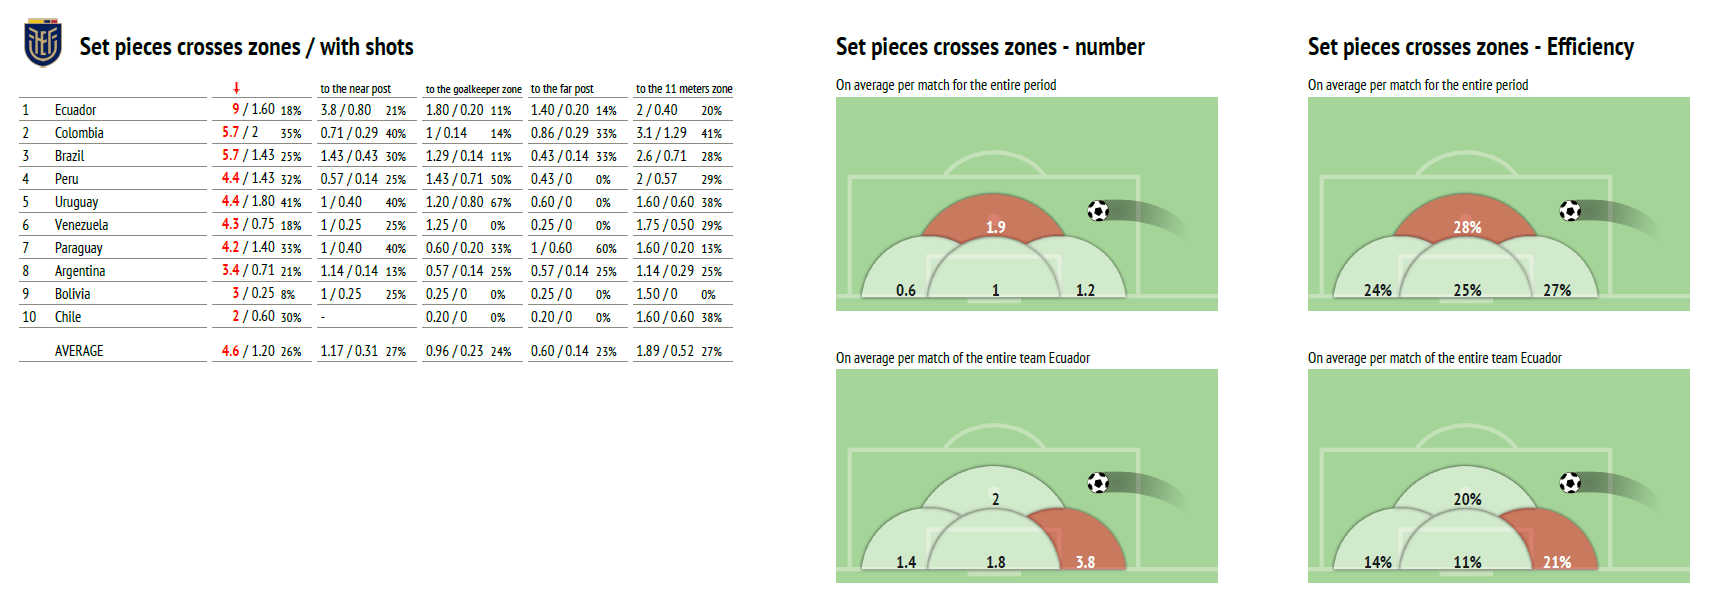
Let’s start off with Ecuador. We’ve spoken about this side so often that if you hadn’t watched the tournament, you never would have guessed that they finished fourth in the North division and lost in the quarterfinals to Argentina. There nine set pieces per match are far superior to the 5.7 of Colombia and Brazil, the two nations with the second-highest number of set pieces per game. Ecuador’s issue wasn’t the number of set pieces but their efficiency. Of those nine set pieces, 1.6 ended with a shot which equates to an 18% success rate, well below the tournament average of 26%. Their deliveries had a clear preference for the near post into the 11 m zone, but they clearly lacked a final product.

Uruguay had the greatest degree of success with set-pieces (41%) and Columbia produced the most shots per game with two.
The most common destination for set-piece crosses was the 11-m zone. An average of 1.9 crosses were sent to that area per match, easily outpacing the 1.2 deliveries to the near post. In terms of The percentage of crosses leading to shots, it was the 11 m zone that was the most efficient at 28%. That said, there really wasn’t much discrepancy in the four zones.
Conclusion
One of the beauties of the Euros and Copa América running simultaneously is that we can witness and celebrate the differences in the football cultures. Interestingly enough, it was the high press, counterpressing and intensity of the Copa América that was more closely aligned with present tactical trends. Whereas the Europeans slowed the game down, requiring more time and passes on goal-scoring moves, the South Americans were much more efficient and aggressive in their pursuit of high recoveries.
With a number of South American sides seeing their golden generations play their final tournament, the clear favourites to reach the final were Brazil and Argentina. As fans, we were not disappointed.
In the end, it’s a first international trophy for Messi and an end to Argentina’s 28-year title drought. They had to surprise the host nation in the final, but the sense of relief and joy on the Argentinian players faces shows the significance of their accomplishments. Indeed, Messi falling to his knees, weeping tears of joy, shows exactly how meaningful this tournament is.


Comments