Corner kicks are a vital part of football. Whilst the corner kick is sometimes misconceived due to an overinflated perception of success, the set-piece can differentiate between winning, losing and drawing outcomes in an instant, therefore, highlighting the need to repeatedly investigate corners. Studies have shown corners to result in a goal in as little as 2.2% of occasions in the EPL La Liga and UEFA Champions League. The low success rate of corners mean that a successful corner kick routine and delivery have increased importance, given teams can significantly enhance their chances or scoring or preventing the opposing team from scoring through effective corner kick performance. For this reason, corner and set-piece analysis is constantly being produced within football clubs and in the wider football analysis world. The importance of corner kicks can be further emphasised by the recent introduction of specialist corner and set-piece coaches and analysts within the game.
This corner kick data analysis will focus upon offensive corner statistics from the Belgian First Division A in 2019/20. This piece will help to determine trends along with frequent, successful and effective routines for teams in the league. The piece will act as an introductory study into corner kicks in the Belgian league, leading to the potential for a more detailed analysis of the strategies and routines identified by the data. This piece will also help to preview the 2020/21 season by predicting which teams may be the leaders in corner kick execution, as well as teams who need to improve within this area.
League overview
In the 2019/20 season in the Belgian league, 2030 corners were taken which resulted in 69 goals, a conversion rate of 3.39%, which is higher than previous studies of an academic and applied notion on different leagues and competitions. The league average resulted in 133.8 corners per team, 21.8 shots from such corners, a shot in 16.29% of corners, a total xG of 2.45, and an xG per shot of 0.11. This analysis further reinforces the difficulty of delivering and creating chances from corner kicks. The average number of goals scored from corners was 4.31 per team, an overperformance of the xG. The low xG may be due to the typical headed nature of corner related shots. Headed shots are naturally more difficult to score from and so earn a lower xG. However, the overperformance may be due to the mechanism of the corner. Usually, the ball is crossed into the area with pace, therefore, any headed shot to flick the ball or redirection of the ball is difficult for the goalkeeper to save. This is due to the pace on the ball, changes in direction, the low perception, and reaction time given there are multiple players trying to attack and defend within close proximity in the 18-yard box.
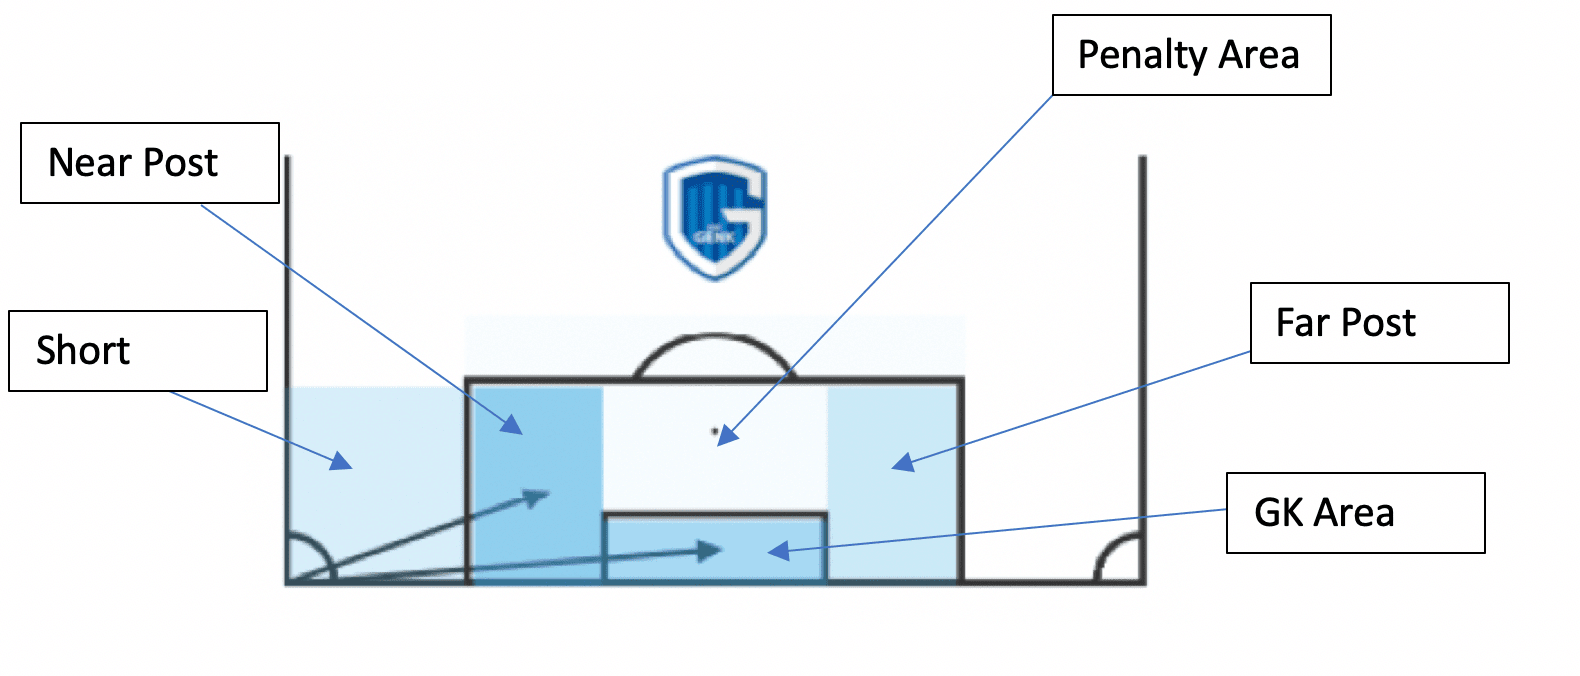
The analysis above is justified in terms of a breakdown of the target zones. The most popular delivery zone is near post. The most effective target zone in terms of percentage of corners resulting in shots was the penalty area with a shot in 29.16% of corners to that area, a diagram of the target zones can be found below. However, the penalty area zone is not the most dangerous area to take a shot from. Statistically, the penalty area zone provides the highest chance of a shot, but this is likely due to the fact the penalty box zone is the largest, easiest to deliver to, and attack the ball from. The penalty area zone does not deliver the highest xG in terms of chance quality per shot, most likely due to the fact it is further away from the goal than other zones. The most effective in terms of xG per shot was the GK zone (0.19), commonly known as the six-yard box. Whilst the most shots come from the penalty box zone, the highest quality shots come from the GK zone due to the shortened distance between the attacker and the goal, therefore providing a closer target for the attacker and less time for the goalkeeper to react, therefore, increasing the expectancy of goals after shots in this area.
| League Average | All Corners | Near Post Corners | Far Post Corners | Penalty Box Corners | Corners to GK Zone | Short Corners |
| Number of Corners | 133.8 | 39.5 | 22.2 | 12 | 35.4 | 17.8 |
| Corners with Shots | 21.8 | 4.2 | 5.1 | 3.5 | 6.8 | 0 |
| Percentage of Corners with Shots (%) | 16.29 | 10.63 | 22.97 | 29.17 | 19.21 | 0 |
| Total xG | 2.45 | 0.38 | 0.36 | 0.36 | 1.29 | 0 |
| xG Per Shot | 0.11 | 0.09 | 0.07 | 0.10 | 0.19 | 0 |
Whilst the league average was 4.31 goals from corners in the 2019/20 season, different teams in the league performed above or below this average. Ranked top for corner goals were Club Brugge, which may provide further justification of their offensive quality after the team also won the league. Ranked bottom were Oostende, which may provide additional reinforcement of their attacking frailties after they finished 15th out of 16 teams. However, the discussion that these statistics may reinforce team quality needs to be stressed. This is because, through previous knowledge, we know that corners are influenced by possession, territory and playing style. If a team has a large amount of possession, in high and wide areas, and is frequently taking shots, making crosses or taking on defenders, they are likely to receive more corner kick opportunities to score from. On the flip side, teams with low possession, a deeper and narrower average position, and the inability to take large amounts of shots, crosses or take-ons will earn fewer corners and therefore fewer chances to score from corners. Let’s see if this theory is true within the Belgian league.
| Team | Total Goals from Corners | Finishing Position | Average Possession | Average Corners per Game |
| Club Brugge | 11 | 1 | 59.4 | 5.99 |
| Mechelen | 9 | 6 | 46.7 | 3.98 |
| Sporting Charleroi | 6 | 3 | 46 | 4.9 |
| Mouscron | 5 | 9 | 48.8 | 4.48 |
| Gent | 5 | 2 | 57.1 | 4.42 |
| Kortrijk | 4 | 11 | 49.7 | 4.6 |
| KAS Eupen | 4 | 13 | 45 | 3.79 |
| Standard Liège | 4 | 5 | 51.5 | 4.92 |
| Sint-Truiden | 4 | 12 | 52.7 | 3.84 |
| Antwerp | 3 | 4 | 48 | 4.39 |
| Genk | 3 | 7 | 54.2 | 5.33 |
| Cercle Brugge | 3 | 14 | 49.7 | 4.46 |
| Anderlecht | 3 | 8 | 56 | 5.11 |
| Waasland-Beveren | 2 | 16 | 44 | 3.68 |
| Zulte-Waregem | 2 | 10 | 49.3 | 4.29 |
| KV Oostende | 1 | 15 | 40.9 | 3.98 |
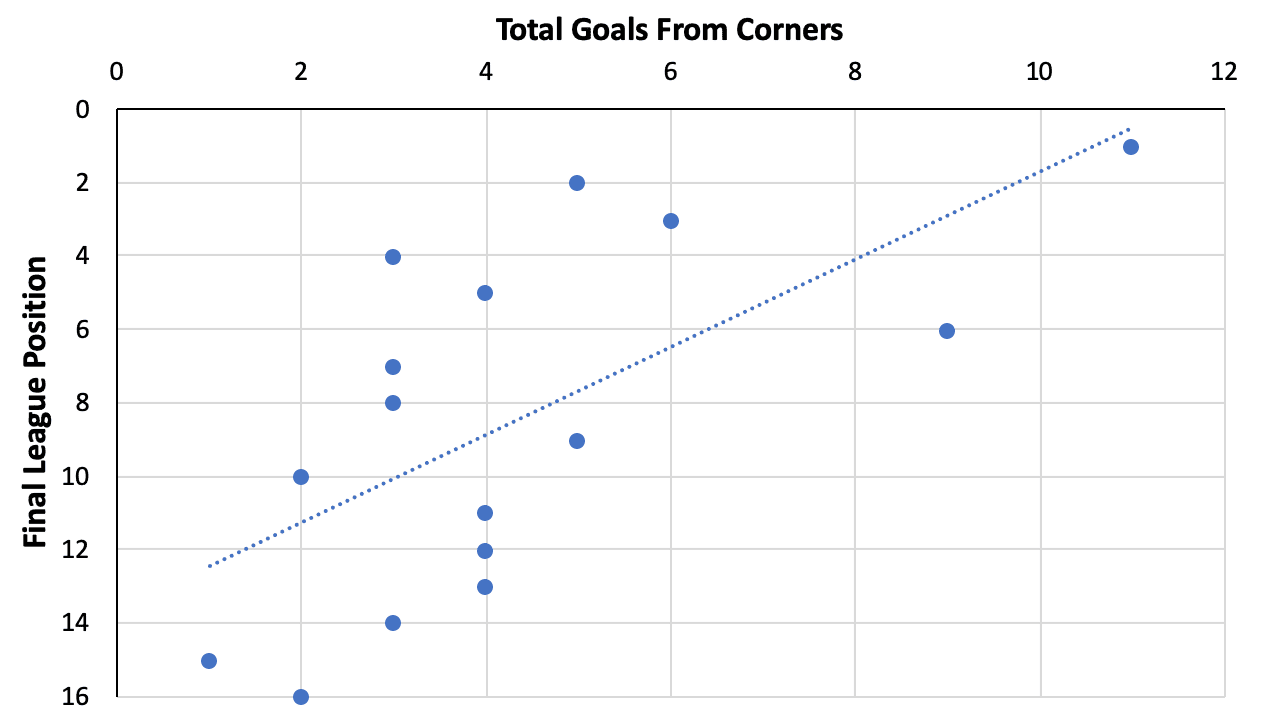
The average final league position of teams who performed above the average corner goal tally is 4.2, a successfully low average ranking given there are 16 teams in the league. For those that underperform, the average finishing position is 9.25, a higher, less successful ranking. This, along with the scatterplot below, shows that the more successful teams in the league in generally score more goals from corners. But why?
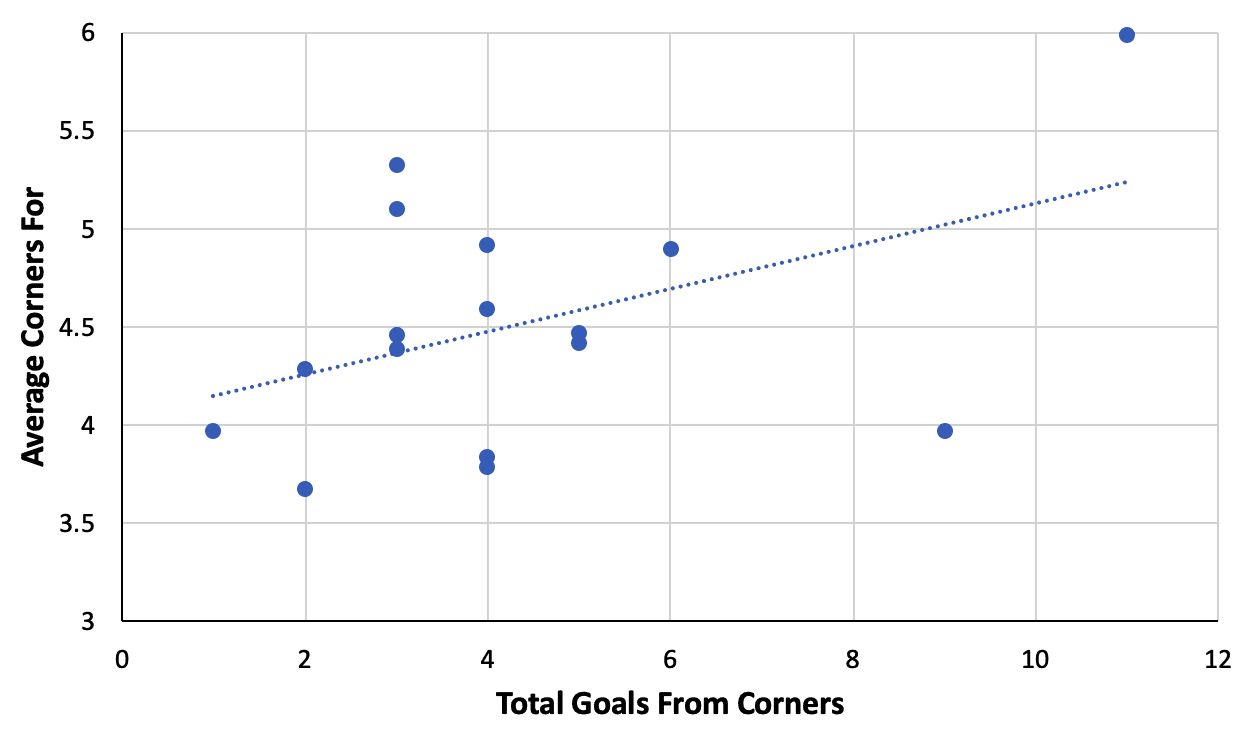
When the same calculation is performed for the number of corners for per game. The average is 4.51 corners for. Those that overperform have an average final league position of 5.83 and those that underperform have an average league position of 10.1. Fitting with the average final league position and goals from corners analysis, the average number of corners also has a positive correlation with total goals from corners. This fits the theory as it highlights that those that have a better final position, earn more corners to score more goals from. Again, though, the question is why?

Of those teams who outperform the average corner count, the average possession is 52.8%, whereas those that underperform versus the corner count average have an average possession of 49%. This rounds off the theory by highlighting that possession is an indicator of corner count. With higher possession resulting in more corners and an increased chance to take advantage of such corners in terms of goals. Further analysis could be performed to determine the preceding actions to corners, as mentioned, shots, crosses and take-ons. However, we can accept the positive correlation between a successful finishing position, high possession, a high corner count and a higher number of goals scored from corners.
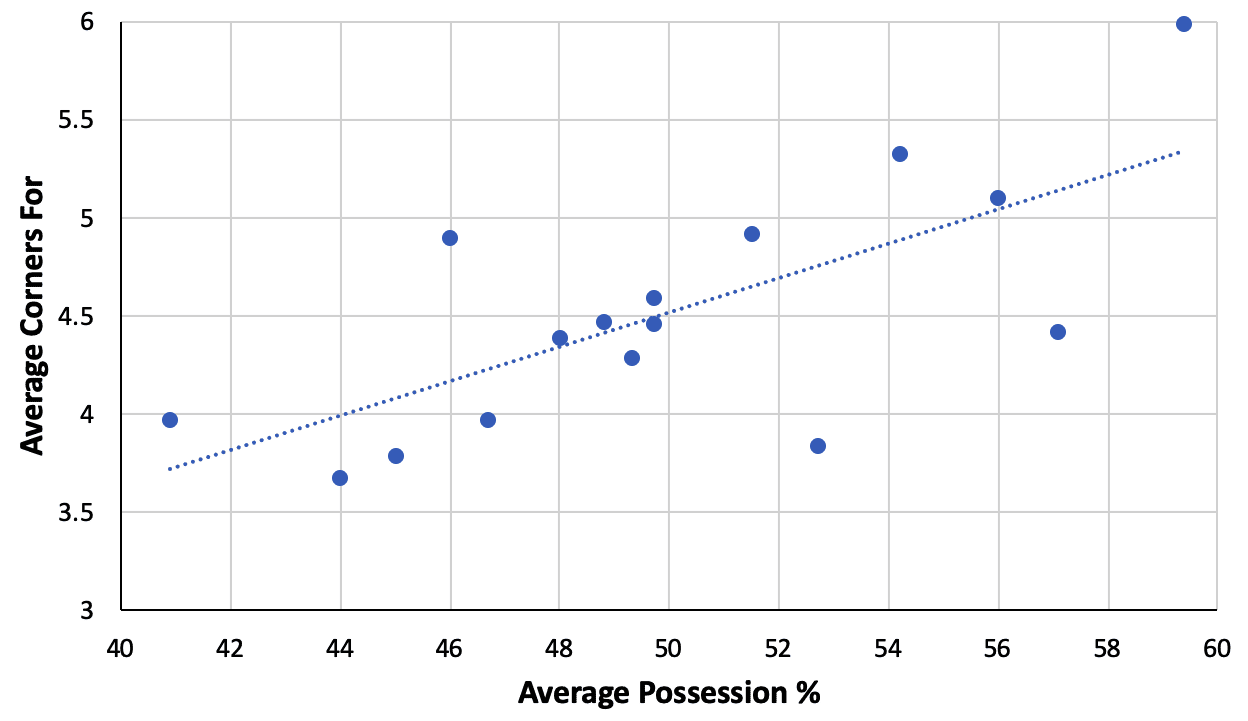
Overall, this analysis highlights a positive correlation between league position, possession, corner count and the number of goals scored from corners.
Finding the best teams at offensive corners
Given it has been determined that the most effective way to analyse corner routines is by appraising averages per corner taken, as opposed to total values from all corners taken, we can now appraise the most successful teams in terms of corner routines overall and per target zone. Below you can see a diagram assessing the distribution of corners per team, with higher frequencies per target zone outlined via darker shaded areas and directional arrows. The defined areas include short, near post, far post, penalty area and GK area deliveries.
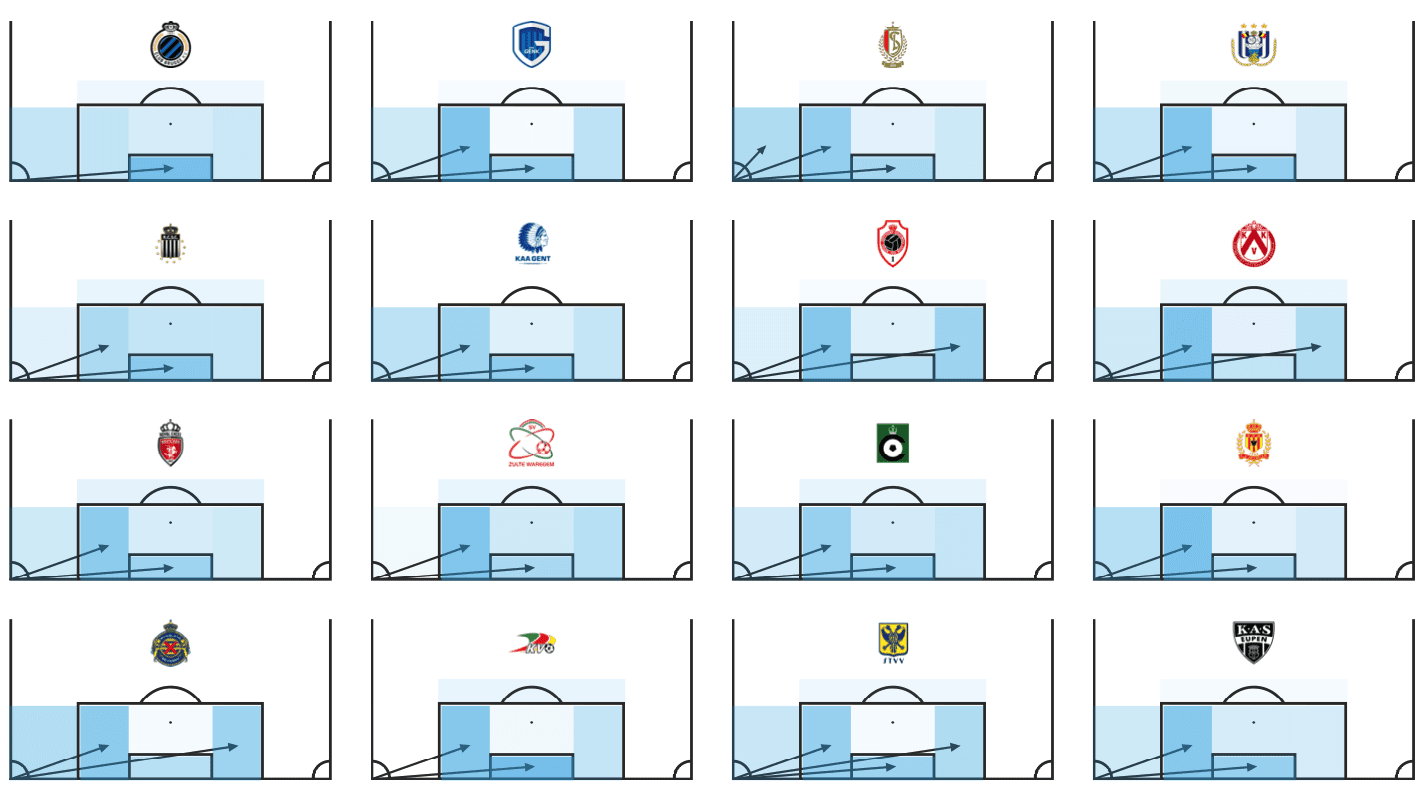
From an overall appraisal of corners below, we can see that Sint-Truiden are the most effective team in terms of the percentage of their corners that result in shots (21.3%). Mechelen have the highest xG per corner. This again provides justification for looking at corners on a case by case basis with per corner analysis, rather than looking at overall statistics. League winners Club Brugge have a shot in 19.28% of corners and produce an xG of 0.13 per shot, lower values than the leaders in each metric, despite Club Brugge taking the most corners in the season. Zulte-Wagrem can be considered the least effective at creating chances from corners with only 8.26% of corners resulting in a shot. However, Kortrijk are the least effective in terms of the quality of chances created when a shot is taken. Kortrijk have an xG per shot from corners of 0.066.
| Team | Total Corners | Total Corners with Shots | Percentage of Corners with Shots | Total xG | xG Per Shot from Corner |
| Mechelen | 116 | 18 | 15.52 | 2.81 | 0.156 |
| Gent | 128 | 26 | 20.31 | 4.03 | 0.155 |
| Mouscron | 124 | 14 | 11.29 | 2.03 | 0.145 |
| Standard Liège | 142 | 24 | 16.90 | 3.39 | 0.141 |
| KAS Eupen | 108 | 18 | 16.67 | 2.53 | 0.141 |
| Waasland-Beveren | 111 | 16 | 14.41 | 2.18 | 0.136 |
| Genk | 151 | 24 | 15.89 | 3.23 | 0.135 |
| Club Brugge | 166 | 32 | 19.28 | 4.24 | 0.133 |
| Sint-Truiden | 108 | 23 | 21.30 | 2.93 | 0.127 |
| Antwerp | 127 | 21 | 16.54 | 2.32 | 0.110 |
| Anderlecht | 138 | 17 | 12.32 | 1.84 | 0.108 |
| KV Oostende | 109 | 21 | 19.27 | 1.95 | 0.093 |
| Sporting Charleroi | 136 | 27 | 19.85 | 2.44 | 0.090 |
| Cercle Brugge | 120 | 11 | 9.17 | 0.89 | 0.081 |
| Zulte-Waregem | 121 | 10 | 8.26 | 0.71 | 0.071 |
| Kortrijk | 125 | 12 | 9.60 | 0.79 | 0.066 |
Corners to the near post
By analysing corners where the near post was the delivery and/or target zone, we can see that Gent are the most effective team in terms of the percentage of their corners that result in shots (22.22%). Kortrijk have the highest xG per corner with 0.16 despite producing the lowest xG per shot from a corner overall. Sporting Charleroi have the lowest corner to shot ratio and the lowest xG per shot from a near post corner.
| Team | Near Post Corners | Near Post Corners with Shots | Percentage of Near Post Corners with Shots | Total xG from Near Post Corners | xG Per Near Post Corner with Shot |
| Kortrijk | 36 | 3 | 8.33 | 0.48 | 0.16 |
| Zulte-Waregem | 32 | 5 | 15.63 | 0.7 | 0.14 |
| KV Oostende | 43 | 6 | 13.95 | 0.73 | 0.12 |
| Gent | 54 | 12 | 22.22 | 1.25 | 0.10 |
| Sint-Truiden | 40 | 5 | 12.50 | 0.47 | 0.09 |
| Cercle Brugge | 38 | 6 | 15.79 | 0.53 | 0.09 |
| Mechelen | 29 | 1 | 3.45 | 0.08 | 0.08 |
| Waasland-Beveren | 33 | 4 | 12.12 | 0.31 | 0.08 |
| Genk | 43 | 6 | 13.95 | 0.44 | 0.07 |
| Club Brugge | 47 | 4 | 8.51 | 0.27 | 0.07 |
| KAS Eupen | 32 | 2 | 6.25 | 0.13 | 0.07 |
| Mouscron | 43 | 4 | 9.30 | 0.24 | 0.06 |
| Antwerp | 44 | 2 | 4.55 | 0.11 | 0.06 |
| Anderlecht | 35 | 3 | 8.57 | 0.15 | 0.05 |
| Standard Liège | 49 | 3 | 6.12 | 0.14 | 0.05 |
| Sporting Charleroi | 34 | 1 | 2.94 | 0.04 | 0.04 |
Corners to the far post
By analysing corners where the far post was the delivery and/or target zone, we can see that Sporting Charleroi are the most effective team in terms of the percentage of their corners that result in shots (43.48%). KAS Eupen have the highest xG per corner at 0.1. Genk have the lowest corner to shot percentage, while Kortrijk have the lowest xG per shot from a far post corner.
| Team | Far Post Corners | Far Post Corners with Shots | Percentage of Far Post Corners with Shots | Total xG from Far Post Corners | xG per Far Post Corner with Shot |
| KAS Eupen | 13 | 2 | 15.38 | 0.2 | 0.100 |
| Standard Liège | 20 | 3 | 15.00 | 0.28 | 0.093 |
| Mechelen | 14 | 4 | 28.57 | 0.36 | 0.090 |
| Club Brugge | 25 | 7 | 28.00 | 0.62 | 0.089 |
| Cercle Brugge | 20 | 4 | 20.00 | 0.34 | 0.085 |
| Sint-Truiden | 24 | 7 | 29.17 | 0.57 | 0.081 |
| Antwerp | 34 | 6 | 17.65 | 0.48 | 0.080 |
| Zulte-Waregem | 25 | 4 | 16.00 | 0.29 | 0.073 |
| Genk | 26 | 4 | 15.38 | 0.28 | 0.070 |
| Sporting Charleroi | 23 | 10 | 43.48 | 0.68 | 0.068 |
| Gent | 21 | 5 | 23.81 | 0.34 | 0.068 |
| Mouscron | 18 | 4 | 22.22 | 0.26 | 0.065 |
| Waasland-Beveren | 29 | 8 | 27.59 | 0.5 | 0.063 |
| Anderlecht | 17 | 4 | 23.53 | 0.21 | 0.053 |
| KV Oostende | 18 | 5 | 27.78 | 0.25 | 0.050 |
| Kortrijk | 28 | 5 | 17.86 | 0.17 | 0.034 |
Corners to the penalty area
By analysing corners where the penalty area was the delivery and/or target zone, we can see that Waasland-Beveren are the most effective team in terms of the percentage of their corners that result in shots (60%). Oostende have the highest xG per corner. Standard Liège have a 0% corner to shot ratio and, therefore, zero xG from corners delivered into the penalty area zone.
| Team | Penalty Area Corners | Penalty Area Corners with Shots | Percentage of Penalty Area Corners with Shots | Total xG from Penalty Area Corners | xG per Penalty Area Corner with Shot |
| KV Oostende | 5 | 2 | 40.00 | 0.31 | 0.155 |
| Sint-Truiden | 12 | 5 | 41.67 | 0.68 | 0.136 |
| Genk | 15 | 2 | 13.33 | 0.27 | 0.135 |
| Club Brugge | 9 | 1 | 11.11 | 0.12 | 0.120 |
| Mouscron | 10 | 2 | 20.00 | 0.24 | 0.120 |
| Gent | 15 | 2 | 13.33 | 0.23 | 0.115 |
| Cercle Brugge | 23 | 6 | 26.09 | 0.65 | 0.108 |
| Kortrijk | 13 | 7 | 53.85 | 0.72 | 0.103 |
| Zulte-Waregem | 11 | 1 | 9.09 | 0.1 | 0.100 |
| Antwerp | 12 | 5 | 41.67 | 0.49 | 0.098 |
| Mechelen | 13 | 7 | 53.85 | 0.67 | 0.096 |
| Anderlecht | 6 | 2 | 33.33 | 0.16 | 0.080 |
| Sporting Charleroi | 16 | 4 | 25.00 | 0.31 | 0.078 |
| KAS Eupen | 20 | 7 | 35.00 | 0.54 | 0.077 |
| Waasland-Beveren | 5 | 3 | 60.00 | 0.23 | 0.077 |
| Standard Liège | 7 | 0 | 0.00 | 0 | 0.000 |
Corners to the GK zone
By analysing corners where the GK zone was the delivery and/or target zone, we can see that Sint-Truiden are the most effective team in terms of the percentage of their corners that result in shots (30.77%). Waasland-Beveren have the highest xG per corner (0.353). Sporting Charleroi failed to register a shot in this zone and so their percentage of shots and xG is zero.
| Team | GK Area Corners | GK Area Corners with Shots | Percentage of GK Area Corners with Shots | Total xG from GK Area Corners | xG per GK Area Corner with Shot |
| Waasland-Beveren | 21 | 4 | 19.05 | 1.41 | 0.353 |
| Genk | 34 | 3 | 8.82 | 1.03 | 0.343 |
| Mouscron | 27 | 6 | 22.22 | 1.48 | 0.247 |
| Antwerp | 25 | 4 | 16.00 | 0.91 | 0.228 |
| Sint-Truiden | 39 | 12 | 30.77 | 2.7 | 0.225 |
| Mechelen | 35 | 10 | 28.57 | 2.2 | 0.220 |
| Standard Liège | 43 | 8 | 18.60 | 1.7 | 0.213 |
| Kortrijk | 31 | 6 | 19.35 | 1.13 | 0.188 |
| KAS Eupen | 64 | 17 | 26.56 | 3 | 0.176 |
| Club Brugge | 41 | 9 | 21.95 | 1.37 | 0.152 |
| KV Oostende | 30 | 9 | 30.00 | 1.35 | 0.150 |
| Anderlecht | 44 | 8 | 18.18 | 1.01 | 0.126 |
| Zulte-Waregem | 22 | 2 | 9.09 | 0.25 | 0.125 |
| Cercle Brugge | 45 | 9 | 20.00 | 0.98 | 0.109 |
| Gent | 35 | 2 | 5.71 | 0.17 | 0.085 |
| Sporting Charleroi | 30 | 0 | 0.00 | 0 | 0.000 |
Short corners
Due to the short pass which occurs at the start of a short corner, it is difficult to analyse the resulting play to determine whether such play and any success occur within the initial phase of the play during the corner or an additional phase of play. For this reason, Wyscout data categorises the short corner as the main phase of the corner. Because of this, Wyscout does not attribute any shots or xG that come after short corner routines to their short corner analysis. They do, however, measure the number of short corners per team. From this analysis, we can see that Standard Liège are the most frequent users of short corners in terms of frequency (31) and the percentage of all corners taken (21.83%).
| Team | Total Short Corners | Short Corner % of Total Corners Taken |
| Standard Liège | 31 | 21.83 |
| Waasland-Beveren | 22 | 19.82 |
| Mechelen | 22 | 18.97 |
| Gent | 23 | 17.97 |
|
Club Brugge
|
28 | 16.87 |
| Anderlecht | 22 | 15.94 |
| Sint-Truiden | 17 | 15.74 |
| Genk | 21 | 13.91 |
| KAS Eupen | 15 | 13.89 |
| Mouscron | 17 | 13.71 |
| Kortrijk | 17 | 13.60 |
| Cercle Brugge | 15 | 12.50 |
| Antwerp | 13 | 10.24 |
| Sporting Charleroi | 13 | 9.56 |
| Zulte-Waregem | 6 | 4.96 |
| KV Oostende | 3 | 2.75 |
Conclusion
Overall, this data analysis on corner kicks in the Belgian First Division A has identified some interesting points regarding the use and effectiveness of corners. Statistically, the most popular zone of delivery is the near post. The most successful zone in terms of creating a shooting opportunity is the penalty area zone, however, the most effective zone in terms of chance quality is the GK zone.
From the analysis, we have determined that overall corner success in terms of total values has a positive correlation with the final league position of a team and their average possession statistics. Both of those metrics result in a higher number of corners per match and therefore an increased number of corners to create and score from.
When the corners are normalised to negate the impact of corner frequency, we can see different teams at the top and bottom of the overall rankings and rankings per delivery zone. Overall, Sint-Truiden create the most chances from corners, however, per shot, Mechelen’s corners are more effective in terms of the quality of chances created. Zulte-Wargem create the fewest chances, whereas Kortrijk produce the lowest quality chances per shot. The best and worst teams per corner zone vary, with few trends to note.
Hopefully, this analysis has shed some light on offensive corners in the Belgian league, providing useful information for managers, coaches, scouts, players, analysts and fans who are interested in set-piece performance in general, or within this league. The is analysis can be used as a starting point to identify specific routines utilised by teams in the Belgian First Division A, to specifically identify what makes teams, routines, and delivery zones successful or unsuccessful.


Comments