

The step from youth football to the professional game can be very tough. While we only see the nice part of it in players who make it to the top, there are lots of them who are left in the way. As we will see in this analysis, even those who are among the best in the world in their age groups struggle to get into elite-level football.
Recent U20 World Cup Golden Ball winners include elite players like Lionel Messi, Sergio Agüero or Paul Pogba, but also players who didn’t reach an elite level like Henrique Almeida, Ismail Matar or Dominic Adiyiah. The distance between youth football and the real game is huge, and it’s always difficult to predict how players will adapt and develop.
Goal and methodology
The goal of this introductory statistics analysis is to see how much we can expect from the players in the best U20 and U17 national teams in the world. We will analyze the career of more than 130 players who finished first or second in the U20 and U17 World Cups in 2009, 2011 and 2013 editions. To be included in this data analysis, the players must have played at least half of the minutes in the competition (315 minutes), and the time scope of the analysis is the five years after the tournament.
This way, we will get an idea of the players’ middle term development after being part of the best youth teams in the world. There are various applications for this study. It can be useful for scouting and recruitment purposes, helping realize the development one can expect from the players who stand out in youth competitions. It could also highlight some issues in the career development in different continental federations, as we will see there are big differences between UEFA, CONMEBOL, CAF and CONCACAF players in terms of development after reaching a youth World Cup final.
As we said before, we have considered here the matches played in the five years after the competition. The level of those matches was also taken into account, and we established five different levels to evaluate not only the quantity but also the quality of matches. We assigned a value to each match depending on the level, so we could distinguish between players who are regular starters at a top-level competition and those who also play a lot but at a lower standard. The levels and their value is assigned like this:
- Level 1: first divisions of England, Germany, Spain, France and Italy; and UEFA Champions League. Each match has a value of 1.
- Level 2: first divisions of Netherlands, Russia, Portugal, Belgium, Brazil and Argentina; second division of England; UEFA Europa League and Copa Libertadores. Each match has a value of 0.8.
- Level 3: first divisions of Turkey, Ukraine, Switzerland, Austria, Mexico and USA; and Copa Sudamericana. Each match has a value of 0.6.
- Level 4: first divisions of Croatia, Scotland and Greece; and second divisions of Spain and Italy. Each match has a value of 0.4.
- Level 5: first divisions of Denmark, Romania, Czech Republic and Serbia; and second division of France. Each match has a value of 0.2.
Matches of the rest of the leagues were not taken into account given their low level, but if a team not represented in any of the levels played one of the continental competitions, those continental matches were taken into account. Dividing the total amount of points by the number of matches and multiplying by ten, we get the level score, which ranges from 20 (all matches played in Level 5 competitions) to 100 (all matches played in Level 1 competitions). Matches played in competitions not included in any level don’t count at all, so the level is calculated only for matches from competitions included.
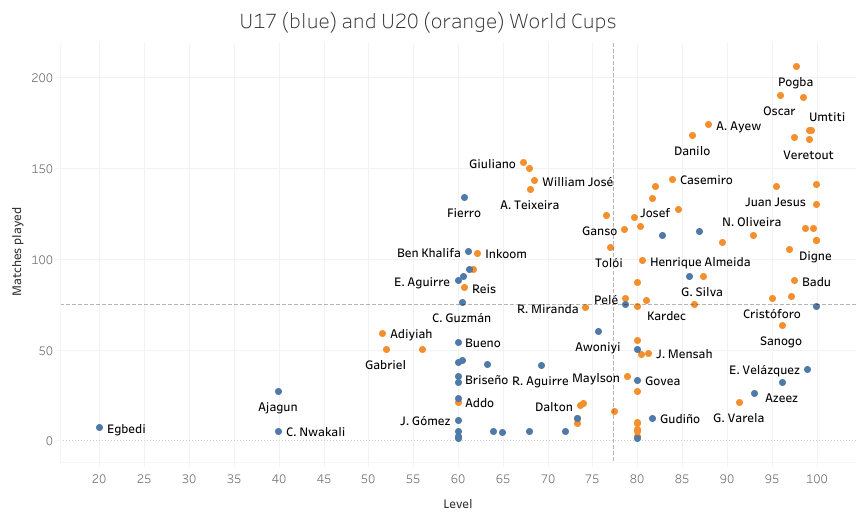
This first chart shows all the players who have played at least one match in the competitions we selected and played more than 315 minutes for the U20 and U17 World Cups finalists in 2009, 2011 and 2013. Logically, the playing time quantity and quality after the U20 World Cup are better than after the U17 World Cup.
U20 World Cup analysis
The first part of the analysis will cover the 2009, 2011 and 2013 U20 World Cup finalists. The teams who made it to those finals were France (2013), Brazil (2009, 2011), Ghana (2009), Portugal (2011) and Uruguay (2013). A total of 70 players in those teams played more than 315 minutes in the tournament and will be included in our analysis.
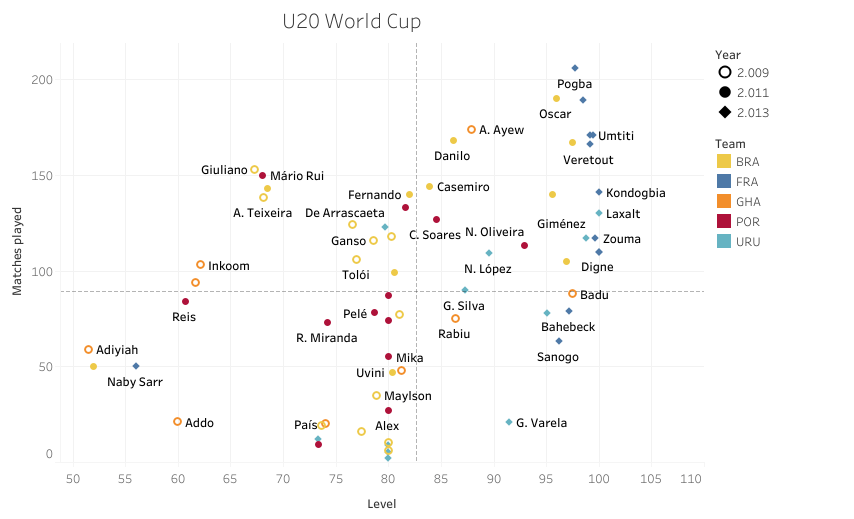
The chart shows that U20 World Cup finalists tend to concentrate in two groups. On the top-right side, the 22 players who are above average in quantity (more than 89 matches played) and quality (score higher than 82.59 – above Level 2) of matches played. On the bottom-left side, the 28 players who are below average in both. Those two groups constitute 71.4% of the total, showing how polarized the data is. While almost one-third of the players become regular elite players in the next five seasons after the U20 World Cup, 40% of them don’t explode and continue their career outside the top-level competitions.
An important aspect is the players who don’t appear in the chart. Two players from Ghana 2009 (Danie Agyei and Ransford Osei) and one from Brazil 2009 (Wellington Junior) never made an appearance in the leagues we considered and thus they don’t appear in the chart. This is far more frequent in the U17 World Cup as we will see later, and shows how being an important part of a winning youth team doesn’t automatically give you a career in elite football.
The 2013 edition winners, France U20, are the team with the best development in the next five seasons. Their 12 players with more than 315 minutes in the 2013 U20 World Cup averaged 26.2 elite games per season in the next five seasons, and their level was of 95.3, meaning most of them played in top competitions most of the time. This generation included Pogba (206 games, 97.77 level score), Samuel Umtiti (171 games, 99.18 level score) and Florian Thauvin (189 games, 98.52 level score).
Only three of the 12 players with more than 315 minutes in the competition (Naby Sarr, Yaya Sanogo and Jean-Christophe Bahebeck) played less than 100 elite matches in the next five seasons. Of those three, only Sarr did it in below-average competitions, with a level score of just 56, which is just below Level 3 on average.
On the opposite side, Ghana 2009 team failed to produce top players despite winning the competition. Only André Ayew played consistently in top levels (174 matches, 87.93 level score). The other two players we could highlight are Emmanuel Badu, who played 88 matches at a good level in the Serie A with Udinese, and Mohammed Rabiu, who played a good number of matches in Ligue 1 for Évian.
The runner-ups of the 2011 and 2013 editions, Portugal and Uruguay, show two versions of a similar story. Portugal is the team who’s closest to the average in both metrics. Their players played an average of 84.16 matches in the next five seasons, and their level was 77.85, which is logical having in mind the Portuguese league level is 80 in our calculations. Only four of their players played more than 90 matches – Mário Rui, Danilo Pereira, Cédric Soares and Nélson Oliveira – and only Soares and Oliveria did it at an above-average level.
Uruguay is the other part of the story. Their team was better than average in the level they went to play in (86.84) but the number of elite matches was low (63.27 on average). This is explained because we didn’t count Uruguayan league in our levels due to its low standard, so for those who stayed at their home country, only the international competitions were counted. Uruguay still managed to produce some top talents, with four players being above average in both metrics: Diego Laxalt, José María Giménez, Nico López and Gastón Silva.
Last but not least, Brazil is the country which better reflects the different outcomes of winning generations. First, they have two different squads (2009 and 2011) included in the study and if we counted the averages of both teams together they would be very close to those of the whole sample (96.3 matches and 76.6 level score), but it’s best to analyze both teams separately as they are almost opposite. In the chart below, Brazil 2009 is yellow and Brazil 2011 is green.
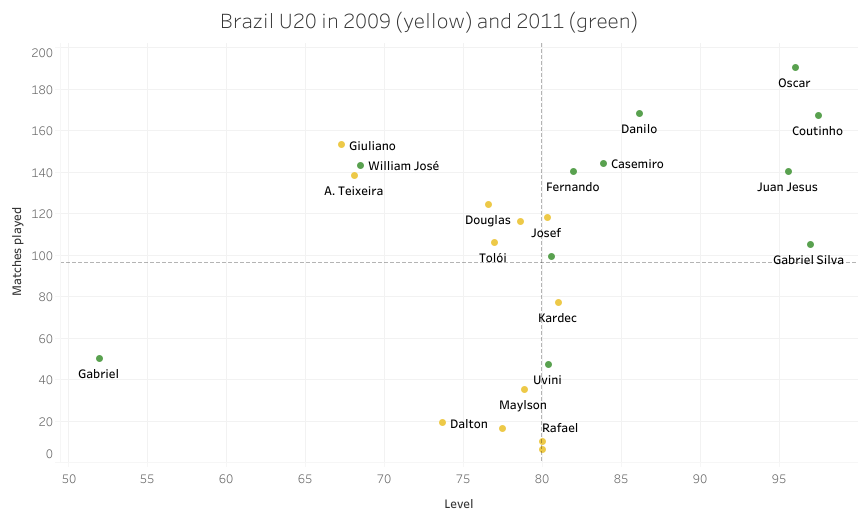
Brazil finished second in the 2009 U20 World Cup, and none of their players had a great development in the successive five years. Giuliano and Alex Teixeira did play a lot of matches (153 and 138) but in low-level leagues, mostly in Ukraine. Others like Josef, Ganso, Douglas or Tóloi had a good run at a decent level (mostly Brazilian league) but couldn’t make it at the highest level. And the rest of the players struggled to find playing time even in their own country, ending up in the lower leagues in some cases.
But two years later, the story was completely different. In 2011, Brazil won the U20 World Cup and that generation did achieve great things in the next five seasons. Up to six players were above average in matches played and level in the next five seasons: Oscar, Coutinho, Juan Jesus, Danilo, Gabriel Silva and Casemiro. Willian José also played a good number of matches but mostly in Spanish second division, so the level was not that high. Uvini and Gabriel were the only disappointments in this great generation, but anyway they played around 50 matches in the next five seasons at a middle-low level.
The Brazil example is good to see how the country is not decisive in the future of the players. Two different teams only two years apart had almost opposite outcomes, with the 2009 generation staying mostly in their home country and not making it to the European elite and the 2011 generation becoming one of the best in the recent editions of the U20 World Cup.
U17 World Cup analysis
In this second part of the analysis, we will cover the 2009, 2011 and 2013 U17 World Cup finals. The teams who made it to those finals were Switzerland (2009), Nigeria (2009, 2013), Uruguay (2011), Mexico (2011, 2013). A total of 66 players in those teams played more than 315 minutes in the tournament and will be included in our analysis.
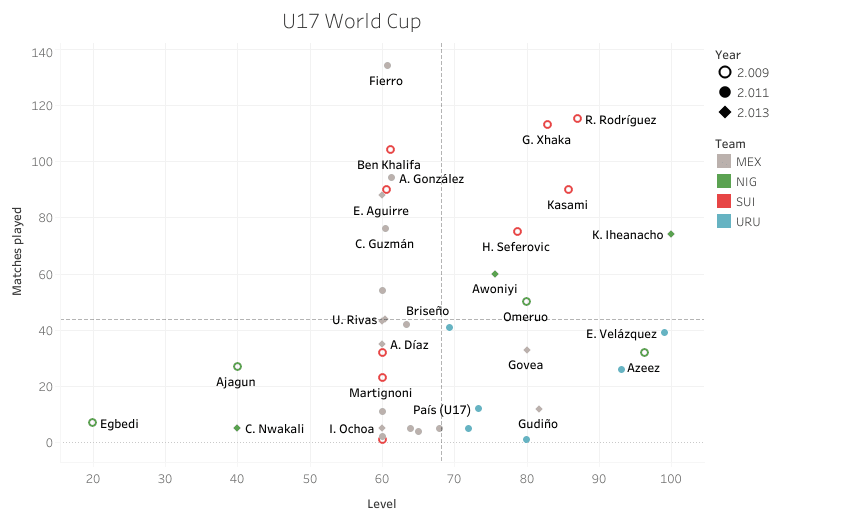
As we did for the U20 World Cup, first we will talk about those players not included in the chart. 27 out of the 66 players (41%) didn’t play a single match in the competitions we considered in the next five seasons after the U17 World Cup. While it’s normal they don’t play a lot given their age, the number of top U17 talents who don’t make it at least to the middle-level leagues is amazingly high.
The smaller number of players in this chart lets us see some interesting facts more directly. First, there’s a lot of concentration of players who appeared in matches with a level of around 60 (Level 3 in our classification). That’s explained by the fact that both Mexican and Swiss leagues are in that level, and both countries have representation in this analysis.
Other clear evidence is the difference in representation between countries. As we said before, the players who haven’t made a single appearance at the five levels we are considering are not represented in the chart as we don’t consider them to have had a proper elite career after the World Cup. Mexico has five of these players (one in 2011 and four in 2013), Nigeria has 15 (seven in 2009 and eight in 2013), Switzerland has three, and Uruguay has four.
We suggest some explanation for Nigeria’s lack of development. First, their national league is not considered in our analysis, so that’s a disadvantage; anyway, most top African players leave their country very early in their careers, so by the age of 22/23 they should have already had some experience at a higher level. Second, African teams have usually shown earlier physical development, which is very important at younger ages. In fact, 18 African teams have reached the U20 and U17 World Cup finals, but they never translated that dominance to the senior World Cup. This physical advantage fades away with age and it’s more difficult to get into elite teams based only on it.
From the analyzed finalists, Switzerland is the clear winner in terms of development. After winning the 2009 U17 World Cup, four Swiss players played in a level much higher than the Swiss league, and they did it consistently, with more than 75 games each in the next five seasons. In those seasons, Granit Xhaka played European competitions with Basel before moving to Borussia Mönchengladbach in 2012; Ricardo Rodríguez also moved to the Bundesliga, joining Wolfsburg from Zürich; Pajtim Kasami moved from Bellinzona to play for Palermo, Fulham and Luzern; and Haris Seferovic moved from Grasshopper and played for Fiorentina, Xamax, Lecce, Novara and Real Sociedad. The rest of the squad enjoyed different levels of success in the Swiss league.
Nigeria, on its side, is a country of extremes regarding player development. We saw they lead in terms of players who didn’t make it to the elite, but they also have four players between the best of our chart. Kelechi Iheanacho, part of the 2013 winning squad, is the player who has played at the highest level in our analysis, and he has appeared at the highest level with Manchester City and Leicester City. Taiwo Awoniyi, also part of the 2013 team, moved to Liverpool in 2015 and has enjoyed playing time in several loans since then. From the 2009 generation, Kenneth Omreuo reached a good level after joining Chelsea, and Ramon Azeez has been building a decent career in Spain.
Uruguay, second in 2011, is also a curious case. Only ten of their players played the required 315 minutes to be in this analysis, and they can be divided into two very different groups. Four of them don’t even appear in the chart, while the other six have appeared in few matches but at a good level. Emiliano Velázquez was their best player in terms of development, and he joined Atlético de Madrid from Danubio to be loaned to Getafe. Gastón Silva, who was also part of the U20 squad later, enjoyed some playing time in Italy with Torino too. Uruguayan league is not considered in this analysis, so it explains the lack of a middle group between these two.
Conclusion
As we have seen in this analysis, making it from the best youth teams in the world to the professional game is not an easy task. Those who want to recruit from the U17 and U20 World Cups need to have this in mind when evaluating these competitions, as the best players in won’t necessarily be the best ones in the future. The adaptability to the professional game needs to be considered and some characteristics are more important than others when making the step. Also, players who reach these stages, especially in the U17 World Cup, should be treated as the young kids they are and not pressed to succeed, as we have seen lots of them can’t make it to the top after winning a World Cup medal.


Comments