This data analysis article will attempt to assess the impact of FAWSL players on assisting goal scoring opportunities. By analyzing the data of individual players expected assists (xA) and comparing the results to their team’s expected goals (xG), the twelve players who are having the greatest impact upon creating goal scoring chances during the 2019/20 season, within their own team will be identified. Further analysis will then be generated through an individual scouting report on Guro Reiten and her impact both within the FAWSL 2019/20 season thus far and within a tactical analysis of the Chelsea FC Women’s team.
How do teams create chances?
What makes the game exciting to watch and challenging to play/coach is that teams have a variety of tactics they can implement in all phases of the game in order to gain a competitive advantage over the opponent. The approach each team takes can be determined by a combination of the managers preference, the players available, the history & culture of the team/club/country and the league which the team competes for example.
Teams can focus on attacking during transitional moments and implement a quick counter attacking style, or adopt a more patient build up approach to creating chances. Teams can implement a high percentage of longer or more direct passes when attacking or a higher percentage of shorter passes, identifying or creating opportunities to attack the opposition.
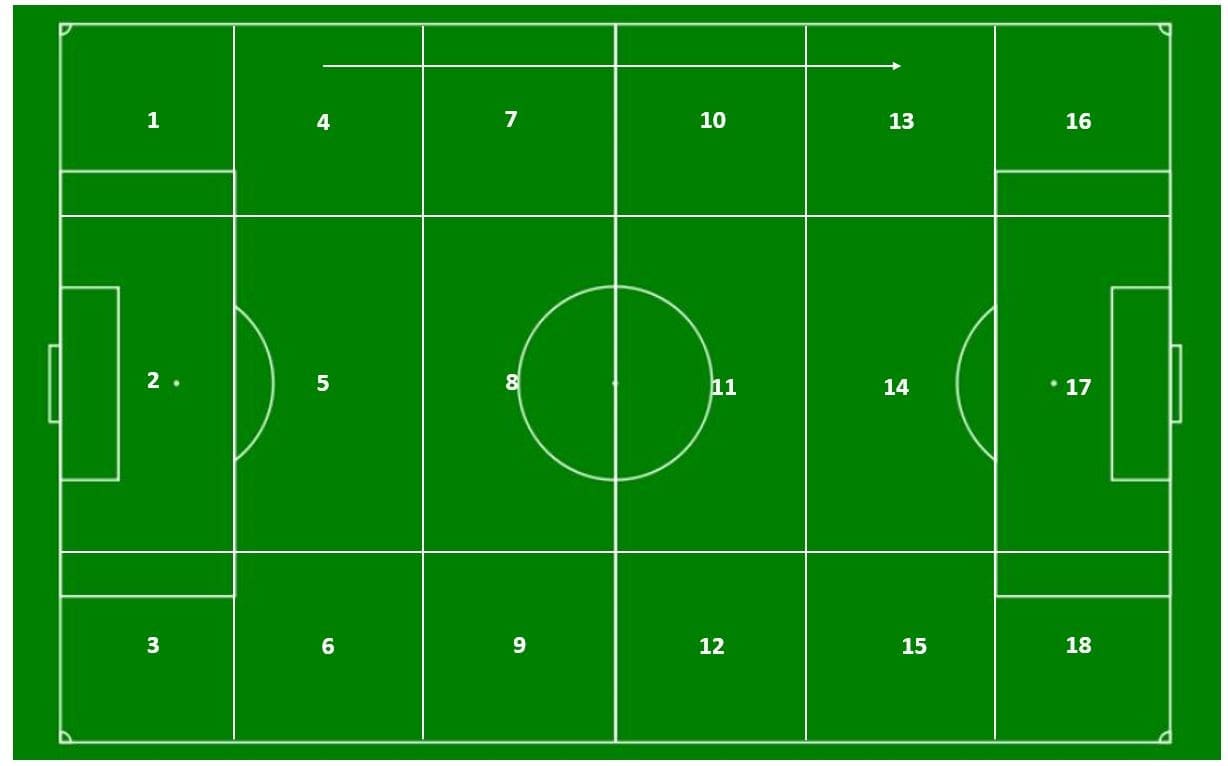
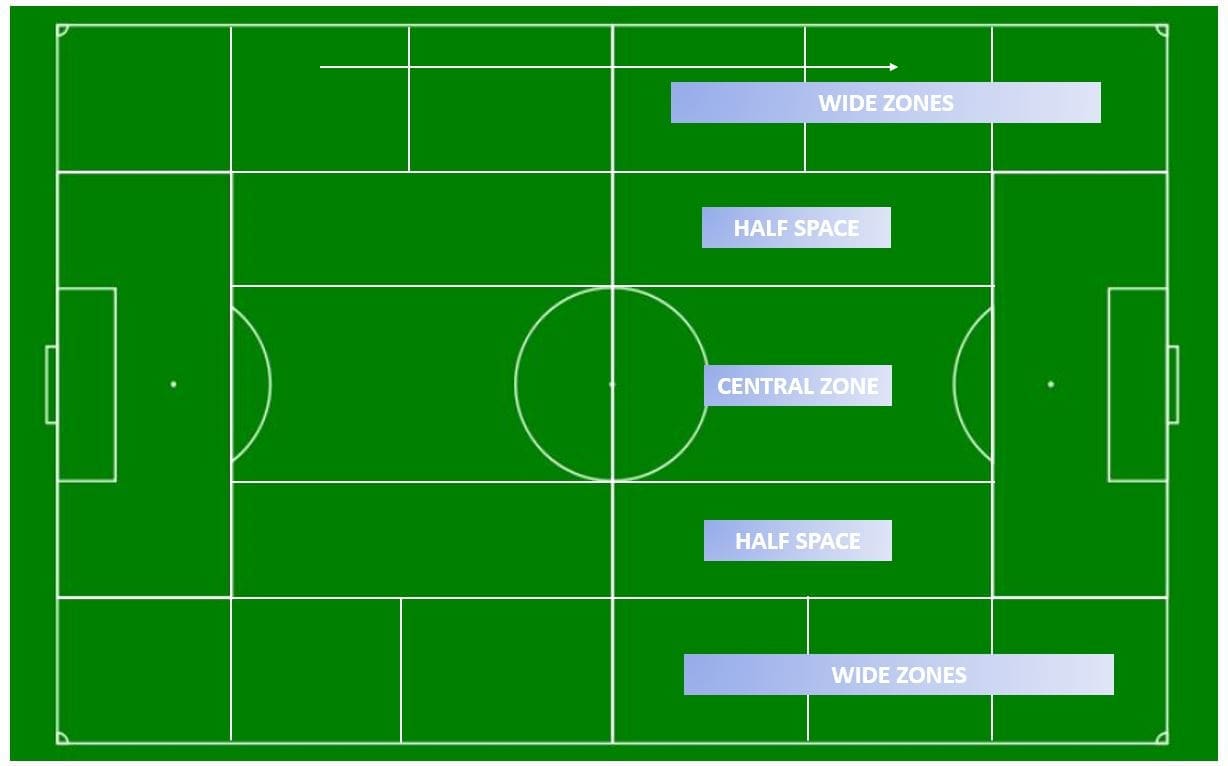
Options into the final third could emphasize attacking in the outside channels using wide players either individually 1v1 attacking on the dribble or looking to create combinational shorter passing opportunities before crossing/passing into the penalty area. Depending on how a field can be split up (multiple options), this refers to zones 13, 15, 16 or 18 in Fig 1 (18 zones of soccer field) or the ‘wide zones’ in Fig 2 (Pep Guardiola’s positional play markings) , which has split zones based upon the positional play of Pep Guardiola and corresponding specific field markings.
Alternatively, teams can attack more centrally using through balls, combinations or individual dribbling. This would be zone 14 in Fig 1 or the half spaces and central zone in Fig 2.
As well as the tactics utilized by teams, a variety of different systems can be implemented which will impact the type and the location of chances created. For example, a 1-4-4-2 with a diamond midfield, may look to attack centrally using numerical superiority in the central zones, or a 1-4-3-3- with outside wide wingers, may look to attack with width, qualitative superiority and create crossing opportunities. All systems of play must be understood and observed within the context of the team’s tactics and principles of play (game model). The system, tactics and specifically how each team utilizes possession will contribute to which players & why, are the impact players in assisting goal scoring opportunities on any team.
Initial data check
For this data analysis article, all players who have provided an assist in the 2019/20 FAWSL season have been included for analysis. This is a total of 76 players ranging from 8 total assists during the 2019/20 season (Vivianne Miedema, Arsenal WFC & Janine Beckie, Manchester City WFC) to 34 players who have assisted in one goal during the season.
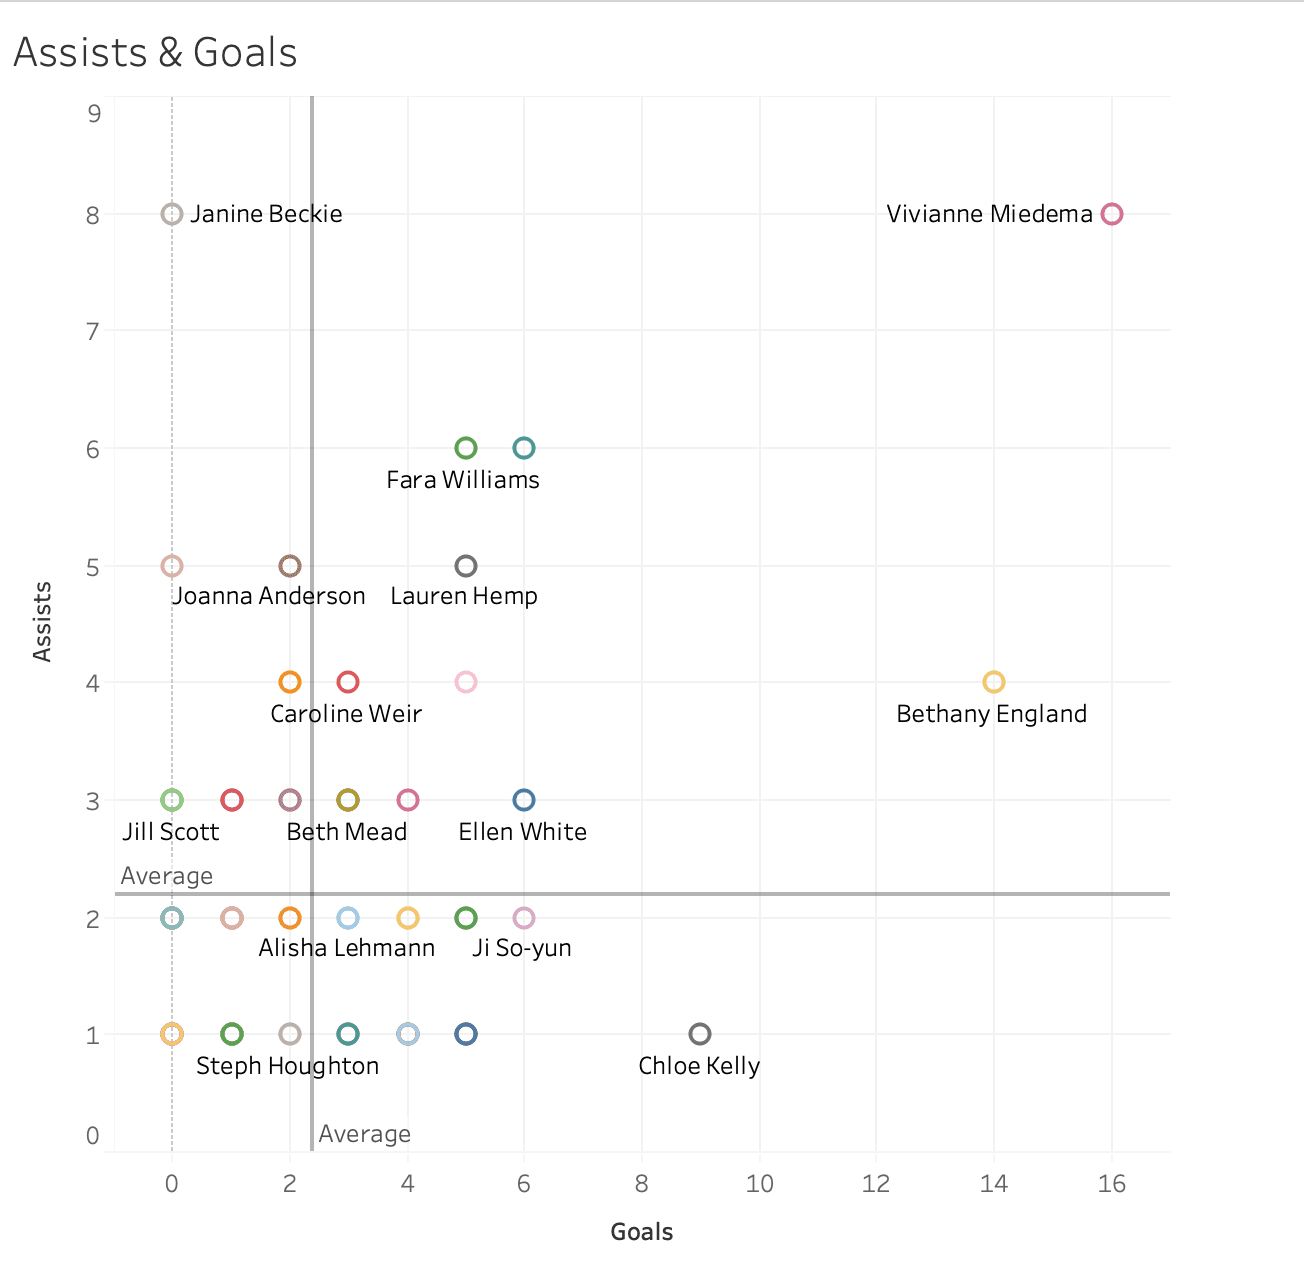
The first scatter plot shown above makes a comparison between the total number of assists and the total number of goals each player has contributed during the season. With a total of 16 goals scored plus 8 goals assisted, Vivianne Miedema is clearly a long way ahead of the remaining players. However, this comparison demonstrates only how impactful the players are within the FAWSL (goals + assists). It does not help identify how impactful each player has been within their own team. Also, as many players have either ≤2 goals or ≤2 assists, the graph is difficult to differentiate players.
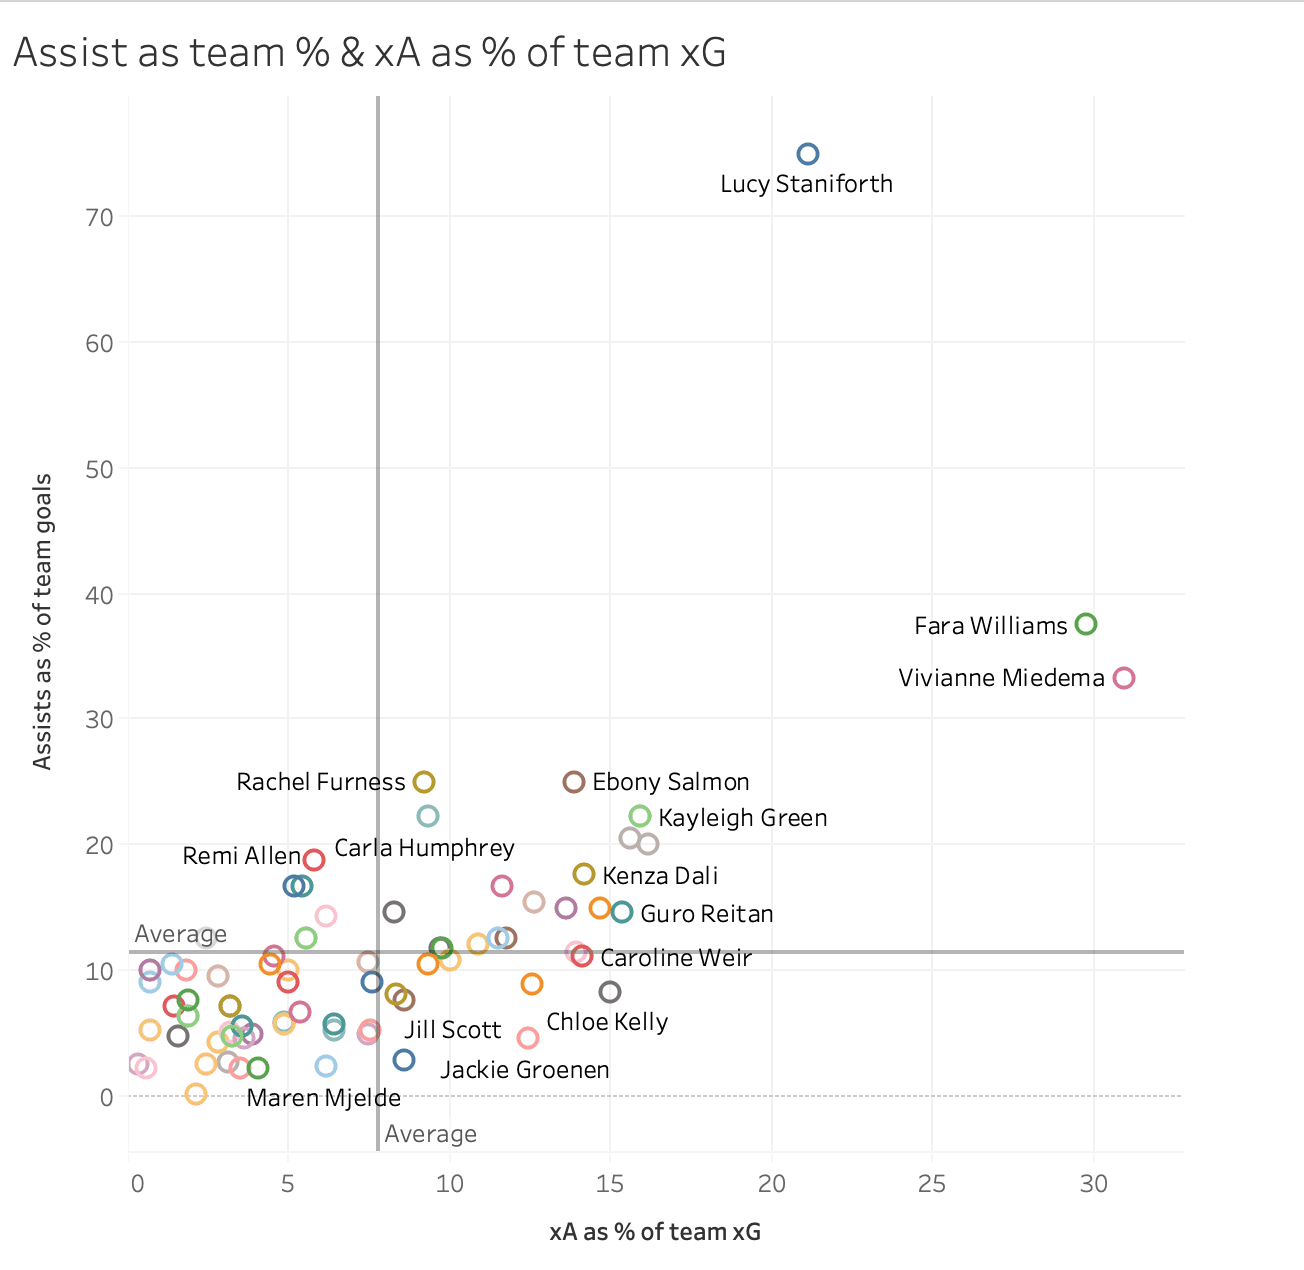
The second scatter plot within the initial data check, shown above, compares two specific metrics:
- The number of assists of individual player as a percentage of the total amount of their team’s goals.
- The expected assists (xA) of individual player as a percentage of the total amount of their teams xG.
Expected assists (xA) has been defined by Opta as measuring “the likelihood that a given pass will become a goal assist” It takes into consideration the type of pass, the pass end point and the length of pass. Adding up the players xA gives an indication of how many assists the player should have had regardless of the outcome of the shot.
Expected goals (xG) has been defined by Opta as measuring “the quality of a shot based on several variables such as assist type, shot angle and distance from goal, whether it was a headed shot and whether it was defined as a big chance”. Adding up the total xG gives an indication of how many goals a team or player should have scored on average given the quantity and quality of shots.
In order to calculate the percentage contributions of assists it is important to subtract the amount of goals that the individual player scored. This is because the player cannot contribute an assist on a goal, they ultimate score.
Using Bethany England as a specific example of this. For Chelsea, she has assisted 4 goals from a total of 47 goals. If we did not subtract her goals from the equation, she contributes to only 8.51% of the goals with the assist. By subtracting her goals (14) from the total number of Chelsea goals as she cannot have assisted these, her percentage contribution moves to 12.12%.
Here is the simple equation for calculating the assists as a percentage of team goals:
(Number of individual assists) / (Number of team goals-number of individual goals) x 100
Calculated for Bethany England:
4/(47-14) x 100=12.12%
Similarly, to the above, in order to calculate the expected assists (xA) as a percentage of the total amount of their teams expected goals (xG) it is important to subtract the amount of the individual players xG from the total for the team. This is because, again, the individual player cannot provide an expected assist on their own expected goal. Using Bethany England as an example again, she has an expected assist (xA) score of 2.8 for the season. If we calculated this as a percentage of Chelsea’s total xG (38.1), her expected assist contribution is 7.35%. By subtracting her xG from the total amount of Chelsea, she contributes 10.85%.
Here is the simple equation for calculating the xA as a percentage of the team xG:
(Individual players xA)/(Team xG-individual players xG) x100
Calculated for Bethany England:
2.8/(38.1-12.3) x100=10.85
As demonstrated by the scatter plot (Fig 4), Vivianne Miedema is currently performing at a very high level for her team, Arsenal. Also, Fara Williams can be observed as integral to the attacking play of Reading. Ebony Salmon of Bristol City and Kayleigh Green of Brighton, to a lesser extent, but still impactful, can be observed through the result of the scatter plot. An ‘outlier’, Lucy Staniforth, of Birmingham City will be discussed later in the article.
Teams highest percentage contributors
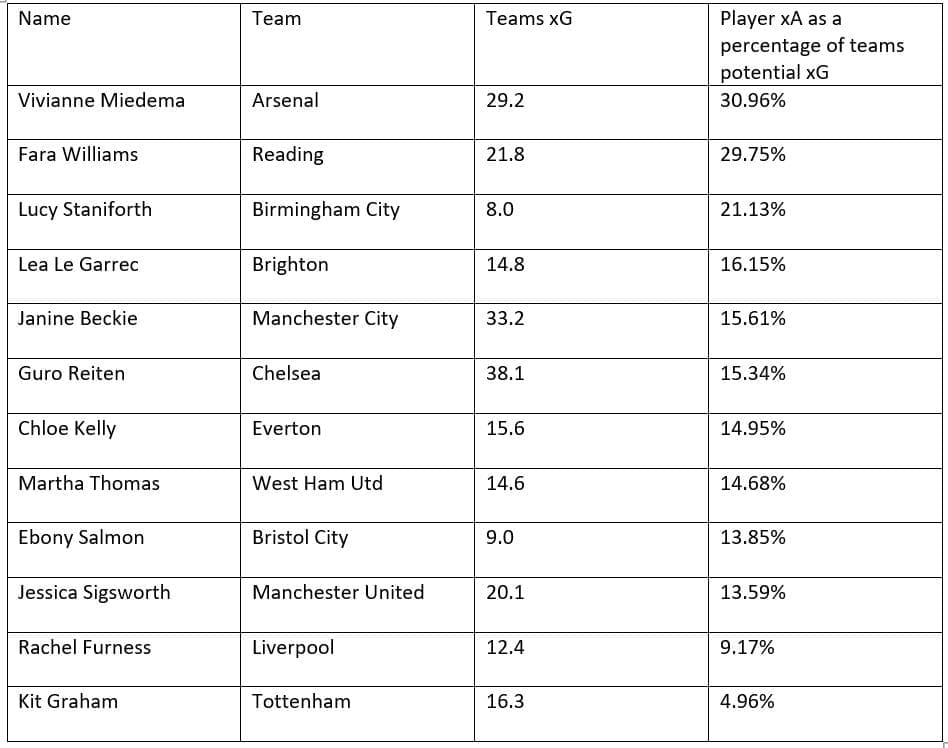
By analyzing the data and utilizing the previous equations, the following players have been identified as contributing to the highest percentage xA in relation to their teams total xG.
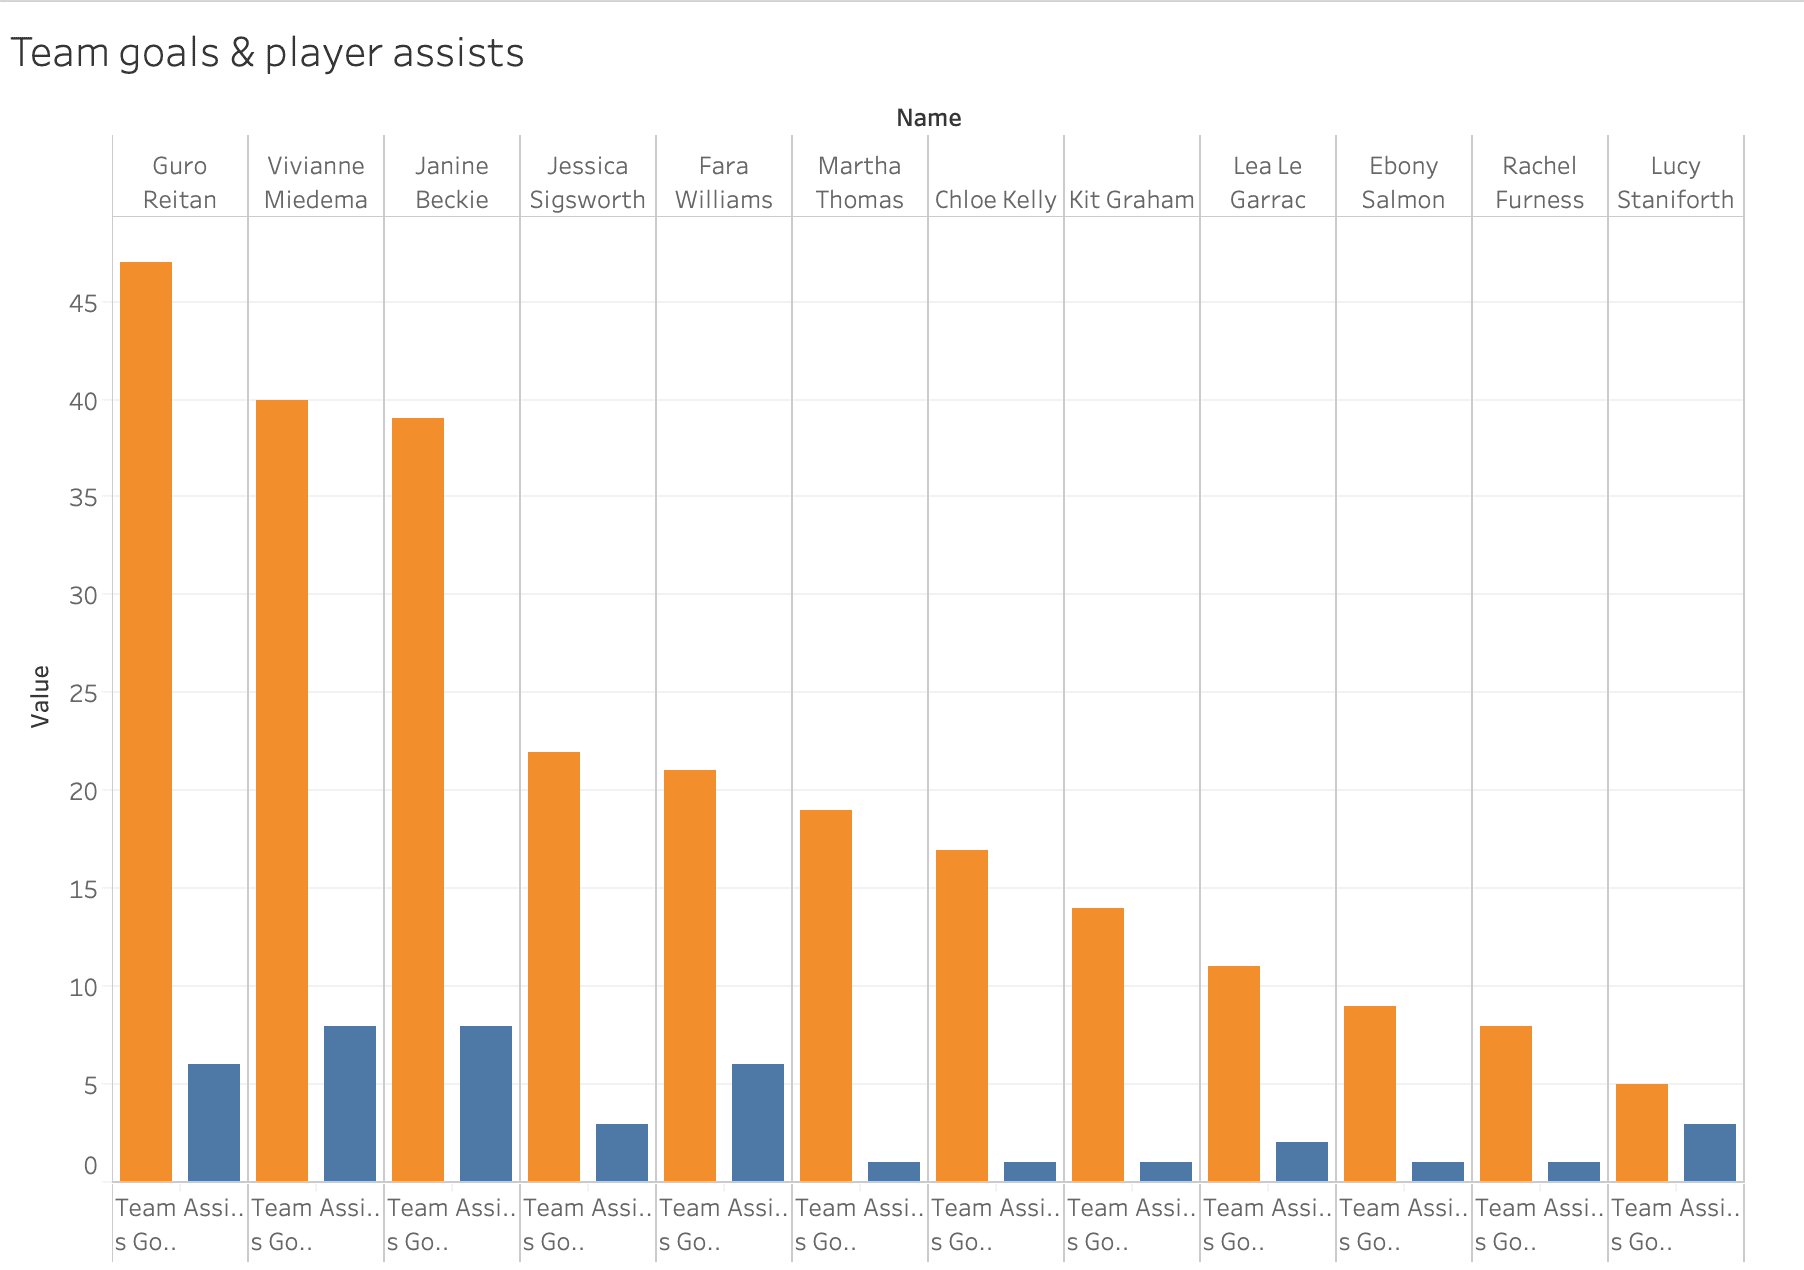
The grouped bar chart above, demonstrates team goals (orange) and individual player assists (blue). This will help identify why Lucy Staniforth of Birmingham City is shown as an outlier on the second scatter graph earlier (Fig 4 assist as a team % and xA as a % of teams xG).
The grouped bar chart demonstrates that although Lucy Staniforth has assisted a high percentage of Birmingham’s goals (75 % of the potential goals she could have scored) and a high xA as a percentage of potential teams xG (21.1%), her sample size is extremely small. Birmingham have scored only 5 goals total during the 2019/20 FAWSL season. In comparison, the same sample size of Guro Reiten, Vivianne Miedema and Janine Beckie are above 35 team goals.
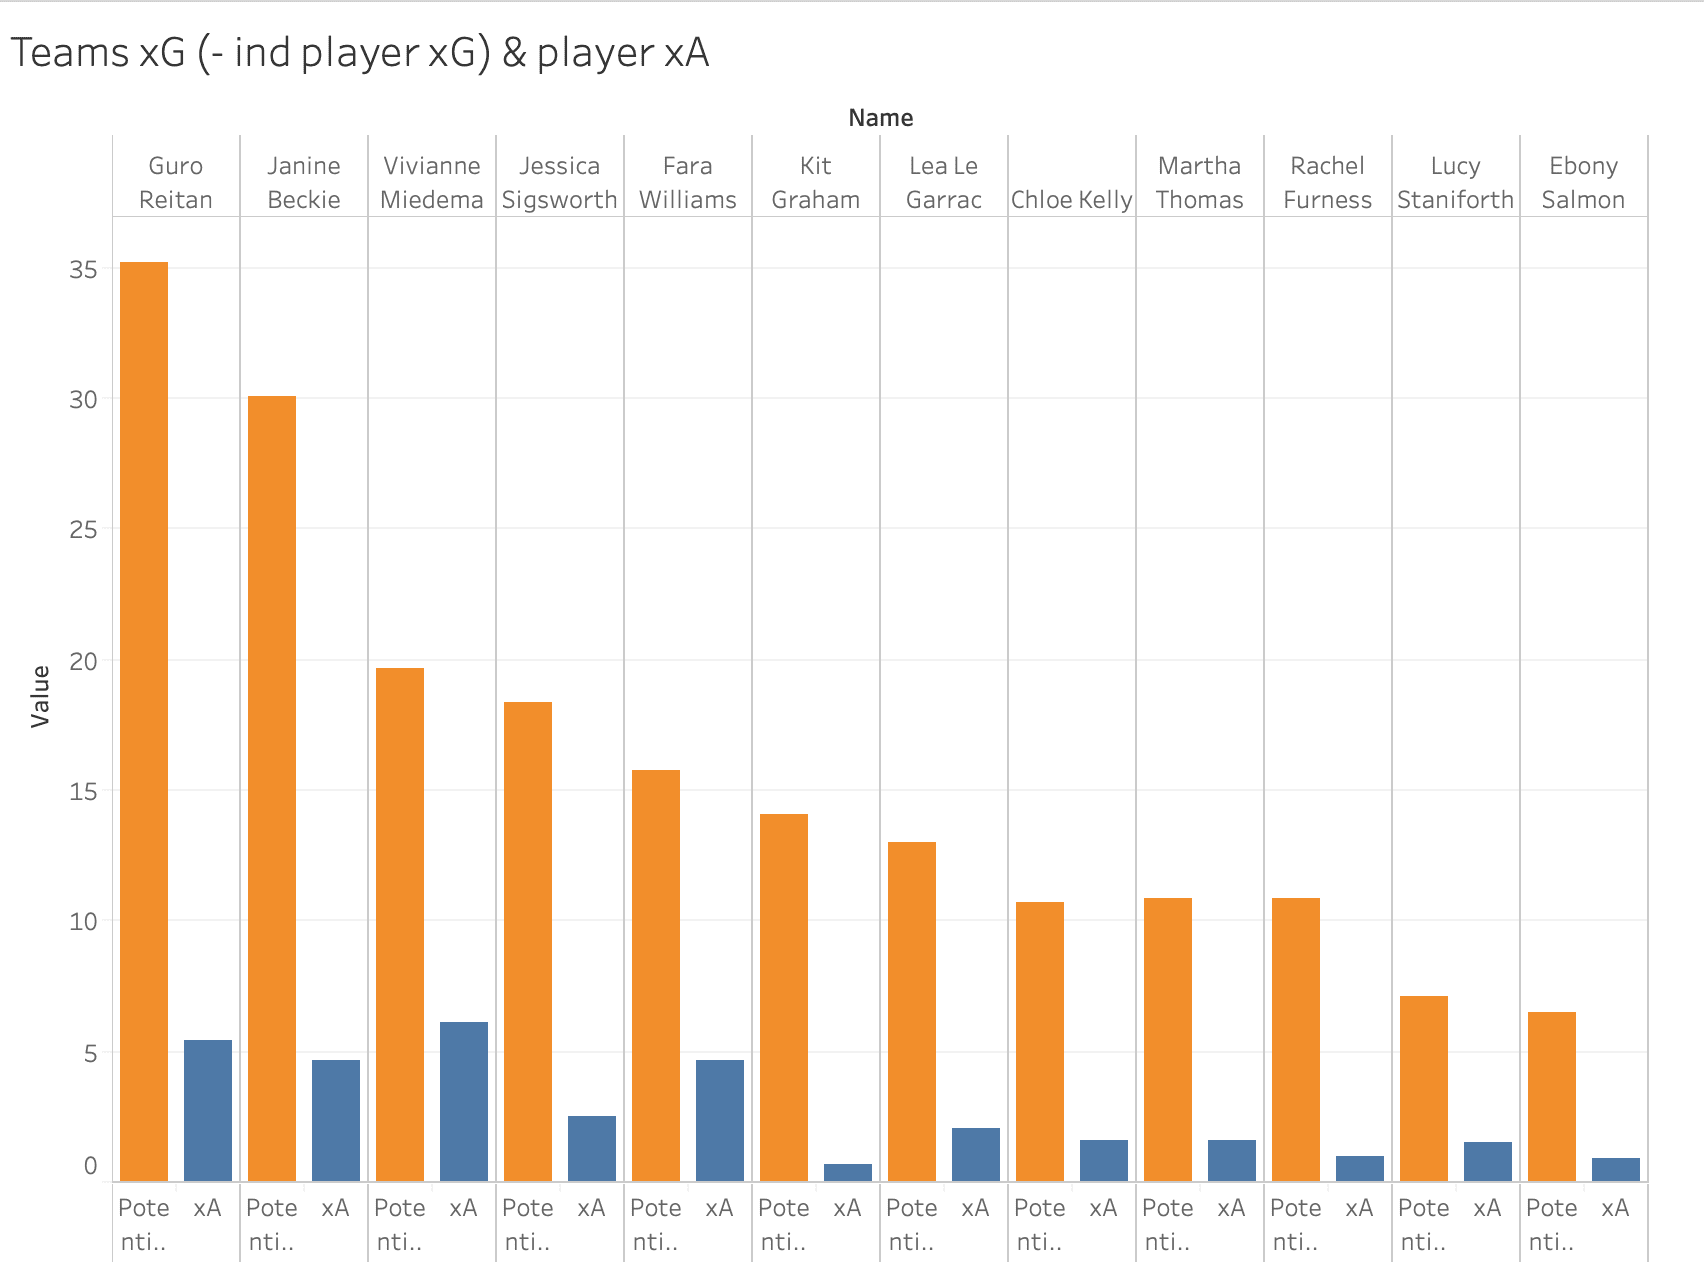
The second grouped bar graph (teams xG (-ind player xG) & player xA) again shows the low sample size of Lucy Staniforth with the potential xG to create chances from at 7.1. Ebony Salmon of Bristol City has an even lower potential xG to create chances from of 6.5. The three teams with the highest potential xG to create chances from are Chelsea, Arsenal and Manchester City. The grouped bar graph gives context the percentage results matched up with the actual sample size. The highest scoring players, regardless of how their team is performing are Vivianne Miedema, Guro Reiten, Fara Williams and Janine Beckie.
These scores are linked to the beginning of the article which highlighted the role each teams’ tactics and systems of play contribute to which players impact in assisting goal scoring opportunities. The next section will look at a specific player, Guro Reiten and how her own individual style of play and that of Chelsea influences the high statistical results for her.
Guro Reiten was selected for further individual analysis as Chelsea have the 2019/20 FAWSL highest total amount of goals scored (47), highest xG (38.1), highest total number of assists (32) and the highest xA (27.3) of all 12 teams. From the previous analysis, Guro Reiten has contributed the highest xA as a percentage of the potential teams xG to assist (15.34%) from all rostered Chelsea players.
Guro Reiten comparison within the FAWSL
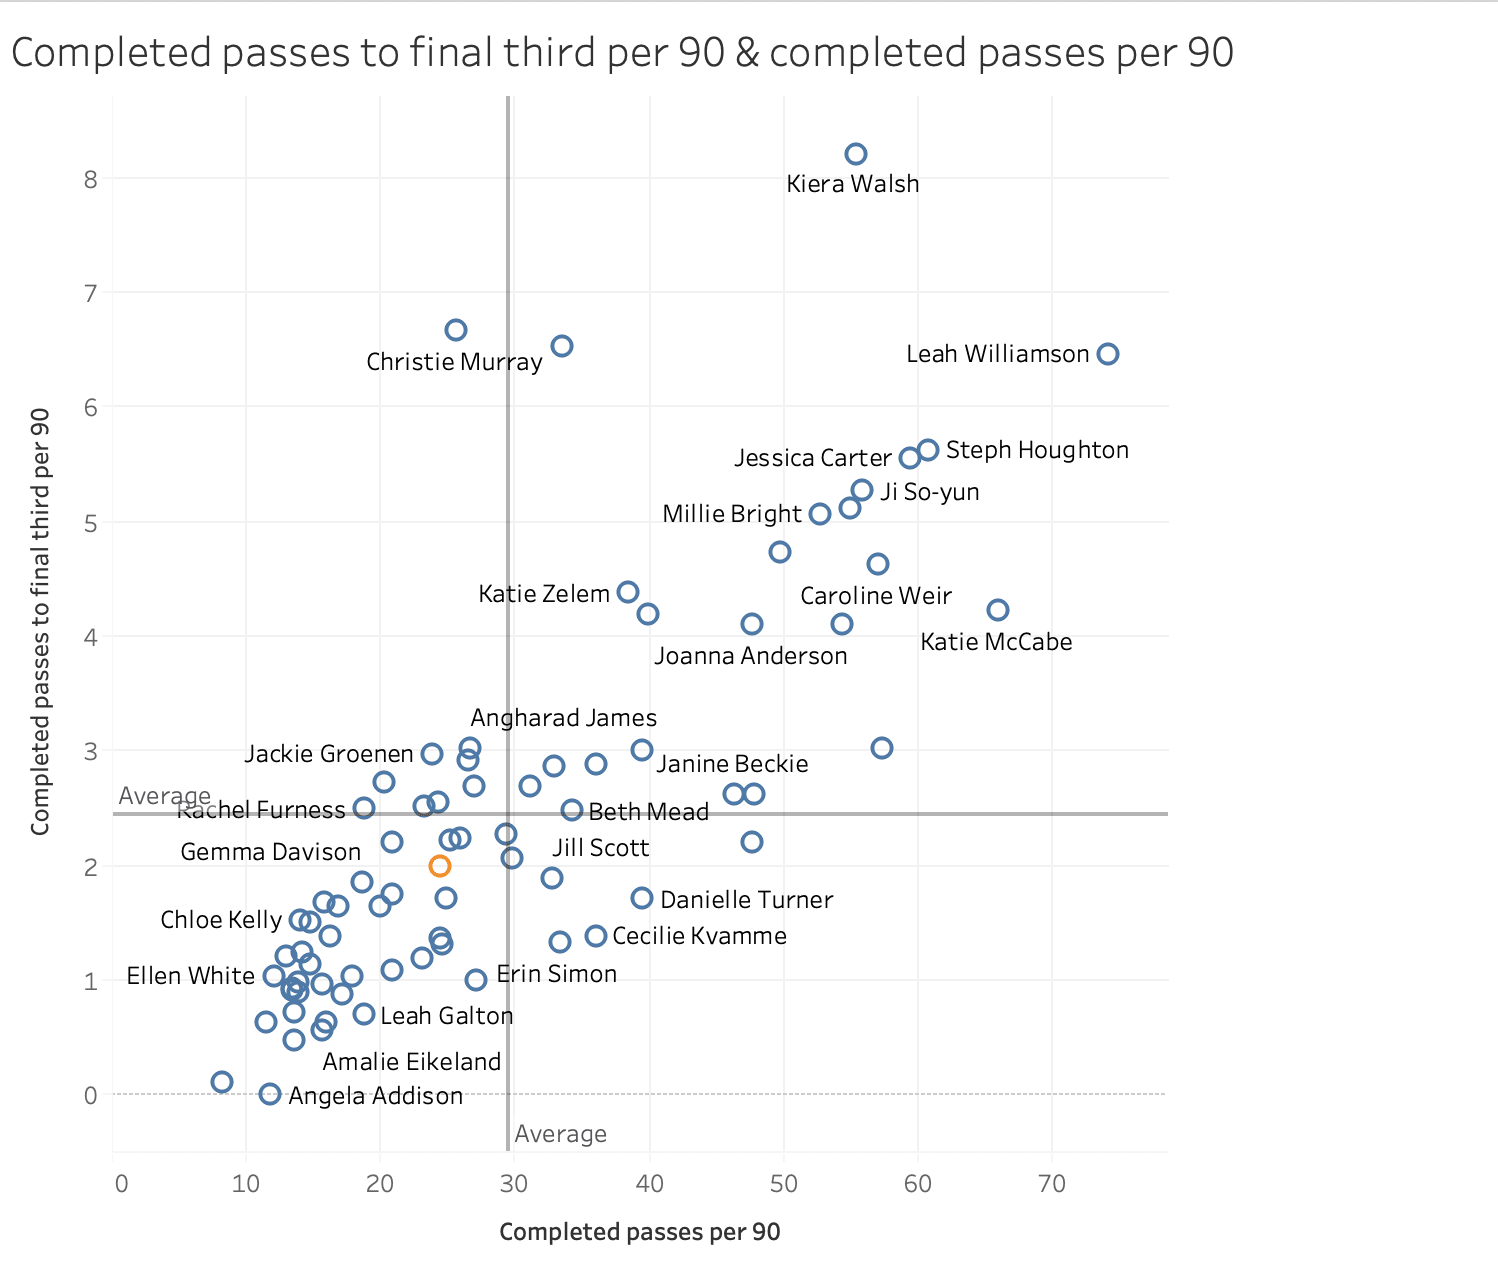
The first scatter plot of the data analysis of Guro Reiten is a comparison against all 76 players with an assist during the 2019/20 FAWSL season and included in the initial data check at the beginning of the article. The comparison is between the number of completed passes per 90 minutes and the number of completed passes to the final third per 90 minutes. Guro Reiten (highlighted in orange) scores below average in both categories in the comparison. However, both metrics do not distinguish between the players average position on the field and the role within their team’s tactics and system.
Defenders and defensive midfielders traditionally have a higher total number of passes completed, due to lower pressure being applied by the opposition and the attacking teams looking to attack from the defensive third with numerical superiority in the first phase of the attack. The top 6 ranked players are all defenders/defensive midfielders. They are Leah Williamson, Katie McCabe, Steph Houghton, Jessica Carter, Leonine Maier and Caroline Weir.
The highest scoring attacking midfielder or forward is Ji So-yun (of Chelsea WFC) with 55.9 completed passes per 90 minutes. Interestingly, and as a side note, of players who have assisted at least one goal this season, of the highest number of passes completed per 90 minutes, 7 of the top 14 ranked players are from Arsenal. Guro Reiten is ranked 40th on this metric.
Also, attacking players are more likely to be spaced/positioned and look to be receiving the ball into the final third (as opposed to passing into the final third), therefore they are likely to have lower number of completed passes into the final third. Guro Reiten is ranked 39th on this specific metric.
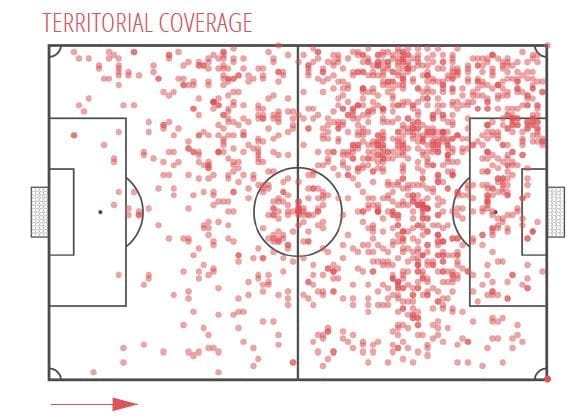
The territorial coverage map reiterates this with the majority of Reiten’s actions occurring in the left-hand side of the field in the middle to attacking thirds of the field. Reiten’s main position for Chelsea WFC is a left winger in a 1-4-4-2 system. To a lesser extent, but on occasions she has also played as the second striker within Chelsea’s system which accounts for a percentage of the central actions.
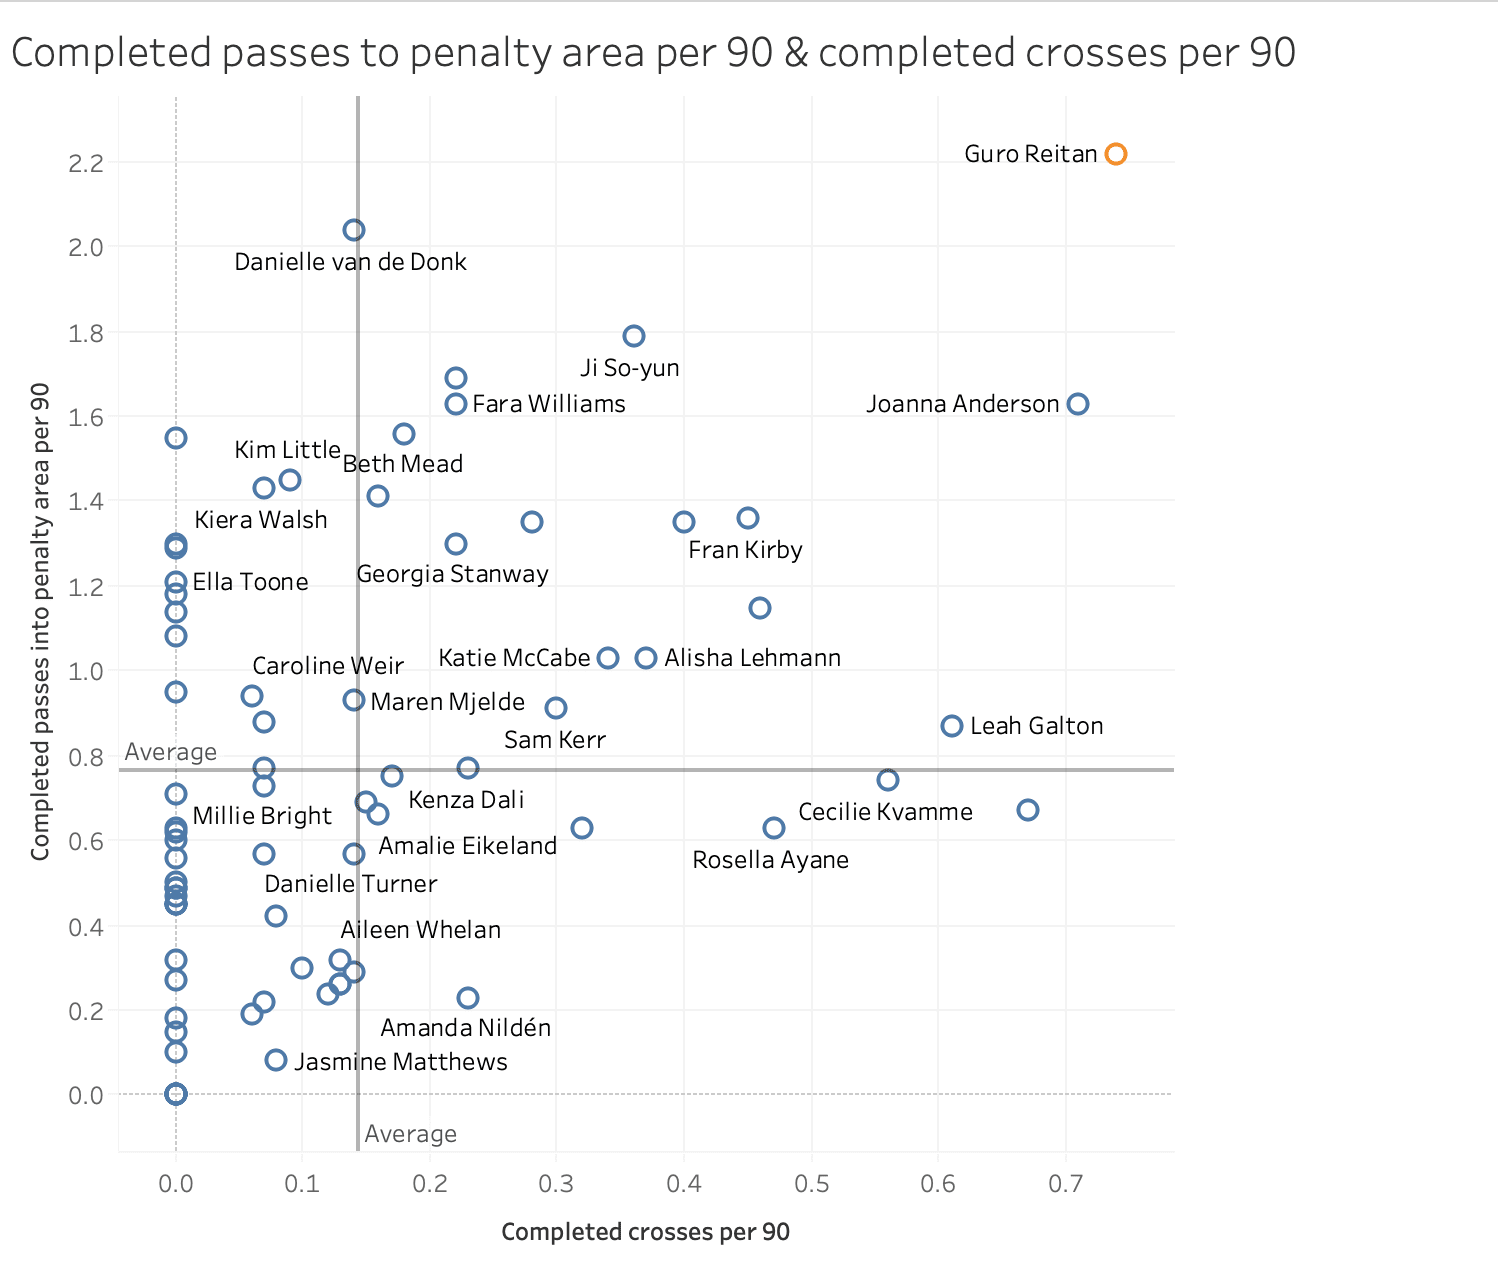
The second scatter plot (Fig 9) of the data analysis of Guro Reiten, shown above, is a better indication of why she is the highest impact chance creator for Chelsea. This scatter plot compares the number of completed passes into the penalty area per 90 minutes and the number of completed crosses per 90. She is highlighted in orange and is clearly considerably above the average in both categories. In fact, she is ranked 1st in both the number of completed passes into the penalty area (2.22) and the number of completed crosses into the penalty area per 90 (0.5).
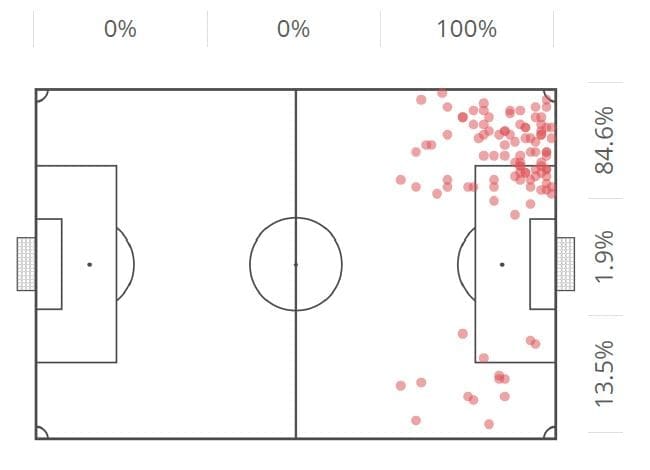
The pitch distribution (Fig 10) shows the location of Reiten’s crosses from the previous four games, with all occurring in the attacking third of the field and 84.6 % on the left-hand side. Reiten has several crosses from inside the penalty area, a very positive (& higher % conversion) zone to deliver a cross from. The emphasis that Chelsea place on crossing will be discussed later in the article.
Guro Reiten Comparison within the Chelsea team
The data analysis of Guro Reiten will now move into specific comparisons within the Chelsea team and how this relates to the style of play and tactics implemented by Emma Hayes and the players.
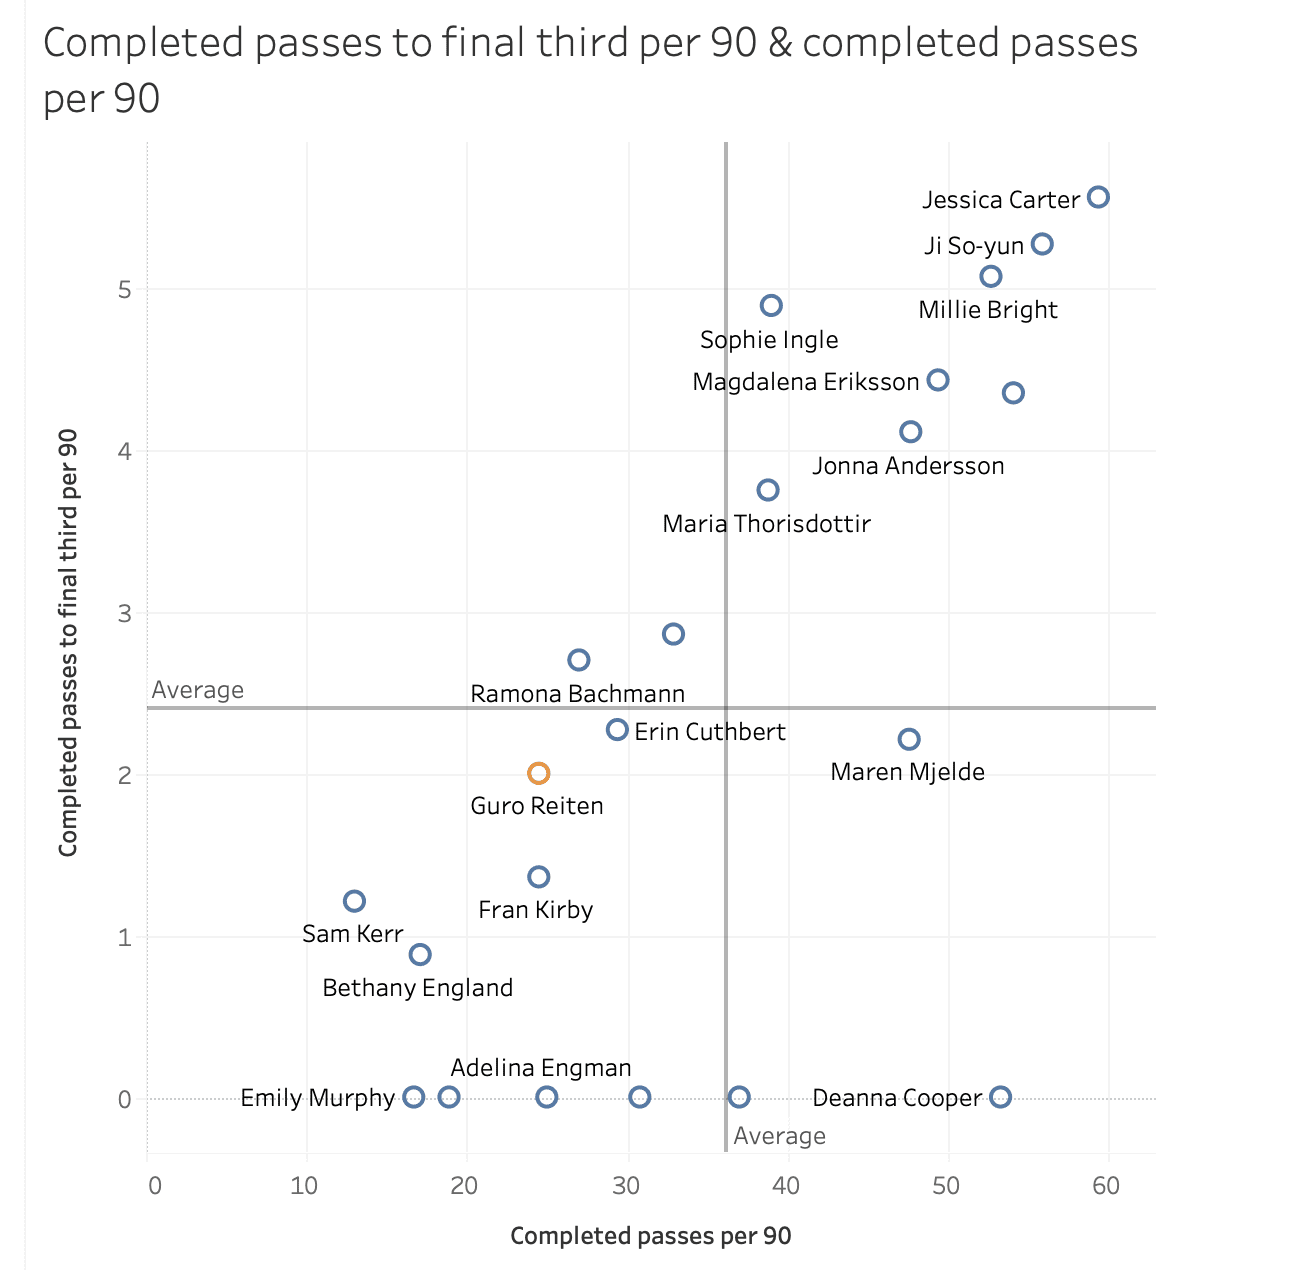
The above scatter plot compares the number of completed passes to the final third with the total number of completed passes. As was evident in the Reiten comparison with all the players in the larger analysis group, she falls below average in both categories. As also discussed previously, this is related to player position in the field and the team’s overall style of play.
With the majority of Reiten’s actions occurring in the attacking third of the field, it is unlikely that she will have a high number of completed passes into the final third. Also due to the location of actions, the opposition are likely to be implementing high pressure, thus limiting the total amount of passes Reiten completes each game. Chelsea rank 6th in number of completed short passes (fewer than 5 yards), 3rd in number of completed medium passes (between 5 and 25 yards) and 3rd in the number of completed long passes (greater than 25 yards).
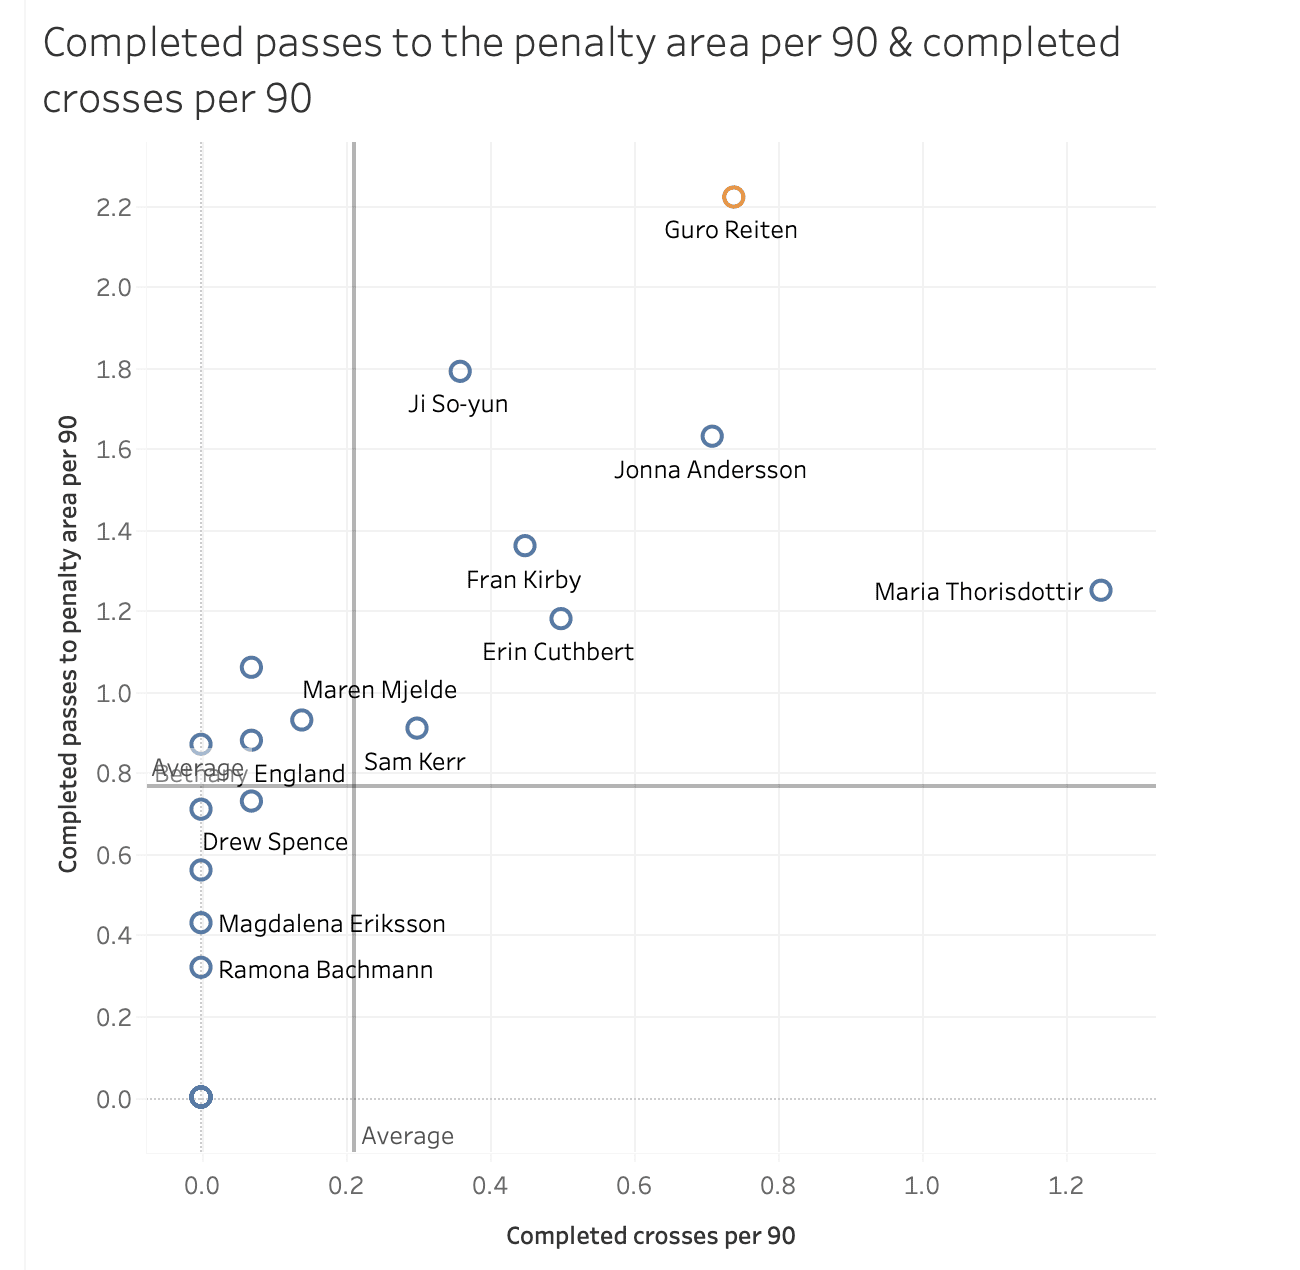
The second scatter plot (Fig 12) continues to compare Guro Reiten within her own team. This compares, as with the previous comparison to other FAWSL players, the number of completed passes to the penalty area per 90 minutes and the number of completed crosses per 90 minutes. Guro Reiten, highlighted in orange, ranks 1st in the number of completed passes to the penalty area per 90 and 2nd in the number of completed crosses per 90.
Reiten is second on this metric to Maria Thorisdottir. Thorisdottir, however, has an extremely small sample size (71 minutes played) compared to Reiten (1213 minutes played) and in the actual total amount of crosses completed, Thorisdottir has completed only 1 total cross during the season.
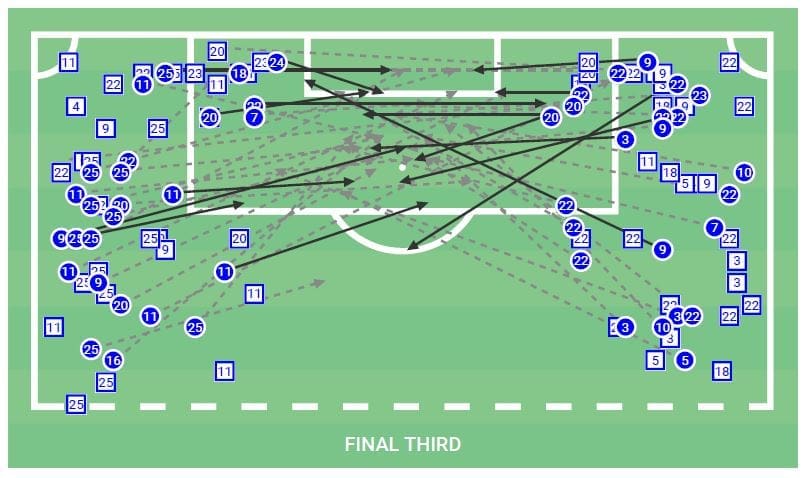
The diagram above (Fig 13) shows the location and number of crosses for Chelsea during the previous four FAWSL games. Chelsea, clearly have an emphasis on crossing as part of their principles of play. Chelsea are ranked 1st with 38 completed crosses into the penalty area during the season. Compare this to Manchester City, ranked 2nd with 29 completed crosses and West Ham, ranked 3rd with 20 completed crosses. The league average is 15.58. During the past four games, Chelsea have accumulated 3 assists directly from crosses, with Guro Reiten contributing x1 and an xA directly from crosses of 0.67. With Chelsea completing a high number of crosses per game and Reiten being a key contributor of the number of completed crosses, it is directly related that she would be a high contributor both in assists and in xA.
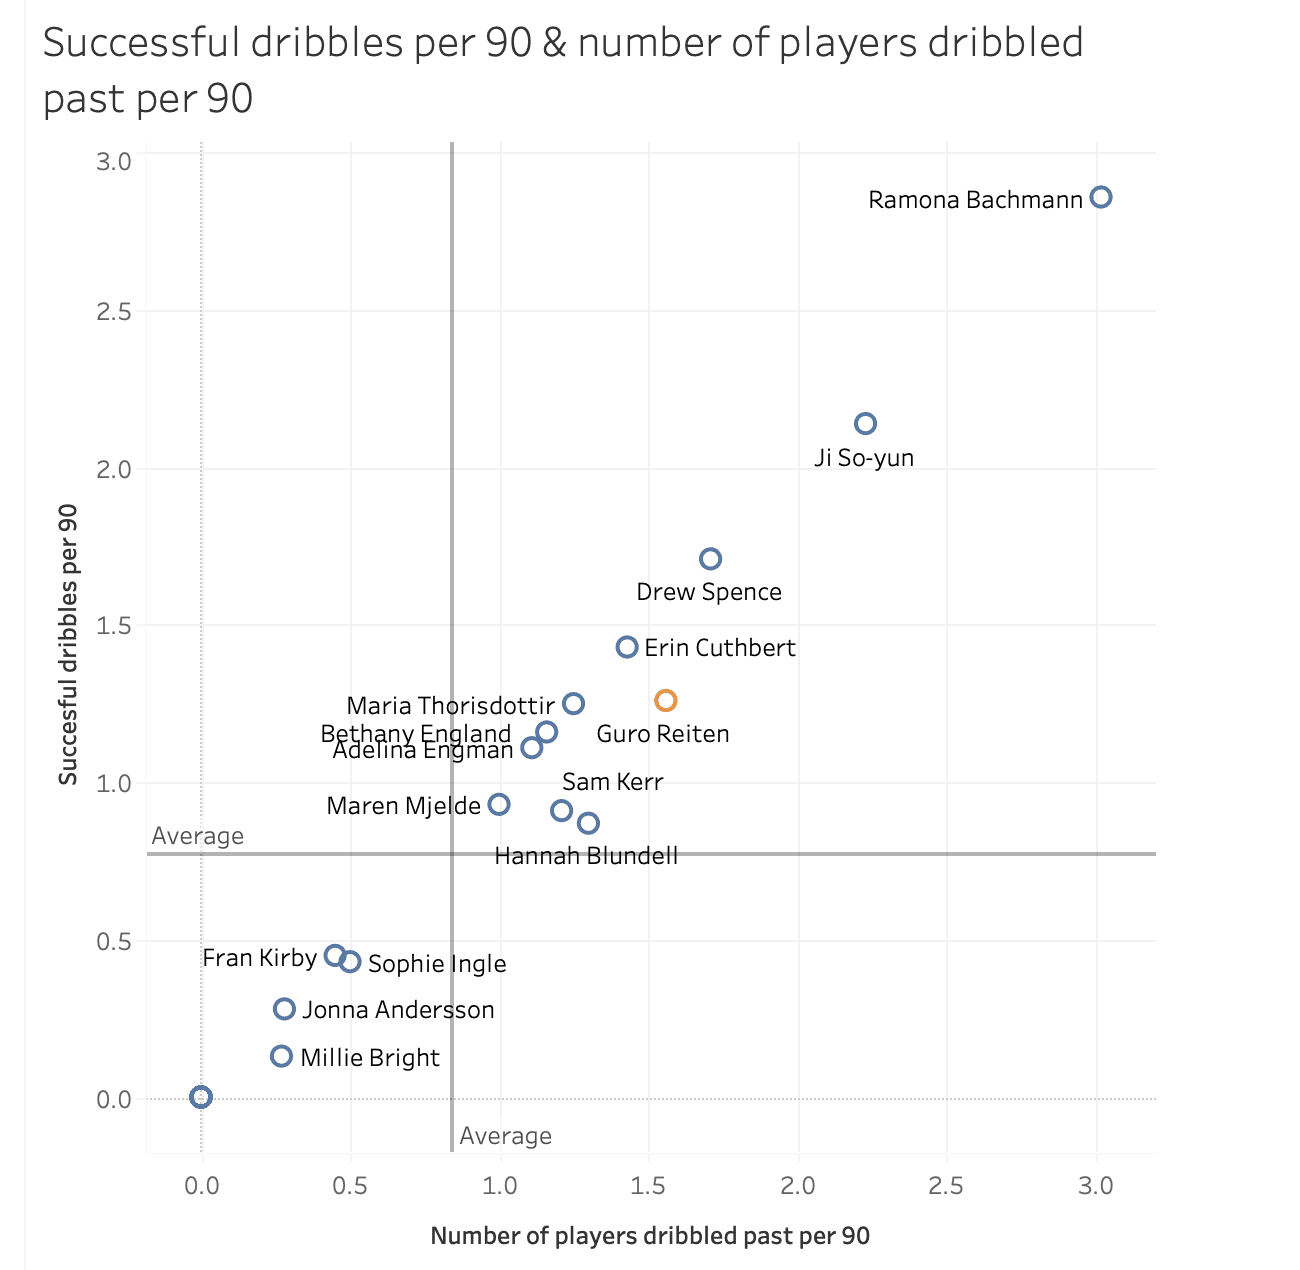
Reiten has above average scores, compared to her teammates, for both successful dribbles per 90 minutes and the number of players dribbled past per 90 minutes.
As winger, it may have been anticipated that Reiten would be ranked higher within the Chelsea team. With Chelsea implementing a 1-4-4-2 system, the front two forwards will likely occupy the two central defenders of the opposition, thus potentially giving the wide players the opportunity for 1v1 attacking. However, very important to note is the emphasis that Chelsea place on dribbling is lower when compared to the other 11 teams in the FAWSL. Chelsea are ranked 8th in total number of dribbles attempted, 9th in the total number of dribbles completed and 9th in the % of dribbles completed.

This final scatter plot compares Guro Reiten and the players of Chelsea in terms of completed through balls per 90 minutes and completed key passes per 90 minutes. Key passes are important as they refer to the number of passes (or shots) that directly leads to a shot. Reiten scores highly here within the Chelsea team. Jamie-Lee Napier, although appearing to score higher than Reiten in the number of completed key passes per 90 has in fact only played 14minutes for Chelsea this season, making 1 key pass. Reiten in comparison has completed 38 key passes at 2.81 per 90 minutes during 1213 minutes of action.
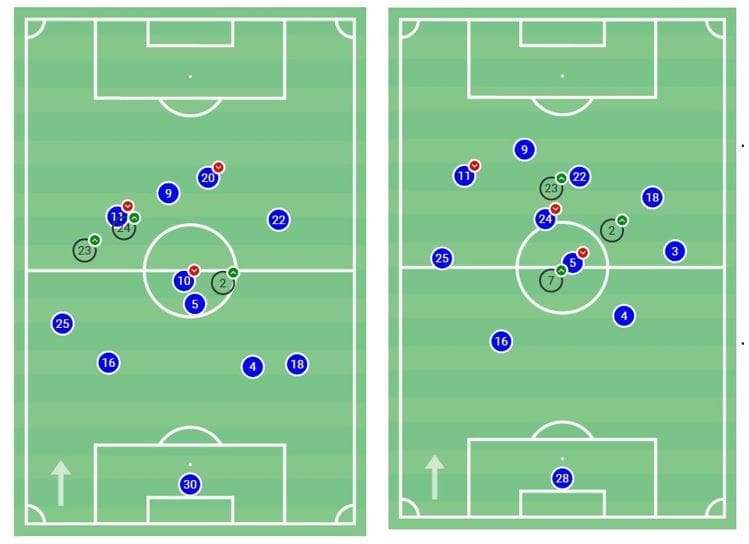
One reason potentially for this high scoring in number of key passes is the positional fluidity within Emma Hayes 1-4-4-2 diamond midfield system. Reiten has the ability to move infield, rotating with either Ji So-yun in the attacking central midfield role or the second striker (Sam Kerr, Fran Kirby, Erin Cuthbert or Drew Spence) as one of the front two.
Emma Hayes also has the option of utilizing Reiten either in a more inside position (vs. Manchester City) or outside (vs. Birmingham City) depending on how Chelsea want to attack the opposition based on space, opponent ability etc. This versatility to Reiten is again, another contributing factor to her impact in chance creation. She can play in any role that the game and coach require, with a variety of ways to assist from. It must be noted before completing this section of the article that a problem with the key pass metric is that not all key passes are equal, but key pass results creates a one-dimensional metric.
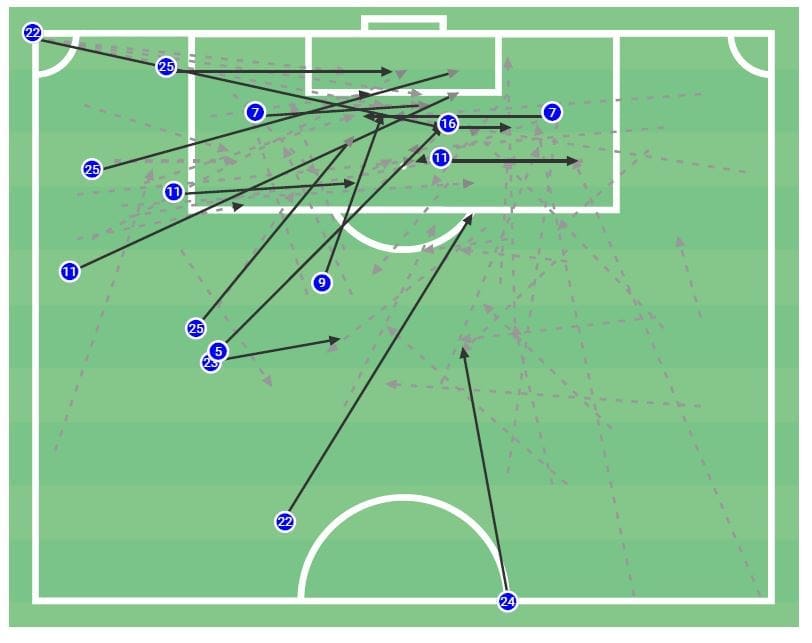
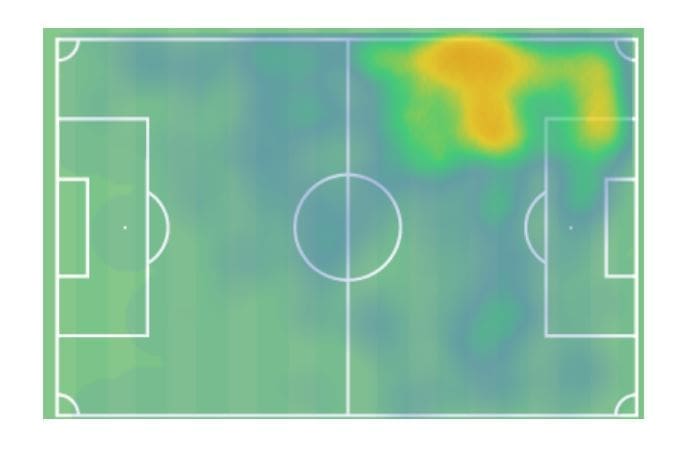
The two previous diagrams (Figs 17 & 18) show a) key passes from the previous 4 games of the FAWSL 2019/20 season and b) Guro Reitens heat map. Notice the comparisons between the spaces that Reiten occupies and the positions of key passes. During this four-game period, Reiten has contributed with the highest individual amount of 11 key passes (of 64 for Chelsea total). These key passes have resulted in 4 assists (of 15 for Chelsea total). The location of key passes emphasizes the importance Chelsea have of attacking on the left-hand side and the reliance on Guro Reiten in chance creation. Chelsea are ranked 2nd in the number of key passes completed (201).
Conclusion
In conclusion, this data analysis article has utilized both individual player and group team data to identify which players are the most impactful in terms of creating goal scoring chances. An equation was created to calculate the actual amount of xA in relation to the potential xG that individual players could contribute towards.
From this, further individual data and a scout report comparison was created on Guro Reiten of Chelsea WFC. The high scoring statistics and impact of Guro Reiten have been identified as her ability to provide crosses into the penalty area, linked with Chelsea’s style of play and her ability to provide key passes. This is in part due to both the fluidity of Emma Hayes’ Chelsea team and the intelligent movement and positional play of Guro Reiten. The diversity of ways in which Reiten can create chances, outside/wide areas to cross or inside/central to provide key passes make her a high statistic scorer and a versatile and dangerous attacking player within the Chelsea team.


Comments