Anyone who has already been in touch with football analysis will probably have heard of the so called “PPDA”. And whereas it is often used to quickly characterise a teams’ pressing approach, there is so much more to know about the PPDA model, its myths, strengths and weaknesses.
The following data analysis is supposed to explain what the PPDA is, what it can indicate and how one should use the PPDA value for analysis. Moreover, we will present some weaknesses of this statistical model to clarify some myths.
Definition of the PPDA
In order to define the term “PPDA” we use the definition made by Wyscout:
“PPDA = Number of Passes made by Attacking Team (opponent) / Number of Defensive Actions“
“Both values (passes made and defensive actions) will be calculated in opponent’s final 60% of the pitch.”
This means that a PPDA of 10 would tell us that the team allowed the opposition to play 10 passes without interrupting them by a tackle, challenge (failed tackle), foul or interception on average. Therewith, the PPDA is supposed to be an indicator for the pressing intensity. The lower the PPDA value, the more defensive actions per opposition passes indicating a more intense press.
The PPDA does not tell us, however, whether a side simply sit back in a deep block or whether they attempted to press but failed to do so. As a consequence, the PPDA as a part of quantitative analysis should only be used in combination with qualitative analysis meaning observation of the teams’ approaches.
What does the PPDA tell us?
But what can the PPDA statistic tell us and how can it help our analysis?
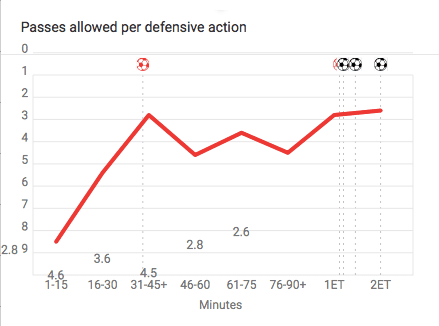
As already mentioned, the PPDA is measuring the pressing intensity. And one of the main advantages of the PPDA is that it is one figure which is quite simple to interpret. By depicting the development of the value throughout the game, one can usually see any changes of the pressing approach on the first view.

The development of Liverpool‘s PPDA, in their game against Atletico Madrid as displayed above, shows how Klopp’s men a bit more cautious while constantly increasing the pressing intensity until conceding the first goal. In combination with qualitative analysis, these statistics can support tactical observations concerning the pressing intensity.
In order to get a sense of certain PPDA values one can compare the values with the leagues’ average value. In the following, we’ve displayed the average values of the top five European leagues in 2019/20.
- La Liga: 9.94
- Serie A: 10.78
- Bundesliga: 11.23
- Premier League: 11.63
- Ligue 1: 11.80
These stats allow us basic assumptions on the playing culture within the certain league. It is not a big coincidence, for instance, that La Liga holds the lowest PPDA average. The Spanish top flight is well known for a high pressing intensity. This can also be of importance for player transfers. An attacking player who prefers to press high up the pitch, for example, could look for a league and a club where this pressing strategy is common.
When comparing a teams’ PPDA value with the league average, one can see whether the side is executing a pressing approach with a relatively high or low intensity. Obviously, the pressing tactics and therewith also the PPDA value can change from game to game though.
Furthermore, by turning the model around and depicting the “PPDA against”, it is possible to see trends in the opposition pressing intensity throughout a season or a game. Since the opposition pressing approach is alway dependent of the own build-up play and vice versa, the PPDA against can be of interest as well. It shows how intense the opposition sides press against team XY.
PPDA ≠ quality of pressing
The most common myth about the PPDA is that it displays the quality of the pressing. However, this assumption is untrue, the PPDA does not make any statement about the quality of the pressing.
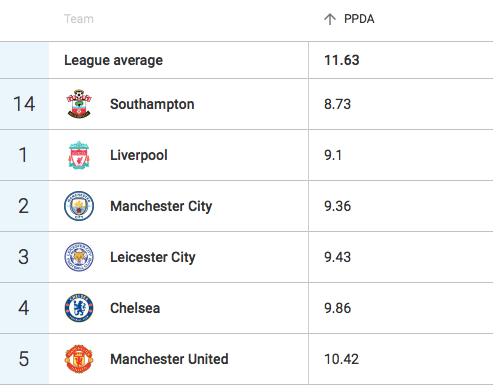
Nevertheless, on average more dominant teams usually have a lower PPDA value due to their more intense pressing. As we can see in the following graph, the top five from the Premier League rank among the top six in terms of the lowest PPDA values.

These dominant teams will probably also have more success with their press. However, this does not necessarily mean that a more intense press is better but can also be due to their high quality.
On the other hand, there can also be sides which press the opposition with a PPDA value of 5.0 and still conceding a lot of chances or even goals. That is mainly because the opposition might overplay the pressing in a very direct manner only needing a few passes to get behind the back line.
Another aspect is that some teams execute a pressing in the middle third. Jürgen Klopp, for instance, liked to deploy a mid-press in his times at Borussia Dortmund and sometimes at Liverpool. That obviously enables the opposition to circulate the ball within the first third. Nevertheless those passes do not overplay any lines and do not threaten the pressing side. As a result, the PPDA value might be relatively high although the defensive side press with a high intensity once the opposition get into the middle third. Moreover, a good pressing often includes traps and triggers and some of them should be well prepared. This might also include the opposition to play a few non-threatening passes in the build-up phase.
Therefore, the PPDA value in combination with the opposition packing (meaning how many players are overplayed with each pass) statistics might tell more about the success of the press.
Conclusion
All in all, the “PPDA” can tell you much about the pressing intensity and therewith fulfils its purpose. It can help identifying pressing strategies throughout a game or a whole season.
Nevertheless, as explained in our data analysis, it cannot assess the quality of the pressing.
Therefore, one has to be careful when using the value in a tactical analysis and should only use the PPDA in combination with qualitative analysis to support or discard tactical observations.


Comments