This week in our 1.HNL series we will display Dinamo Zagreb in numbers through this data analysis. Because of coach changes at the club, we decided that tactical analysis is not the best option right now. Using statistics and data we will analyze Dinamo as a team, but will analyze players compared to the other players as well.
Dinamo easily won the league title and had room to experiment with young players and players who played a small amount of games. They will pursue Champions League group stage once again through qualifications, but they could face department of some key players which they will have to replace. Dinamo already signed Lokomotiva duo: Lirim Kastrati who impressed last two seasons in 1.HNL and Fran Karačić who waited for transfer to bigger club given his performances in the last few seasons. That gives us a hint that probably Petar Stojanović who played less in the second part of the season, will be sold and there are rumours that Serie A side Bologna is interested in Slovenian right-back services. From wingers, there is a lot of rumours surrounding Croatian international Mislav Oršić who was connected with possible new EPL side West Brom on winter window. Other players who could be in high demand are: Bruno Petković, Amer Gojak, Nikola Moro and Dominik Livaković. Dinamo won’t sell them all cause they have Champions League ambitions, but after recent events, they will probably look to balance their finances by selling players.
Team performance
We will start with team performance compared to the other teams in 1.HNL. Dinamo dominated this season and even that they won only once in the last 5 game weeks they are 14 points above second-placed Osijek. The graph below will show us how they look in terms of points won and expected points per match.
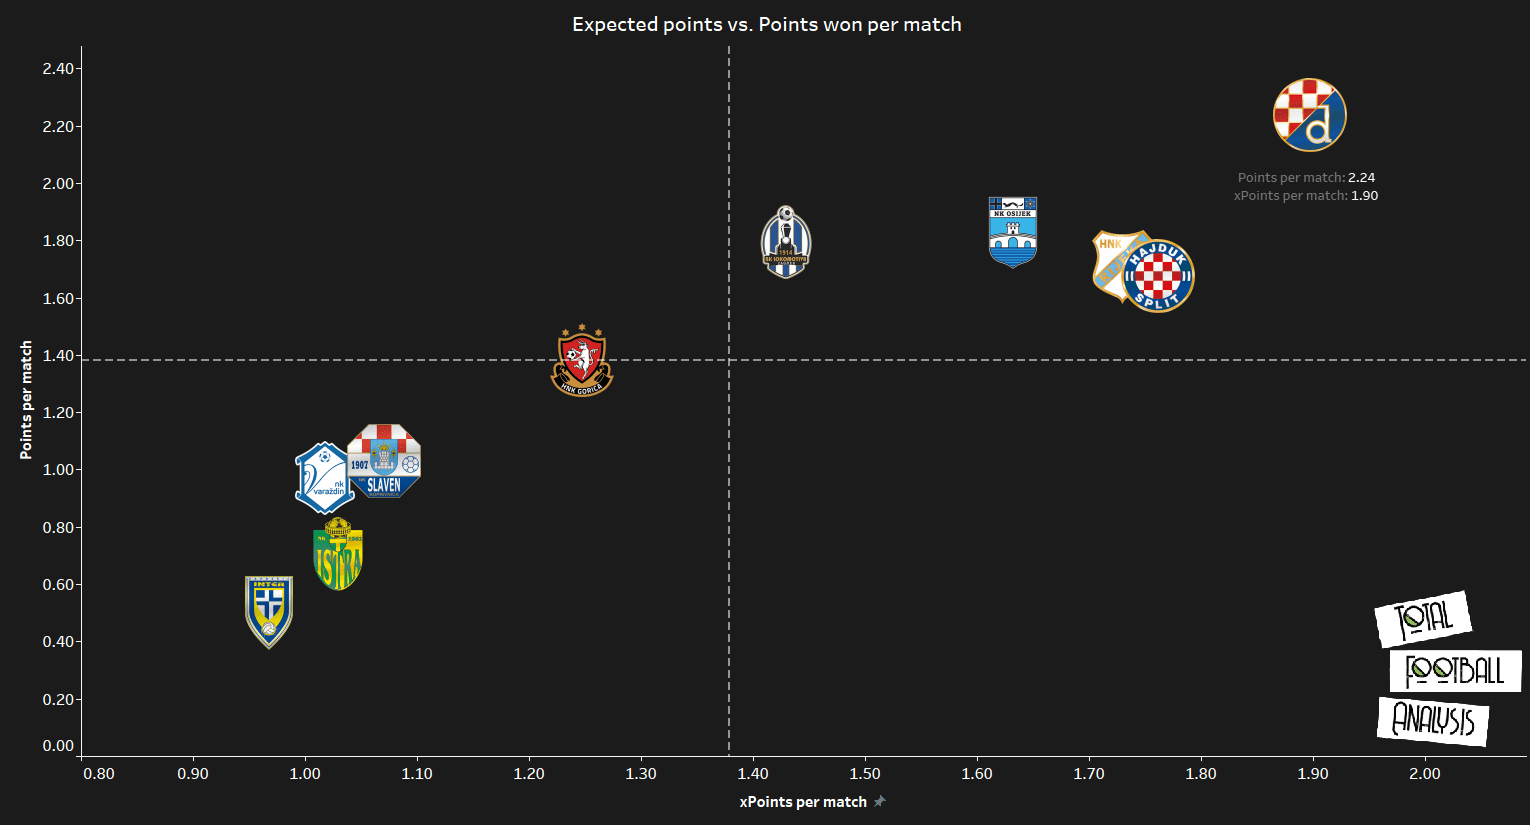
We could assume Dinamo won the most points per match (2.24). Dinamo has the highest expected points value of 1.9 per match as well. That gives us 76 points in 34 matches, which would be probably more if they had real competition this season which would push them to be more motivated and rotate less, but given circumstances that they won league few months in advance, it is reasonable that they slow down.
Second graph we gonna analyze is xG for and against per 90. This will help us see how many quality chances they create and allow per match.
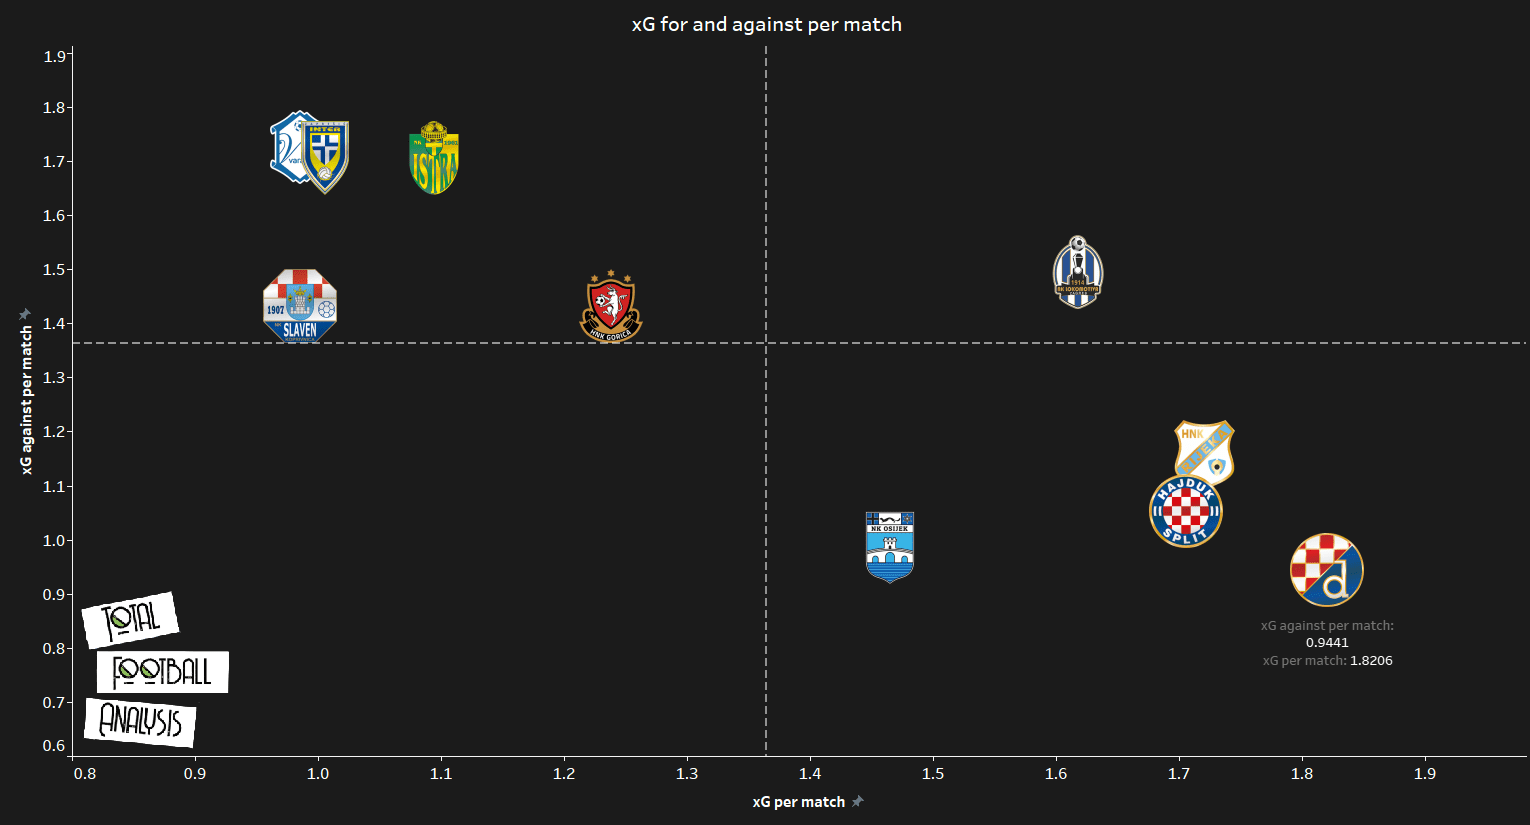
Dinamo has the best spot on the graph, they allow the smallest amount of xG for their opponents with 0.94 per match while averaging the highest amount of 1.82 xG per match. Second-placed Osijek is the only team next to Dinamo who has below 1 xG against per match. Dinamo is the only team with 1.8+ xG per match showing how much quality situations they create per match.
We will take a look and see how often Dinamo attempts lateral or long pass per 100 passes. These metrics will help us see how direct or positional team they are.
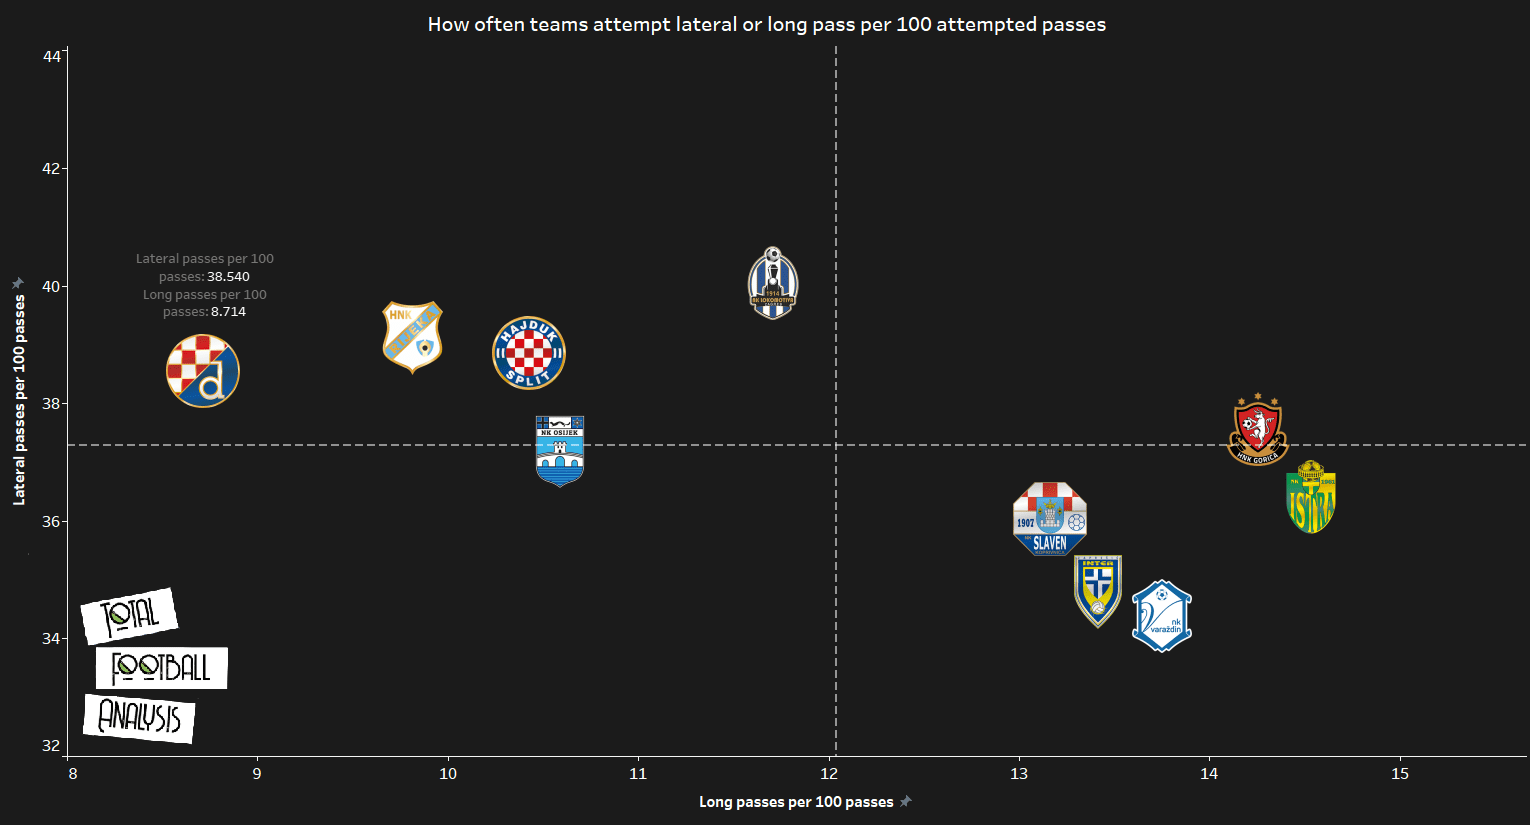
Dinamo is the least direct team in the league. They attempt 8.7 long passes per 100 passes attempted, while they attempt 38.54 lateral passes per 100 passes attempted. Dinamo doesn’t hesitate to get the ball forward, but they do it with shorter passes because their opponents mostly drop deeper against them. Having that in mind we will take a look onto Dinamo lost balls locations.
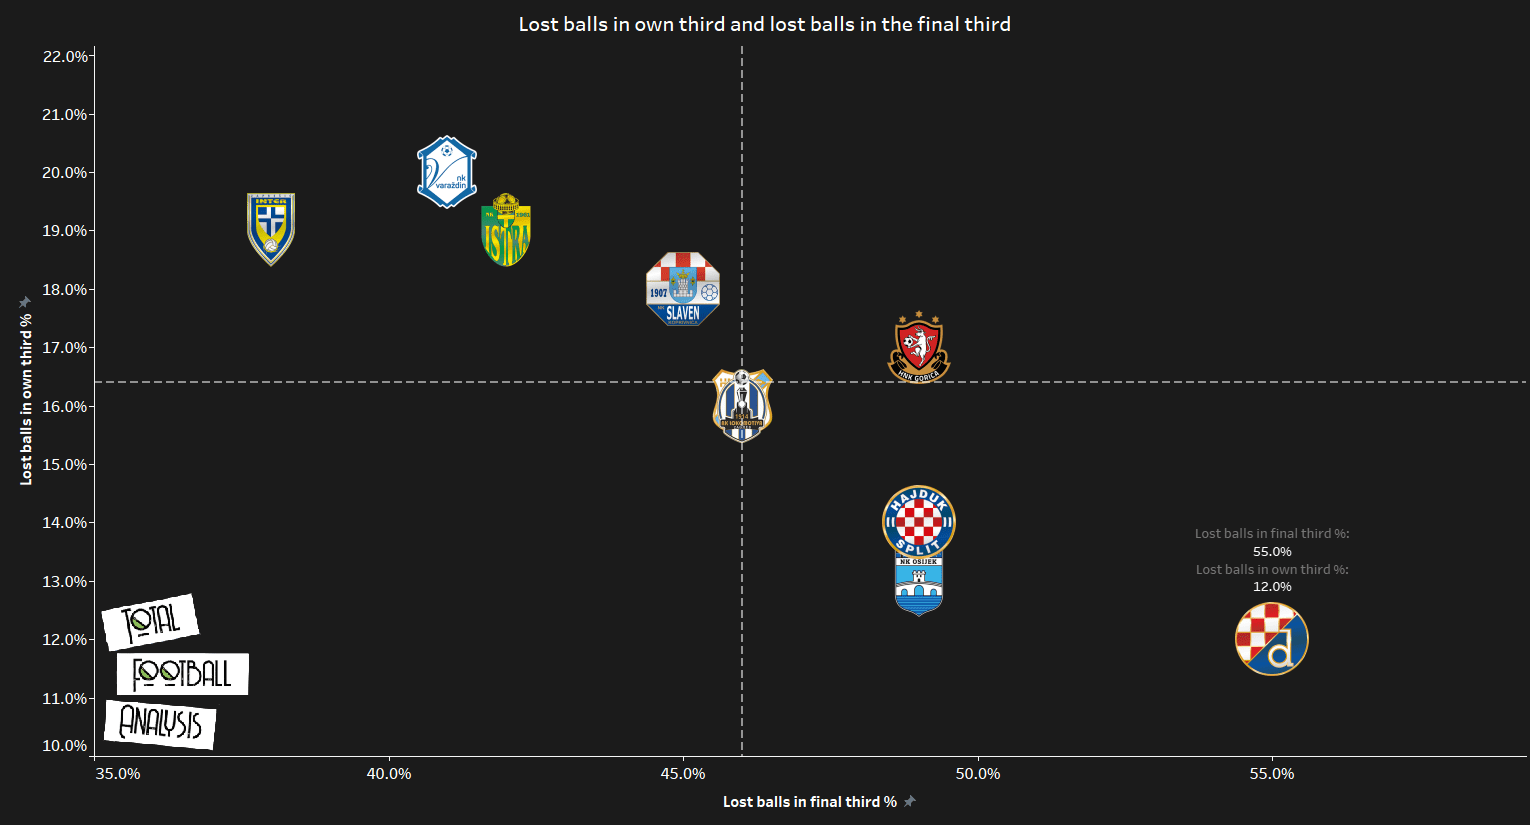
Because most of the teams drop back against them, they lost more balls in the final third than any other team in the league(55%) which is a good sign for them cause they lose most of the balls far away from their goal which makes it less dangerous for them. Dinamo as well losses smallest amount of balls in their own third with only 12% which shows how careful they are with the ball at the back, but as well some sign that their defence doesn’t face a lot of pressure when in possession. According to that we should analyze where they make recoveries of the ball.
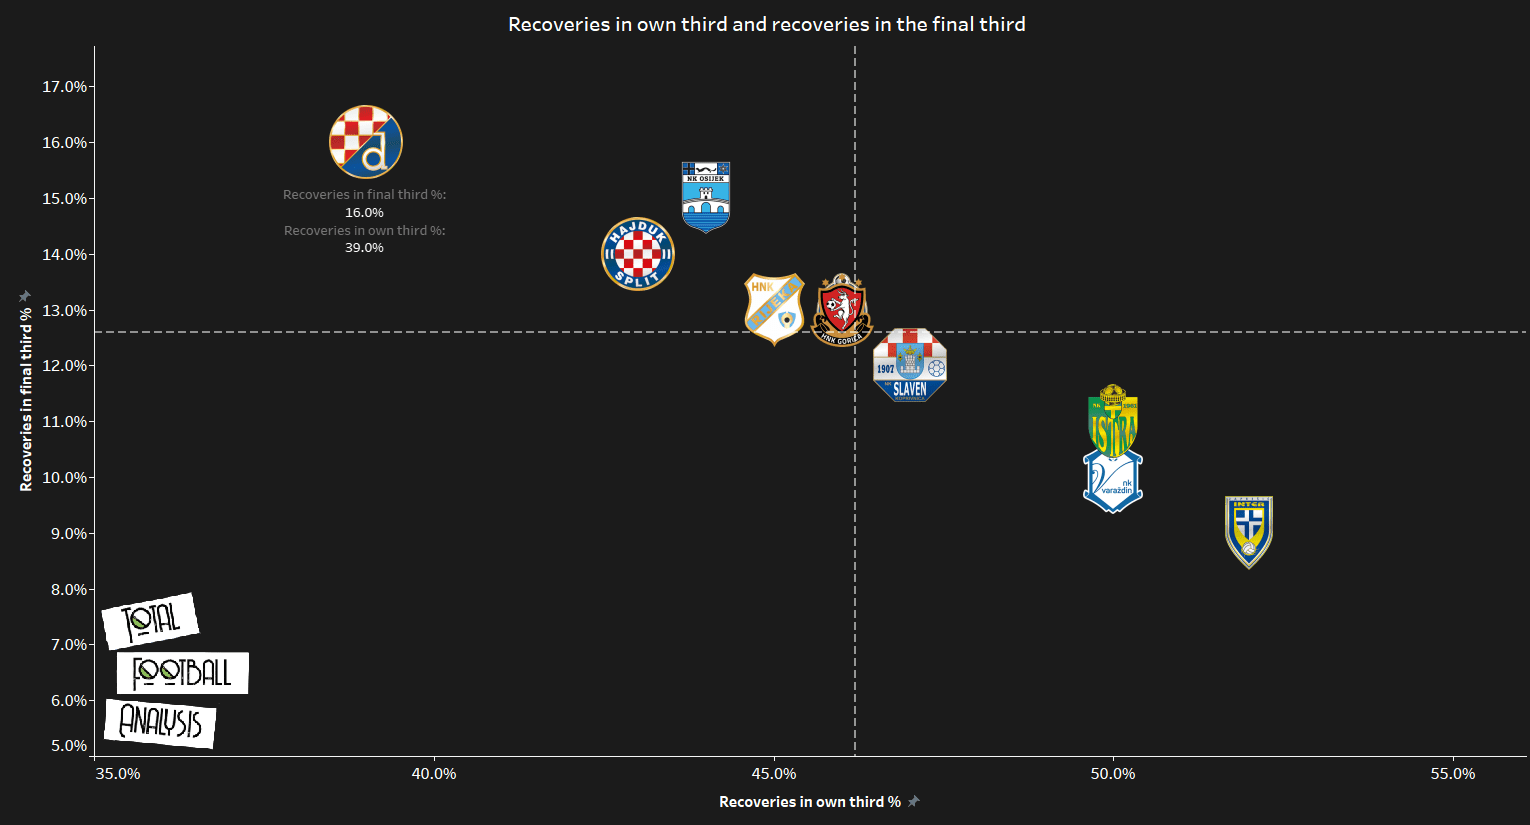
They are once again in the best spot on the graph. Dinamo percentage of recoveries in the final third is 16% which is more than any team, showing they apply pressure successfully while they recover the smallest amount of balls in their own third with 39%. That means that the other 45% of recoveries are made in the middle of the pitch, which indicates that they often counter-press when the ball is lost in the middle of the pitch and higher up the pitch.
Defenders
Dinamo had really good options on centre-back positions this season with Perić, Dilaver, Theophile-Catherine and one of the most talented centre-backs in Europe, Joško Gvardiol. In the next graph, we will take a look on their defensive impact.
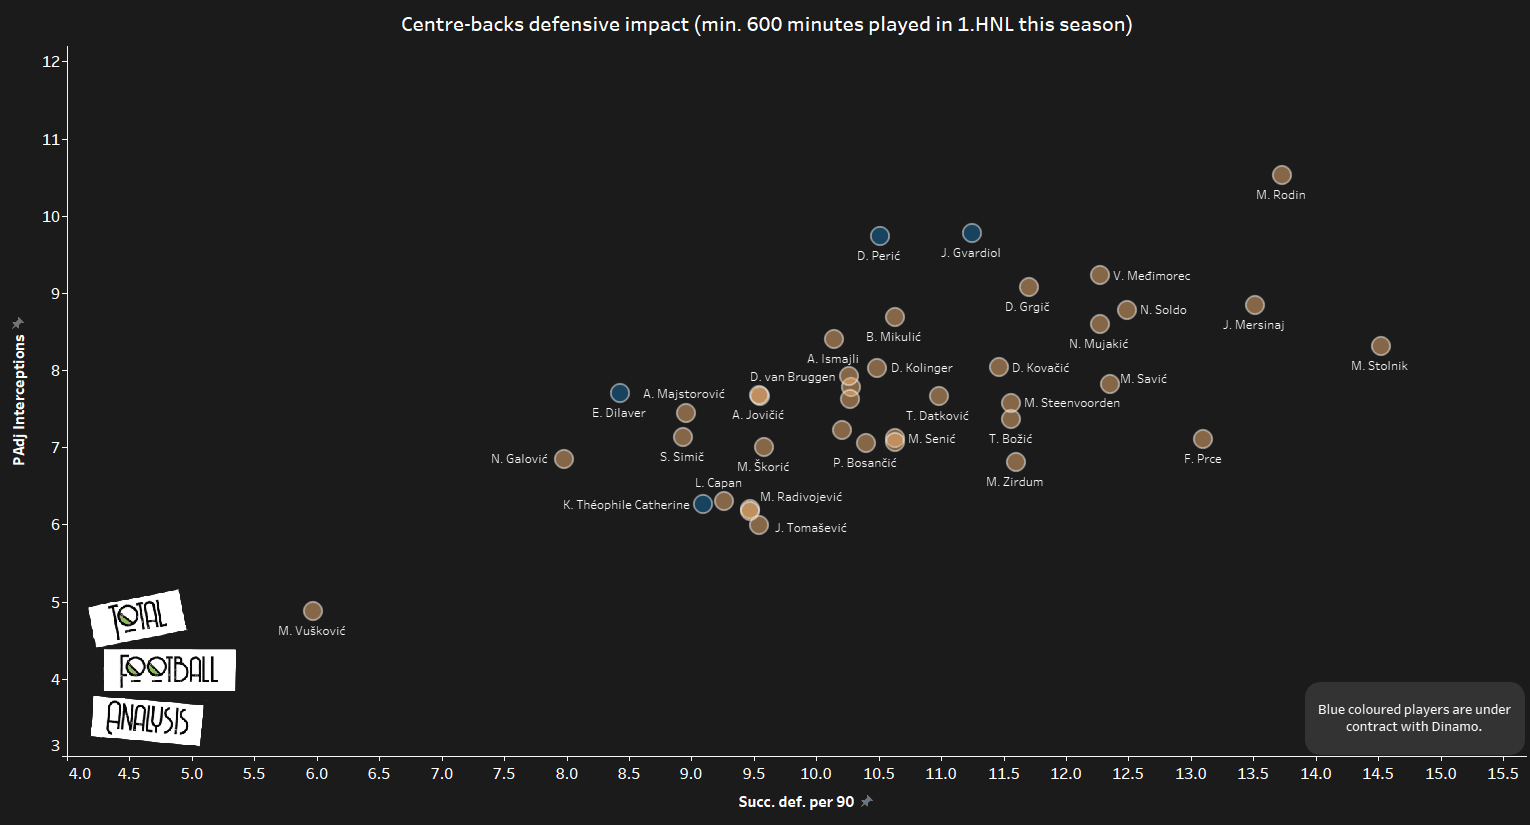
Perić and Gvardiol are similar in PAdj interceptions, Perić has 9.74 while Gvardiol is averaging 9.78. They both have a high number of successful defensive actions, Perić is averaging 10.51 per 90 and Gvardiol is averaging 11.25 per 90. Dilaver and Theophile-Catherine are having smaller defensive impact in actions, but their experience and positioning have high value for Dinamo defence. Next evaluation of centre-backs will be by their ability to pass and contribute in the build-up.
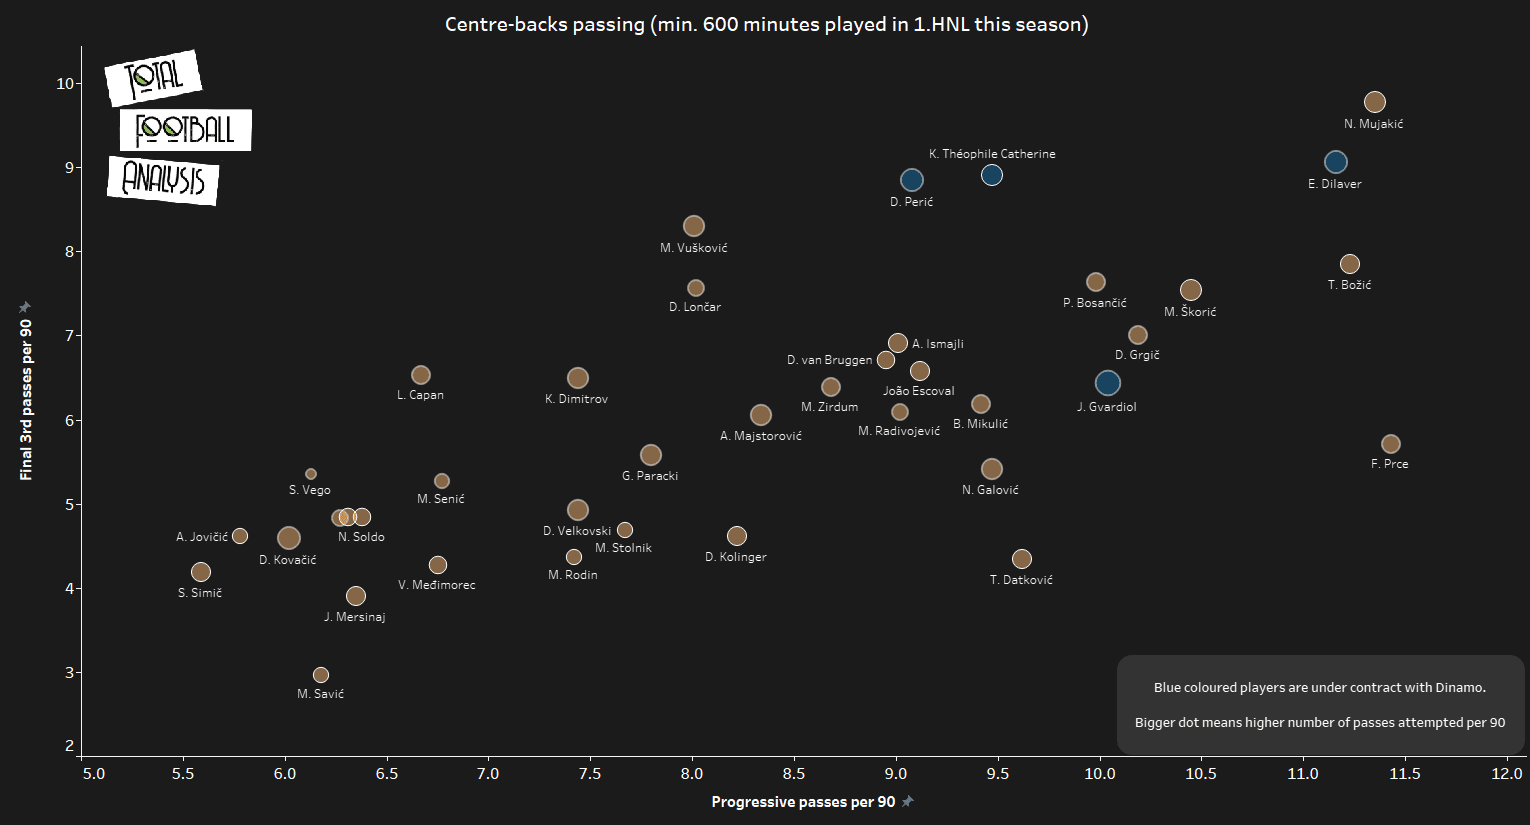
We can see that all of the Dinamo centre-backs attempt more than 9 progressive passes per 90 and more than 6 final third passes per 90. Bigger dot means they attempt a higher number of passes per 90 and we can see that they are all attempting a lot of passes. Dilaver shows remarkable passing qualities with 11.16 progressive passes per 90 and 9.06 passes into the final third per 90. We can assume that all of their centre-backs participate in the build-up by making passes towards the opponents goal.
We will now evaluate their full-backs and their defensive impact. Using successful defensive actions and PAdj interceptions once again we will get the needed results.
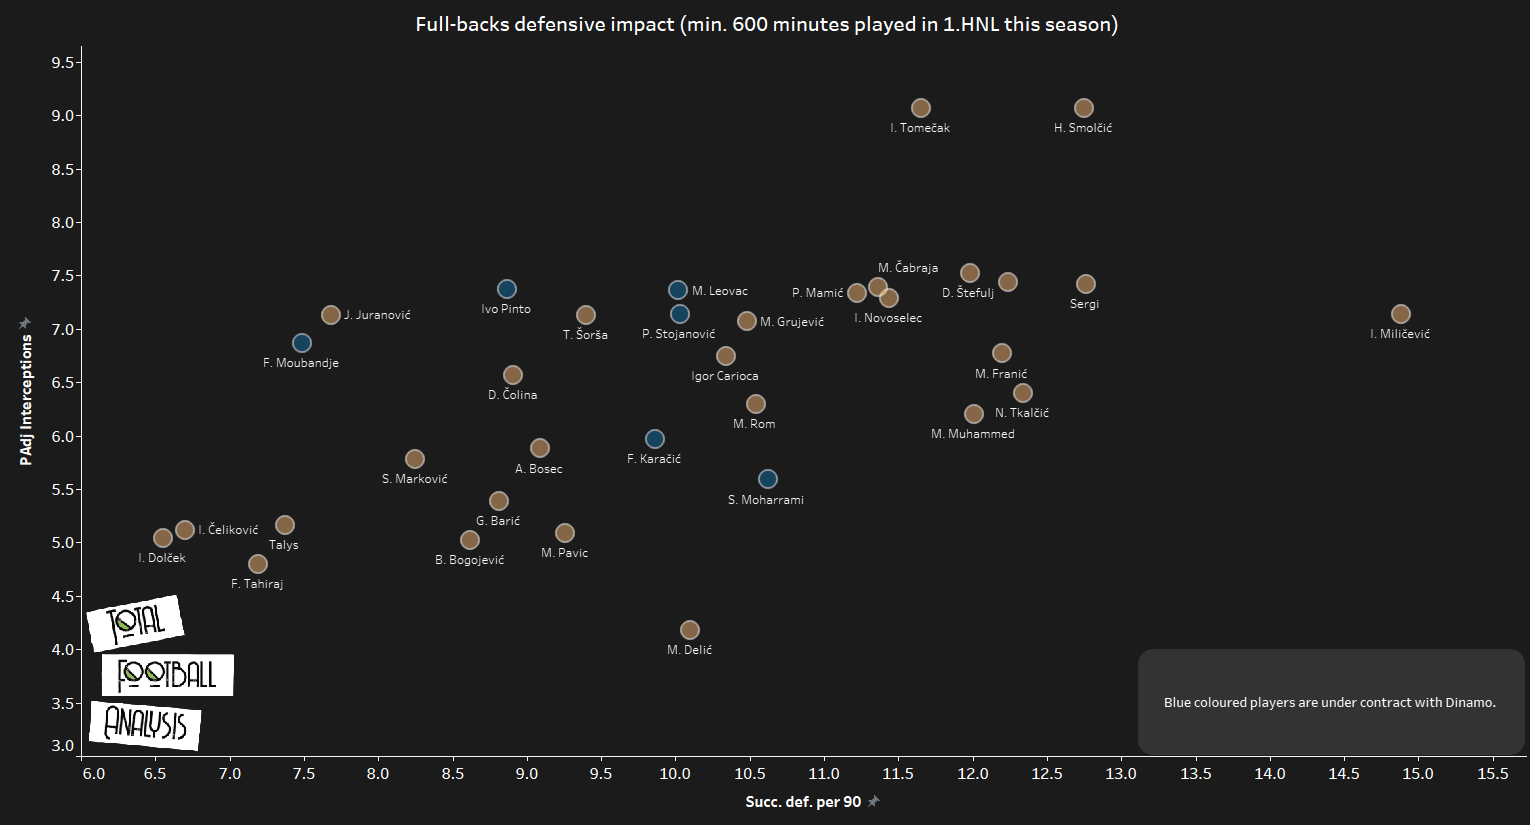
Here we have Ivo Pinto and Fran Karačić marked blue, Karačić was bought this winter but stays in Lokomotiva till the end of the season while Pinto played the first part of the season before making a loan to Desportivo Aves. Knowing that Leovac is Croatian international and crucial part of Dinamo starting XI, Moubandje is his only backup and he showed he is not on that level in recent games. Leovac is averaging 10.02 successful defensive actions per 90 while Moubandje is averaging 7.49 per 90. Their right full-back position is stacked having now four quality players under contract. All of their right full-backs show solid numbers on the defensive side, but now we will see their offensive impact by looking at their successful attacking actions and crosses per 90. Bigger the dot means higher xA per 90.
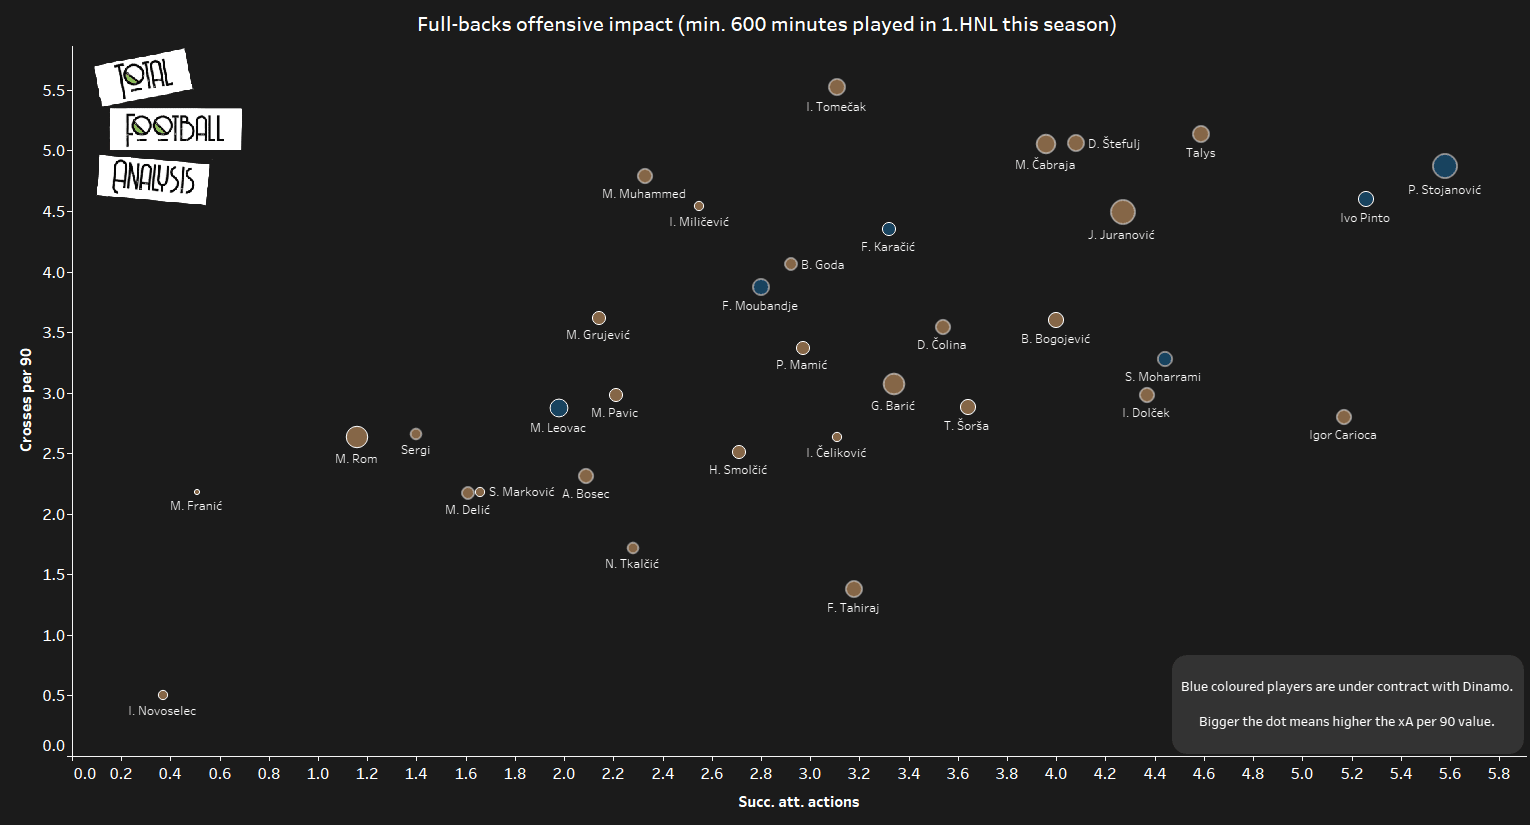
Even that Leovac is better defensively by numbers in this graph we can see that Moubandje is better than him in these metrics, but Leovac has higher xA per 90. It could be defined because Leovac chooses situations when to go further the pitch making the right movements, while Moubandje natural fitness allows him to go up and down the pitch more often. Stojanović and Pinto have remarkable offensive impact, Stojanović is averaging 5.58 successful attacking actions per 90 and Ivo Pinto is averaging 5.26 successful attacking actions per 90. They attempt 4.5+ crosses per 90 and Stojanović crossing accuracy is 33.33% while Pinto is really accurate crosser with 39.29% accuracy. Stojanović showed that he is making an impact in both attacking and defensive phase, meaning he is ready to take the next step in his career. Karačić and Moharrami based on numbers look like more balanced options while Ivo Pinto is really good offensive full-back, but could be a liability when defending. We could probably see Dinamo selling two right-backs this summer and maybe signing younger left-back with Leovac ageing and Moubandje not playing how they expected when they signed him.
Midfielders
This section will be based on midfielders impact. We will take a look into their defensive abilities by looking successful defensive actions per 90 and PAdj interceptions.
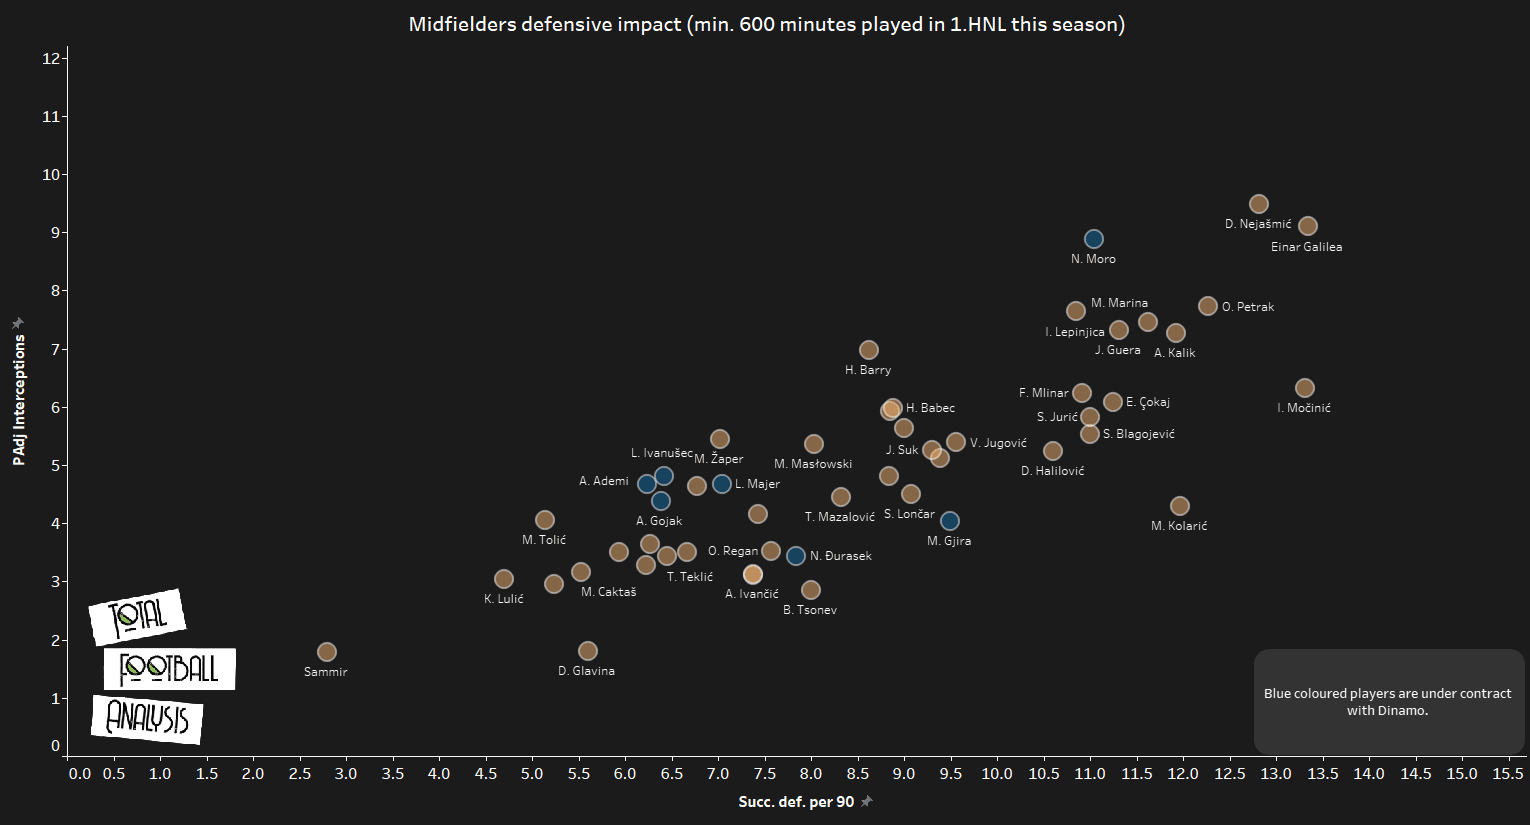
It is not surprising that Nikola Moro is the best Dinamo midfielder in terms of defending, his work rate and anticipation give him an advantage over the opponents. Moro is averaging 11.04 successful defensive actions per 90 and 8.88 PAdj interceptions. Future Moro replacement hot prospect Marko Đira is the closest player to Moro by successful defensive actions. What surprises is that Dinamo captain Arijan Ademi is having a smallest defensive impact, he is a hard-working engine, but when playing in pair with Moro he plays more like 8 than like 6. Still, it is surprising that Majer who is exclusively playmaker has more successful defensive actions than his skipper. Next graph will show us how creative Dinamo midfielders are by showing their deep completions per 90 and final third passes per 90. Bigger the dot means higher expected goal contribution per 90.
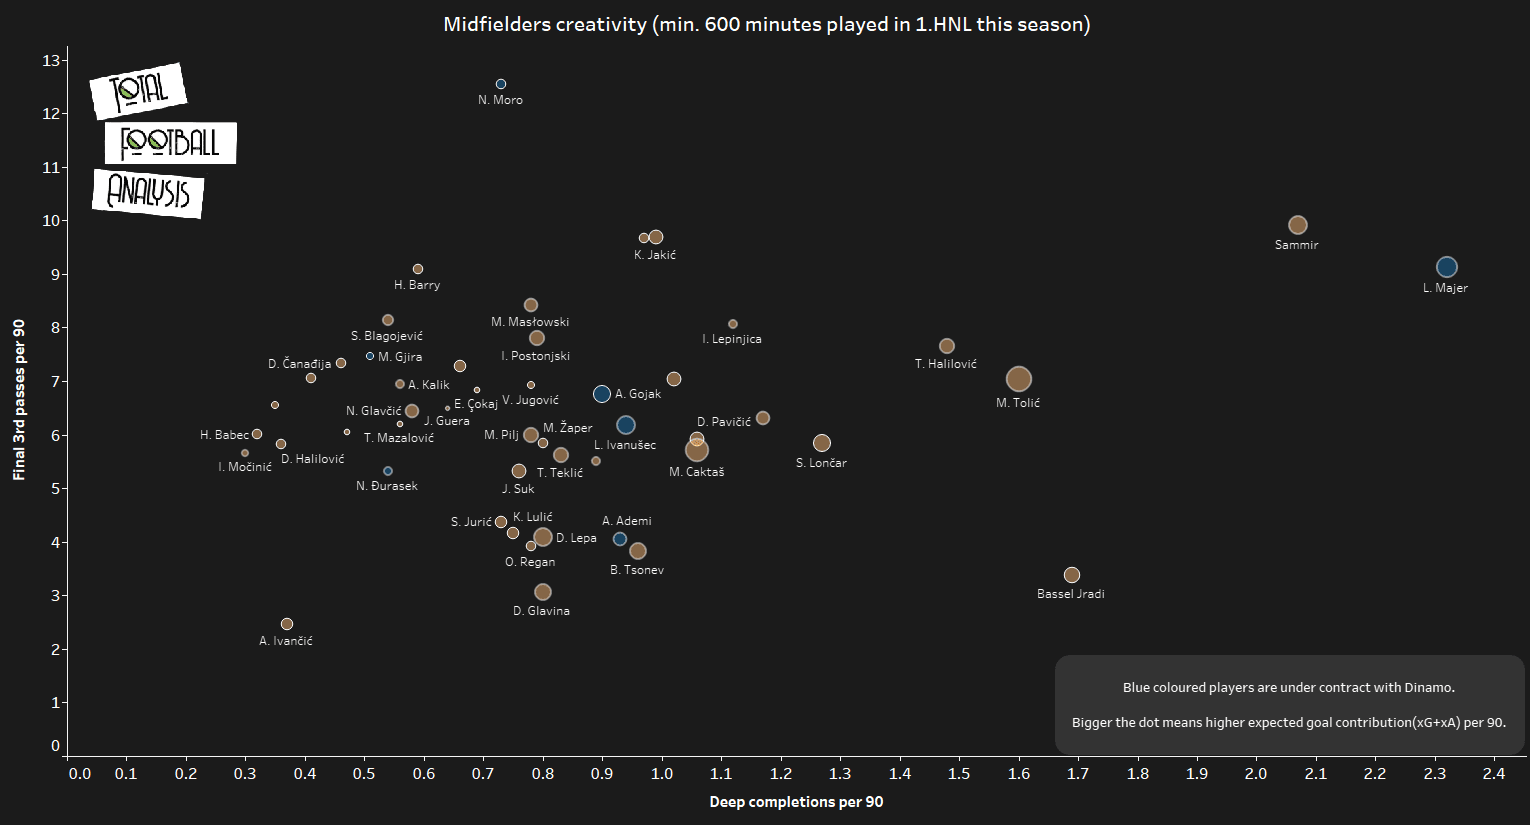
Lovro Majer and ex-Dinamo player Sammir are in their world of creativity. Majer is averaging 2.32 deep completions per 90 and 5.91 passes into the final third per 90. Dinamo playmaker is averaging 0.33 xA per 90 and 0.17 xG per 90 which is impressive. The player who makes the most passes into the final third is Moro who attempts 12.54 per 90. Gojak and Ivanušec are having similar output and they are often dangerous in the final third. Đurasek is playing for Varaždin on loan this season and he is not so impressive in those two evaluations we made, but with potential changes in the squad, he could find himself as a backup option next season.
Forwards
The last and the most exciting part of Dinamo squad are their wingers and centre-forwards. They have Atiemwen and Andrić on loan at Lokomotiva and Inter Zaprešić respectively. We didn’t label Gavranović blue on graphs because his contract expired and he will continue his career elsewhere. Kastrati was bought in the winter transfer window and he will join his new club next season. Antonio Marin is one of the most promising young wingers having played some extraordinary games in UEFA youth Champions League. We know Petković and Oršić qualities, both Croatian internationals who won’t lack transfer offers this summer. Polish international Damian Kadzior is arguably one of the best 1.HNL players this season, he didn’t play a lot in Europe matches, but he was starting XI most of the time in league matches.
First, we will evaluate forwards based on their goal contribution and expected goal contribution.
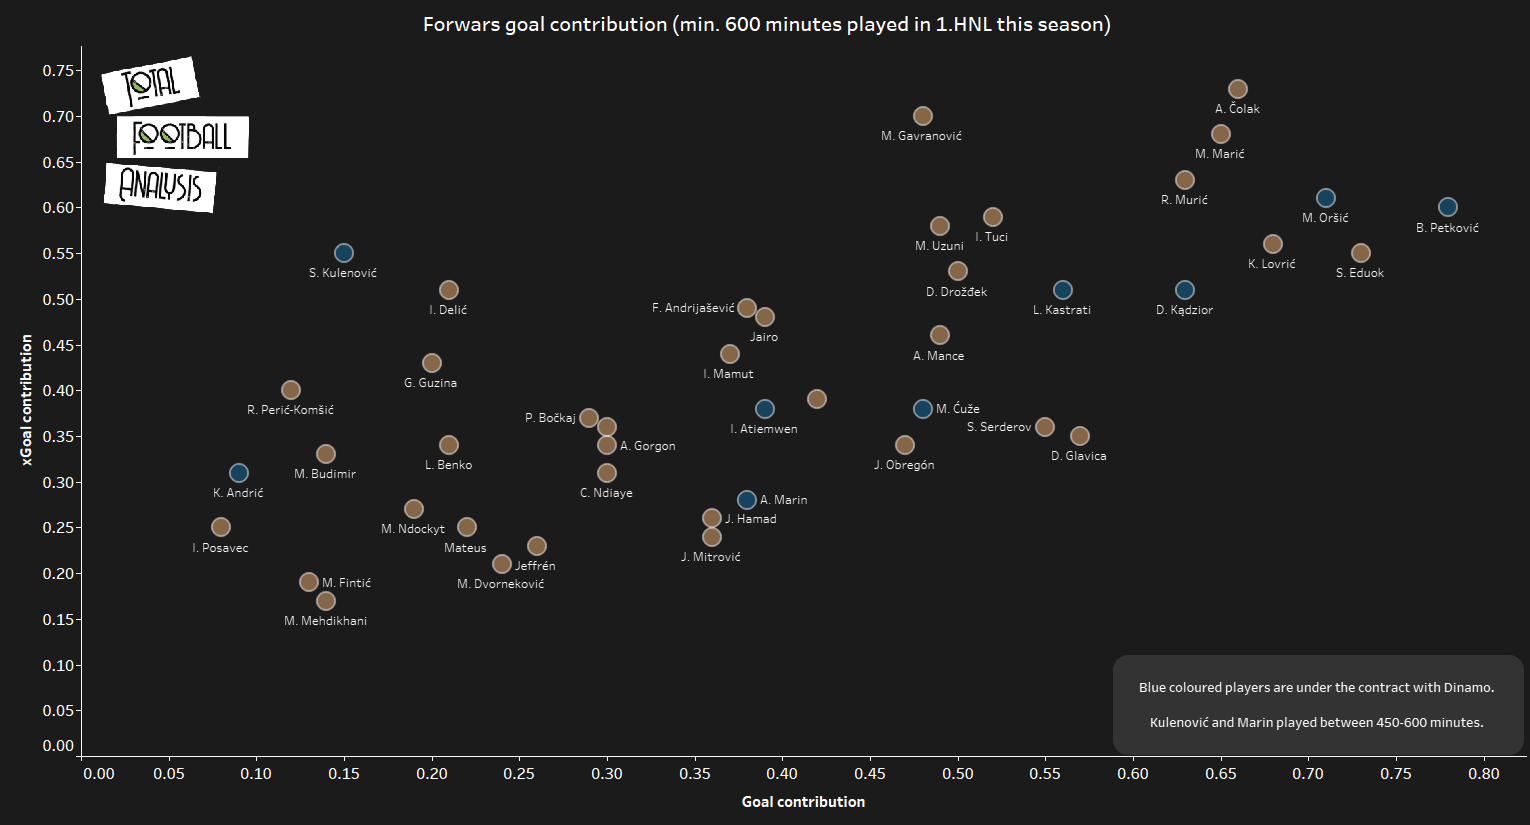
Petković and Oršić are leading the way with Petković averaging 0.78 goal contribution per 90 and 0.6 expected goal contribution per 90. Oršić is averaging 0.71 goal contribution per 90 and 0.61 expected goal contribution per 90. Both of them are exceeding their expected values which represents their high form this season, Petković scored seven goals and assisted nine times while Oršić scored 12 goals and assisted five times. Kadzior and Kastrati average same expected goal contribution per 90(0.51) and they both exceed it with 0.63 and 0.56 respectively. Bad sign for Dinamo is if they sell Petković his replacements Andrić and Kulenović are on the wrong side of the graph, Kulenović didn’t score this season and assisted once while Andrić scored only one goal. Final graph we will evaluate is forwards shots per 90 and touches in the box per 90.
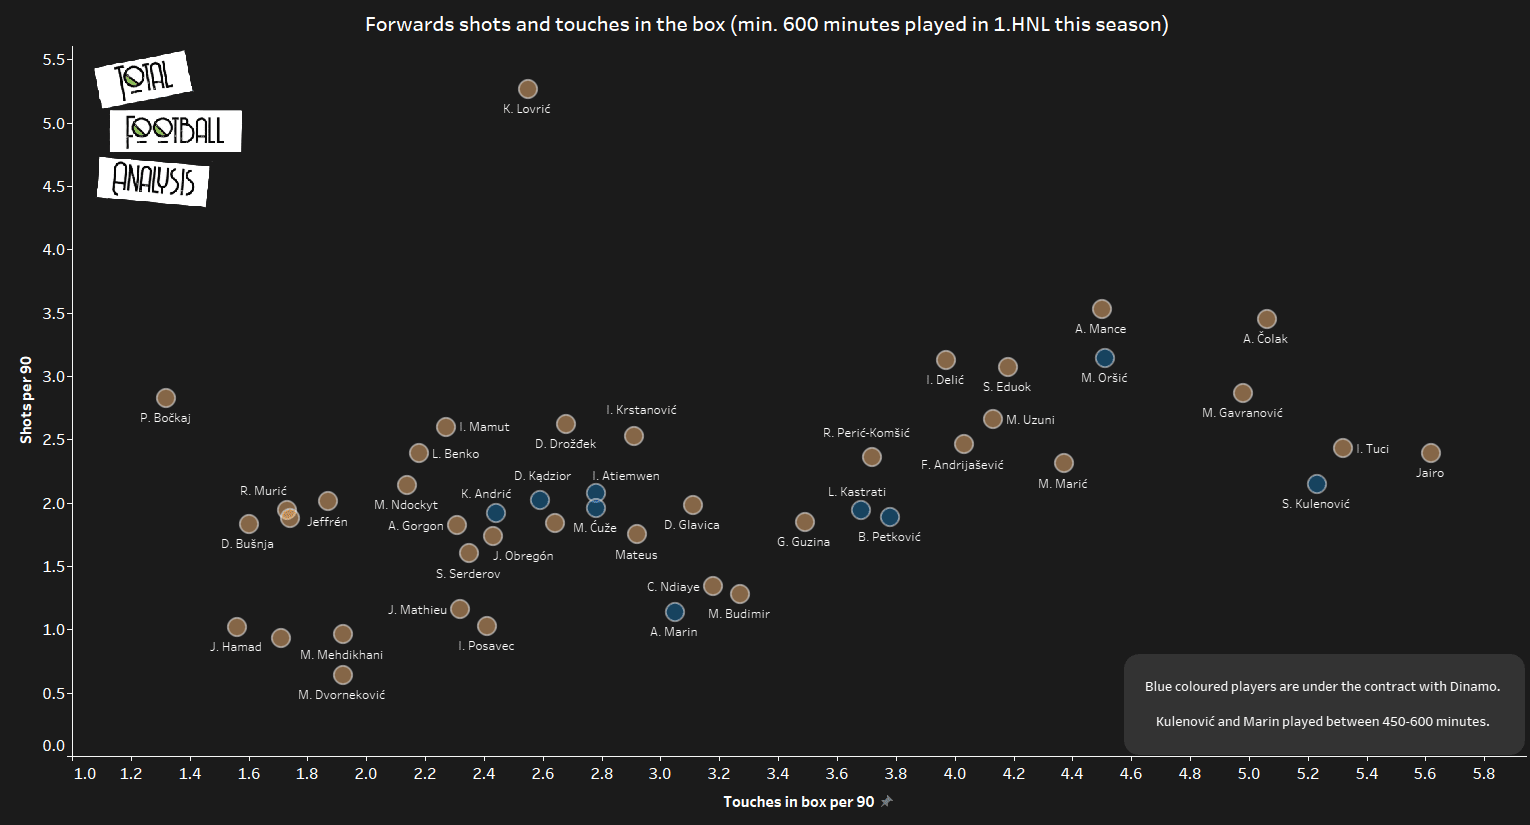
What we can see is that Oršić takes most shots 3.14 per 90 compared to his teammates while averaging 4.51 touches in the box per 90. Kulenović gets a lot of touches in the box with 5.23 per 90 and he takes 2.15 shots per 90. Others are taking between one and two shots per 90 with a similar number of touches in the box, only Petković and Kastrati separating slightly in that metric. Dinamo possesses dangerous forwards and with Kastrati joining and Marin developing they have a bright future on the wings. Ćuže as well can develop in dangerous forward.
Conclusion
After we scanned the whole team by statistics and data, we can conclude that Dinamo has depth in all positions except left-back, while having a mix of experienced players and highly-promising youngsters. It will be an interesting summer for Dinamo who will appoint a new head coach for next season, but as well they will face a lot of interest for their highly-valued players. Based on performance we can conclude that they once again deservedly are the 1.HNL champions, having the most quality roster with many international players what other teams lack.




Comments