After a month of constant football viewing, we can collectively catch our breath.
With the days equally split between Euro 2020 and Copa América, we’ve seen football go to Rome and Argentina break their 28-year title drought.
With all the games in the book, we have a full data set to examine the tournaments.
In this data analysis, we turn our attention to the Euros. We’ll look at how the teams got their goals, offer analysis of attacking statistics, study defensive metrics and break down set piece themes. All statistics and images in this data analysis come from the InStat Euro 2020 Report.
How they scored
Our first section will cover goals. Specifically, we want to see which teams had the greatest and least success, the shooting locations, duration of goal-scoring moves, the average number of passes and the types of goals.
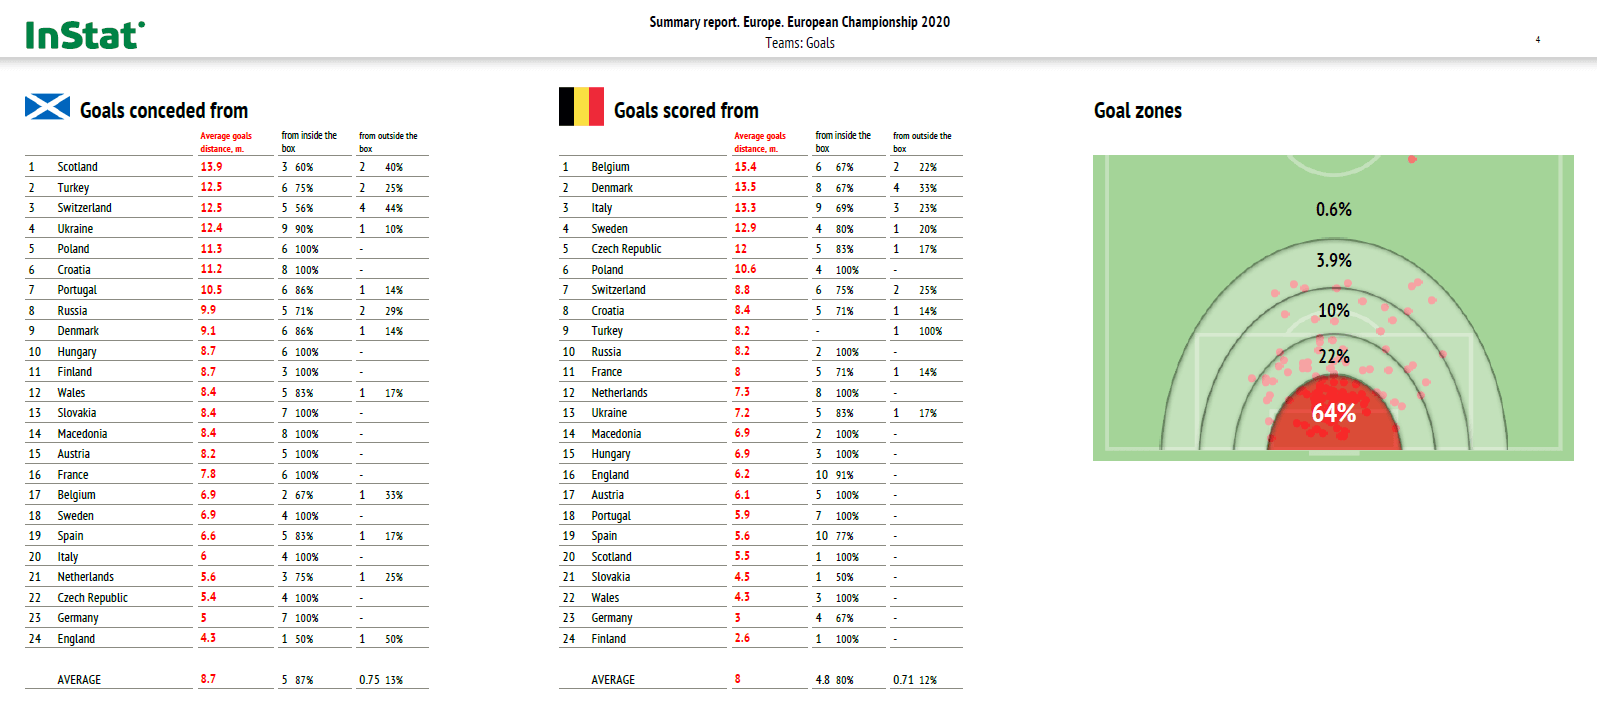
The first image from the InStat Euros Report gives us each nation’s goals conceded, goals scored and the goal zones/shooting locations. One of the key takeaways from this image is that the average goal was scored from approximately 8 m out. Of all goals scored in the tournament, 64% came from within 12 yards of the goal and 87% from inside the box.
Next, we have possibly the most interesting image from the report. The first column shows the duration of goal-scoring attacks. Moving from the top down, the first team on the list that did not make it to the knockout rounds is Poland, claiming the 12th position with an average of 22 seconds of possession on goal-scoring attacks. That gives us a nice break in the top half versus the bottom half of the list. In that top half, we have the possession dominant nations, most of whom topped the favourites list. Poland’s 22 seconds per goal-scoring attack represents the bottom of the top 12 while Belgium’s 41.5 seconds represents the highest mark.
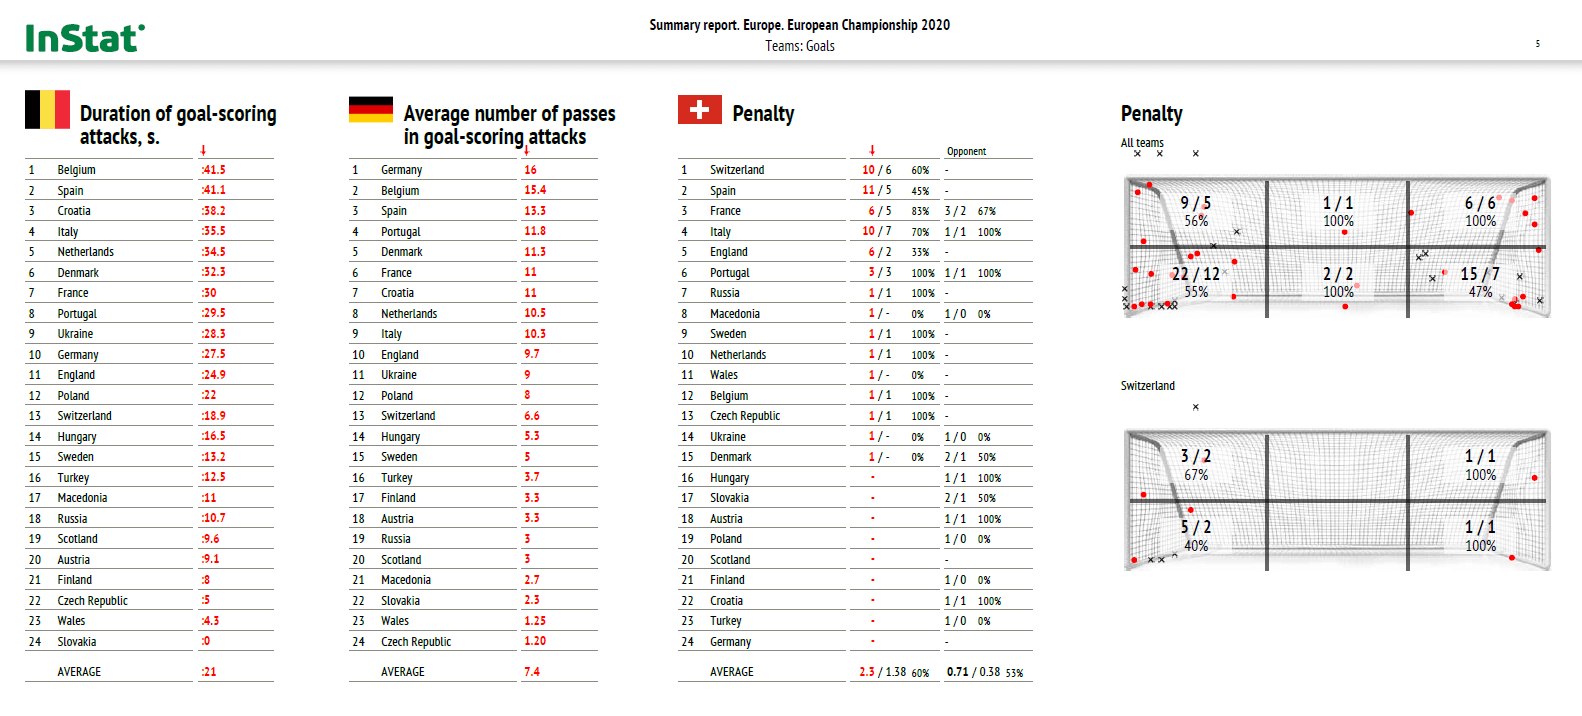
Meanwhile, the bottom half of the list is composed primarily of Group Stage eliminated nations. Among this group, Switzerland and Sweden are the outliers.
In terms of the average number of passes in goal-scoring attacks, the tournament average was 7.4 and once again we have Poland in the 12th spot, representing the first team to exit in the Group Stage.
Despite the counterpressing and direct attacking trends in the modern game, this image does show that the top nations in international play are afforded more time on the ball and require more passes to construct goal-scoring attacks. The favourites frequently encounter low blocks from the nations that squeaked into the tournament, so this is not necessarily a surprise. The lack of time available for tactical training and team cohesion also contribute to the problem. Without time to perfect the counterpress, high press and attacking transitions, the international game typically scales back to simplified, more universal tactics.
The last portion of the image addresses penalty kicks, which includes shootouts. Driven penalties into the lower corners were the norm, but they also had low success rates. Keep in mind that the xG for a penalty kick is 0.76. That’s well ahead of the tournament success rate, which is largely down to the psychological burden imposed on the players in shootout.
Looking at the types of goals, we find that 73% were scored in open play and 27% from set pieces. Within open play goals, 73% occurred in positional attacks and 27% from counterattacks. Breaking the pitch down into three vertical channels, the flanks were most commonly attacked in goal-scoring moves.
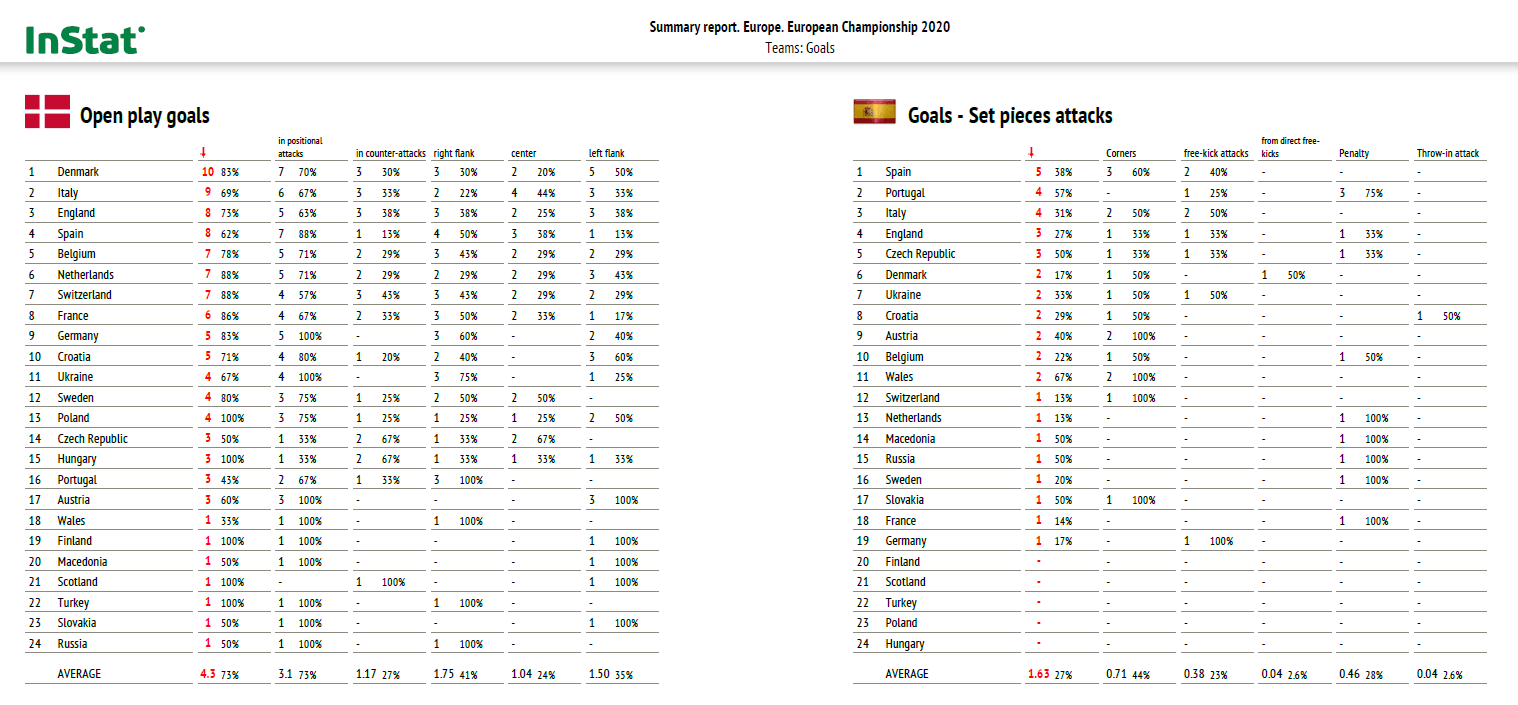
With regards to set pieces, 44% came from corner kicks, 23% from free kick attacks and 28% from penalty kicks. Additionally, Croatia managed to score from a throw-in attack and we all remember Serie A star Mikkel Damsgaard’s direct kick goal against England in the semifinals. Those two actions represent the lone goal contributions from their respective categories.
Finally, turning towards shots, chances and total actions, we find Spain at the top of each category. Their 18 shots per match set the tournament standard. Looking specifically at our finalists, Italy averaged 16.4 shots per game while England had the fourth-worst mark at just 8.6.
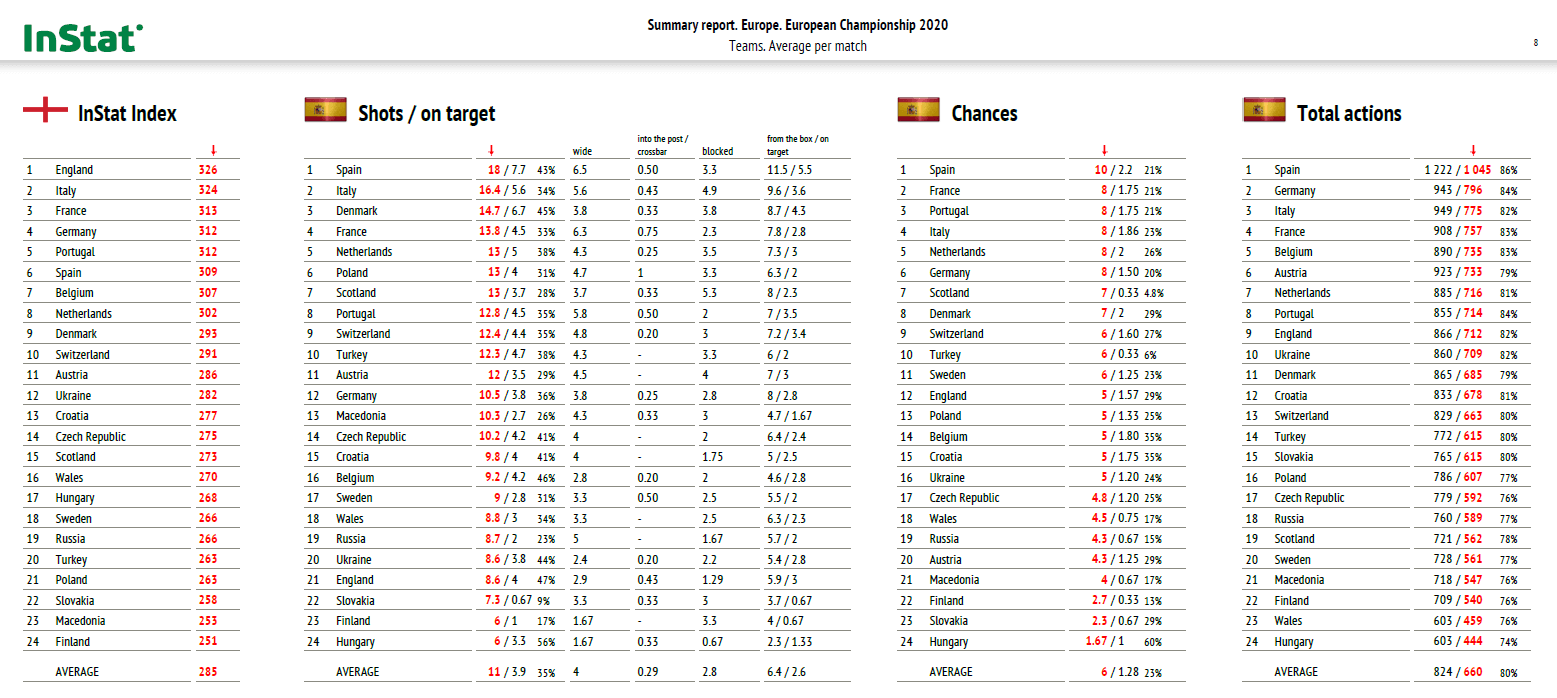
The runners-up did much better in the chances category tying for 12 with five chances produced per game. After Spain’s mark of 10, France, Portugal, Italy, the Netherlands and Germany each grabbed a claim to the second spot with eight chances per game.
Trends in possession
With a better understanding of how the goals were scored, let’s turn our attention to possession trends. We’ll look not only at total ball possession for the tournament but also attacking zone entries, the types of attacks, field utilization and pass specific statistics.
If you guessed Spain was the tournament’s top team in possession percentage, don’t expect a trophy, pat on the back or even a handshake. You might get a nod of approval. But that’s it. Their supremacy in the category was so obvious they beat the second-place team, Germany, by 9%. Group of Death participants Hungary brings up the rear with 31%. Another major sticking point is that 13 of the 16 teams to advance to the knockout rounds held 49% possession or better. The Czech Republic (47%), Wales (40%) and Sweden (36%) were the only three teams to advance without a minimum of 49% possession per match.
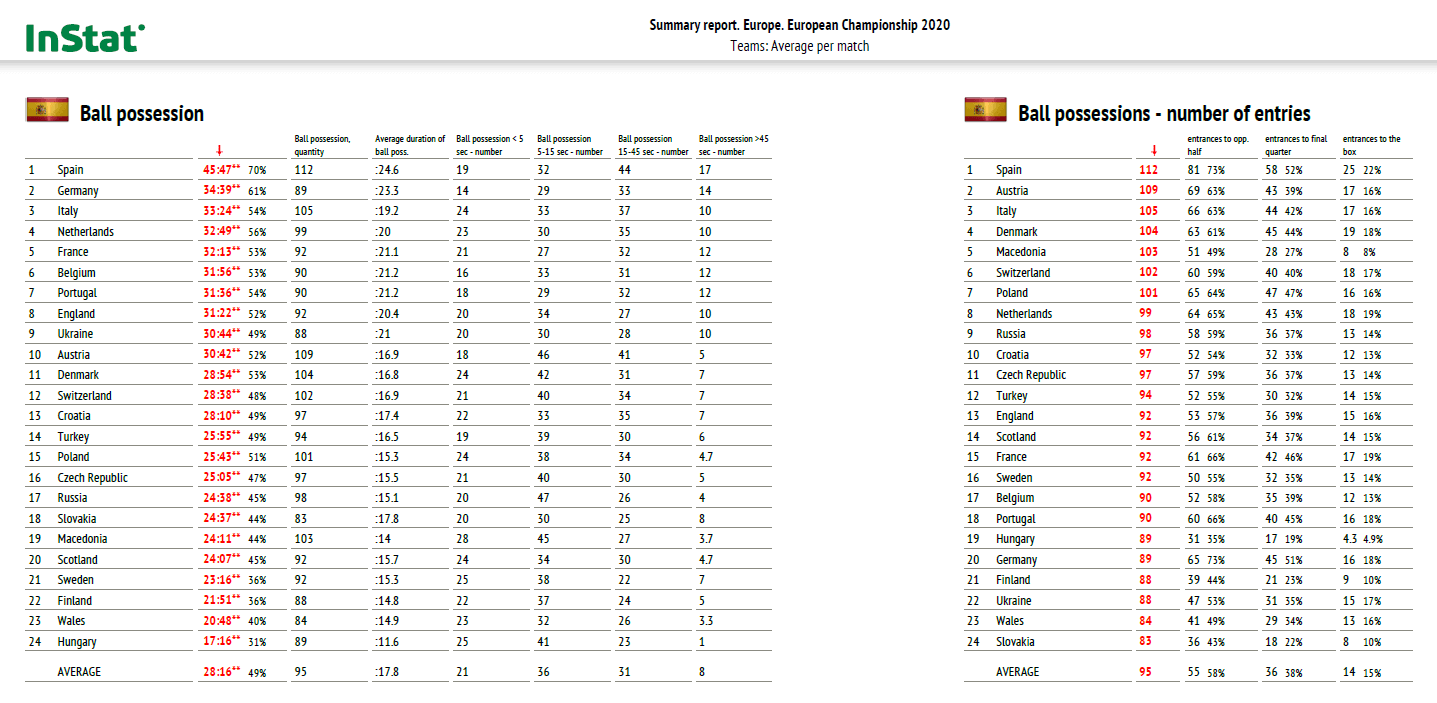
In terms of the types of attacks and the areas in which they occurred, we get a better idea of the way teams tend to attack and the types of attacks that were more successful in leading to shots. Italy and France saw 15% of their positional attacks result in shots, 50% better than the tournament average, whereas England and Hungary were the least effective in positional attacks with just 7% leading to shots.
Looking at counterattacks, the Netherlands averaged 15 per game, tops in the tournament, but only 16% ended with a shot, just below the tournament average. Turkey only averaged nine counterattacks per game, but 30% resulted in a shot, the top mark and the tournament. Other successful teams include Switzerland’s 26%, Portugal’s 25% and Belgium’s 24%.
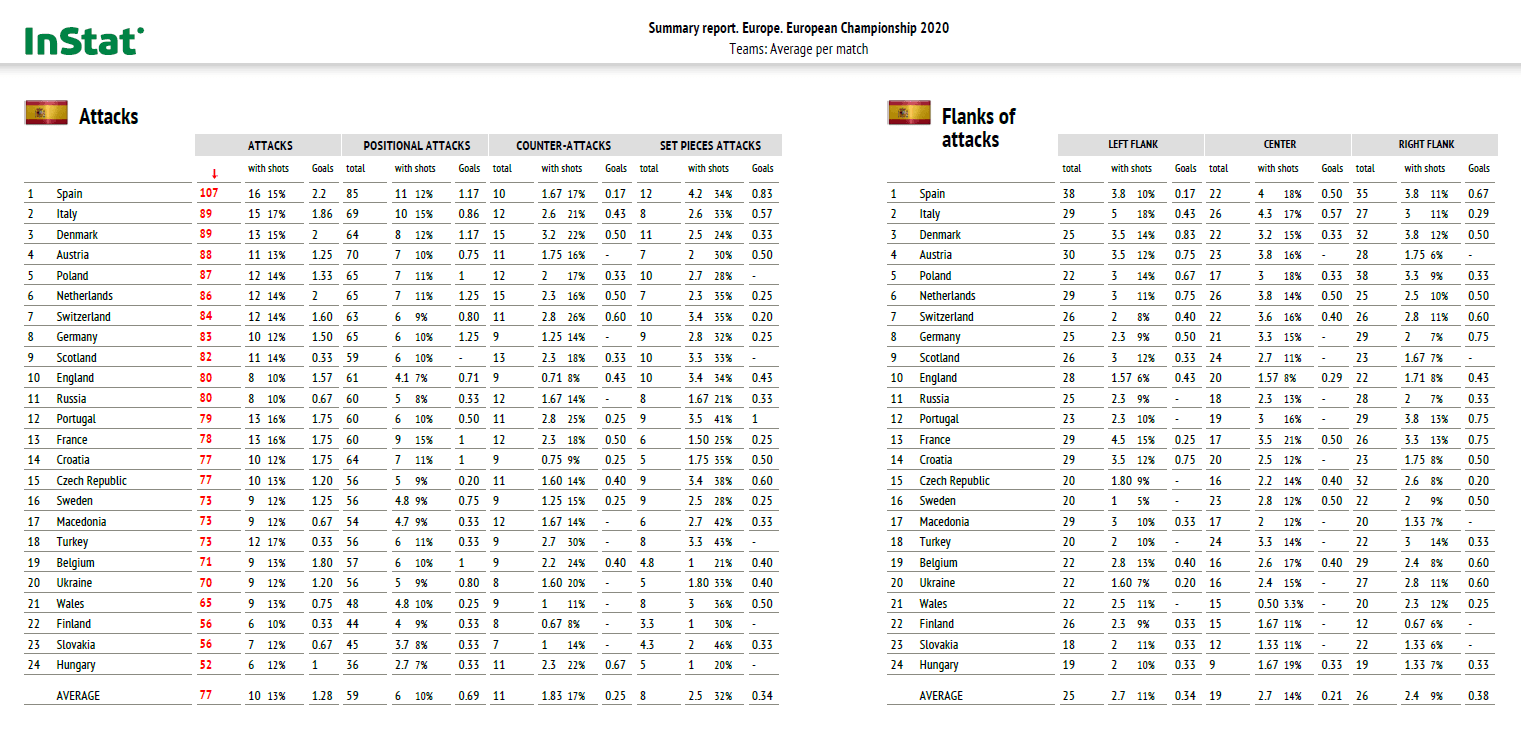
The nations with the greatest success on set pieces were Slovakia (46%), Turkey (43%), Macedonia (42%) and Portugal (41%). The Portuguese averaged the most set piece goals per game with one.
Connecting the attacks and flanks of attacks charts, we get a nice sense of not only how each nation tended to attack, but where they targeted the opposition. Spain tended to play outside of the press in the wings whereas Italy diversified with nearly equal representation of the three vertical segments of the pitch. Even among teams with a low percentage of positional attacks and greater reliance on counterattacking, we tend to see a preference for specific zones, such as Finland targeting the left flank and Hungry playing into the spaces vacated by the opposition’s outside-backs.
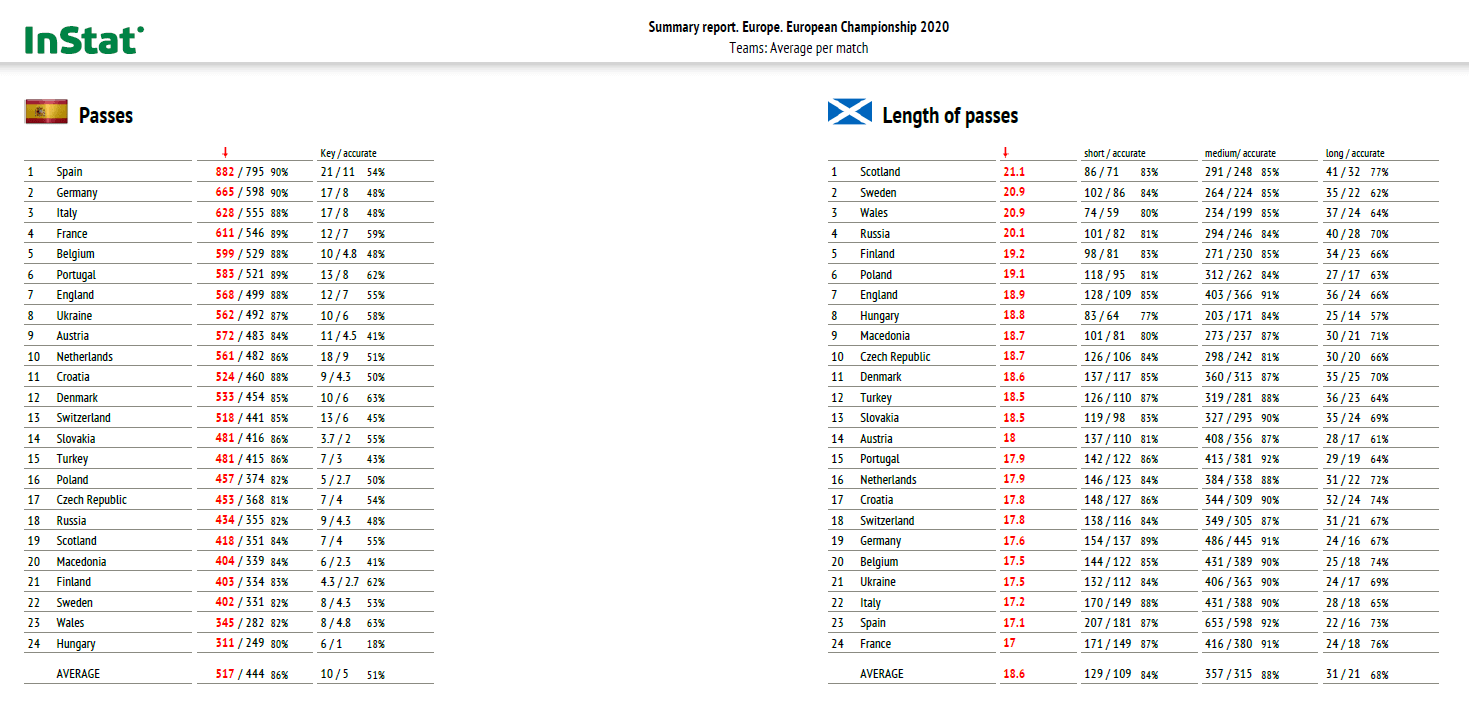
Knowing how each team tended to attack, we can then look at the number of passes they played per match, as well as the length of their passes. Despite their scoring inefficiency, Spain not only had the highest number of passes per game, but they also averaged 21 key pass attempts, 11 of which were accurate. Given that they frequently pinned the opposition into the low block, it comes as no surprise that their average pass length was 17.1 m, the second shortest distance behind Frances mark of 17. These two charts correlate nicely with possession dominant versus non-possession dominant sides. The less possession or the further a team tended to sit back, typically the greater the length of their passes.
Our final image in the section examines passes into the penalty box, crosses and speed of accurate passes (tempo). Interestingly, it’s Spain and Poland who share the top two spots in passes to the penalty box and crosses. Not only did Spain have the highest number of passes into the box per match, but their 50% success rate was above average as well. Perhaps the biggest surprise in the passes to the penalty box category is the number of elite teams nations outside of the top 10. England, Portugal, France, Belgium and Croatia ranged from 12 to 19.
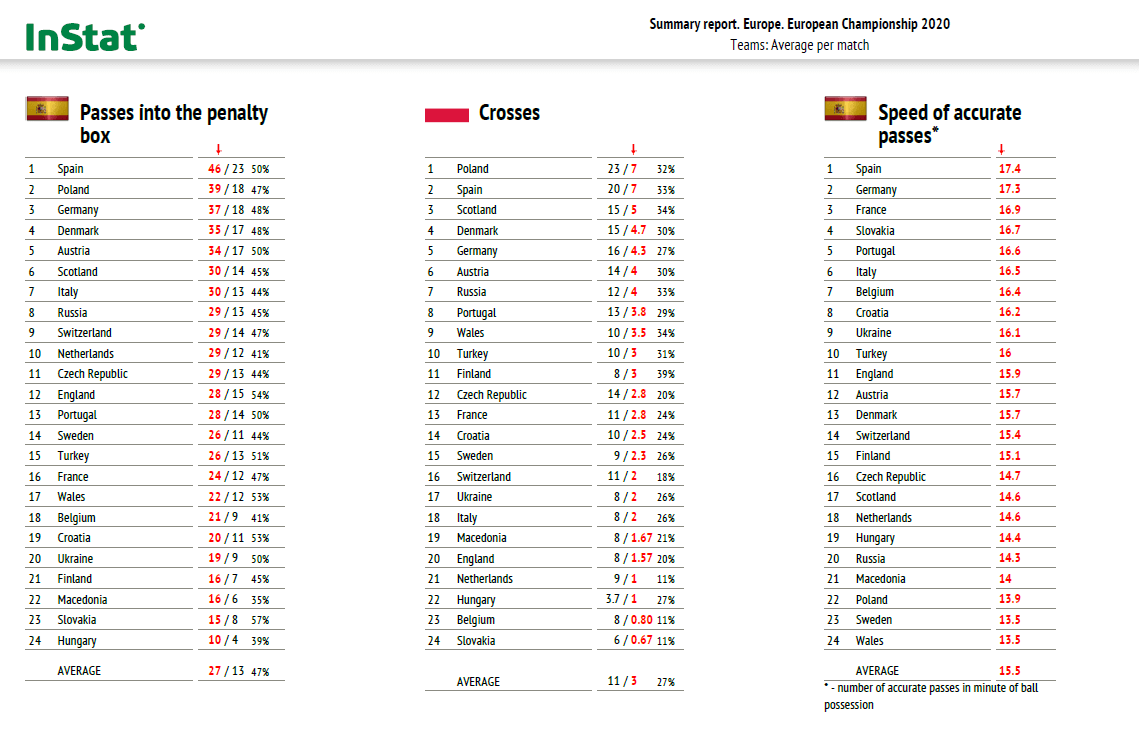
Teams that tended to cross either enjoyed the presence of a forward with a significant aerial threat or frequently pinned their opponents in the low block, reducing access to the central channel and half spaces for ground entries.
Last is tempo, which is the number of accurate passes in a minute of ball possession. The tournament average was 15.5, meaning 13 teams circulated the ball above the mean. Again, we see the teams who tended to progress are in the top half of the data set, though there are certainly some exceptions, such as Sweden and Wales with marks of 13.5. A reason for the low tempo could be the use of the dribble. Real Sociedad’s Alexander Isak and the Real Madrid star turned Tottenham loanee, Gareth Bale, were often asked to progress the attack via the dribble, reducing the number of passes completed per minute.
Defensive work
Transitioning to the defensive metrics, we’ll ease our way in with a look at challenges, both defensive and attacking. After that, we’ll look at tackles, interceptions and picking up free balls, then wrap up the section with losses and recoveries with attention given to the average position of each.
Russia led the way in challenges success rate, thanks largely to their 56% success rate in the attacking category, which is well above the tournament average of 46%. The top five in challenges percentage is an interesting group composed of two teams that were eliminated in the Group Stage and three who made their exit in the Round of 16. Scotland and Spain were the tournament’s winners in their percentage of successful defensive challenges, registering a mark of 61%.
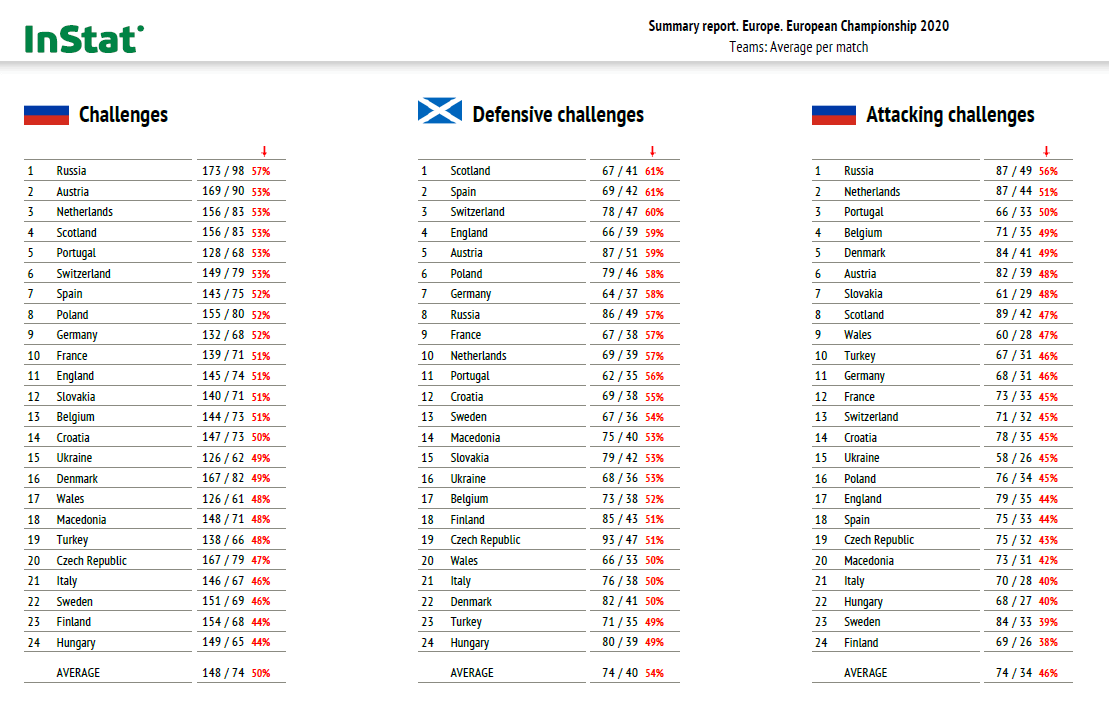
Looking at the more traditional defensive statistics, Austria averaged the highest number of tackles per game with 42, but it was the 68% success rate of the Germans and Spanish, followed by 66% from the Portuguese, that offered the highest success rates in the tournament.
With regards to interceptions, teams that held lesser percentages of possession dominate the category. The interesting exception is Italy which came in sixth with 49 interceptions per game, 11 of which came in the opposition’s half. Spain was the most successful in regaining possession in the opposition’s half with an average of 17 per match.
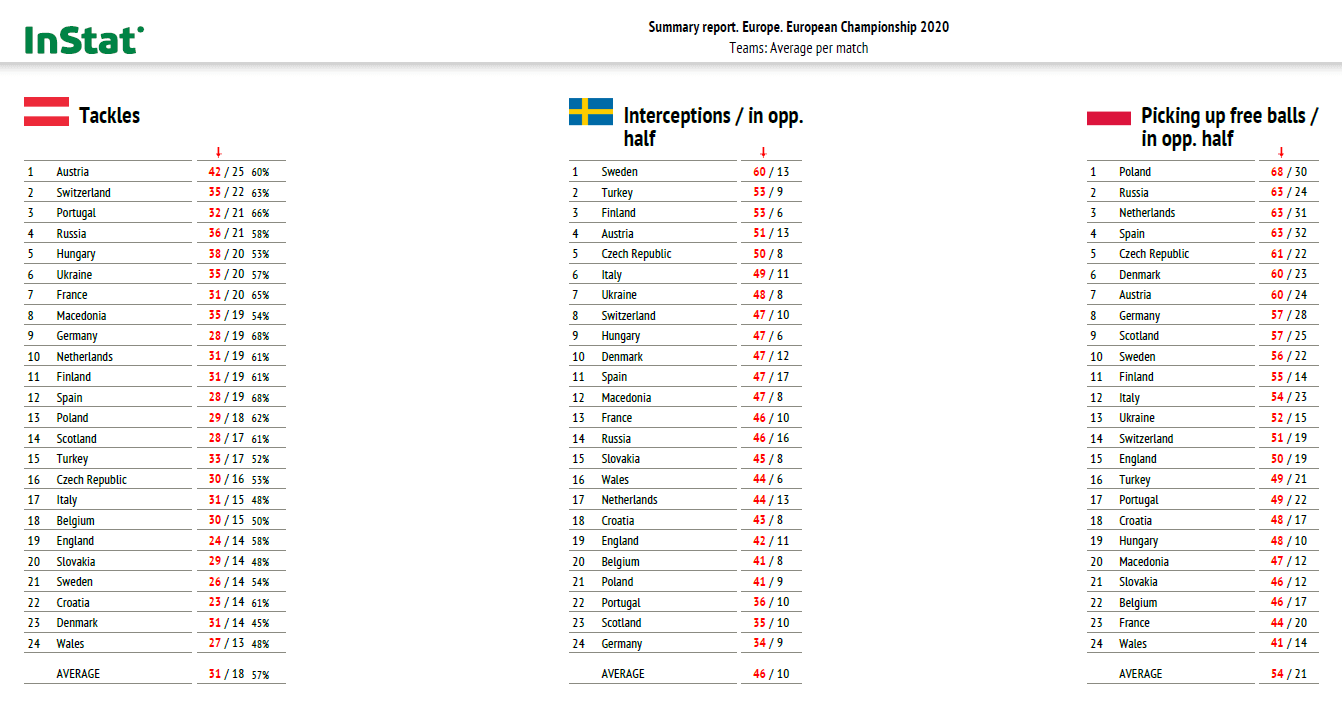
Poland, Russia, the Netherlands and Spain were the top teams in picking up free balls. Poland was especially resourceful with 30 of their 68 coming in the opposition’s half.
The final categories for the section are lost balls and ball recoveries. The image gives both the total amount as well as own half losses and opposition half recoveries. On average, Germany lost possession closest to the opposition’s goal at 35.2 m. At the other end of the spectrum is their Group of Death colleague, the Hungarians, who were 49.1 m from the opposition’s goal during losses on their average possession.
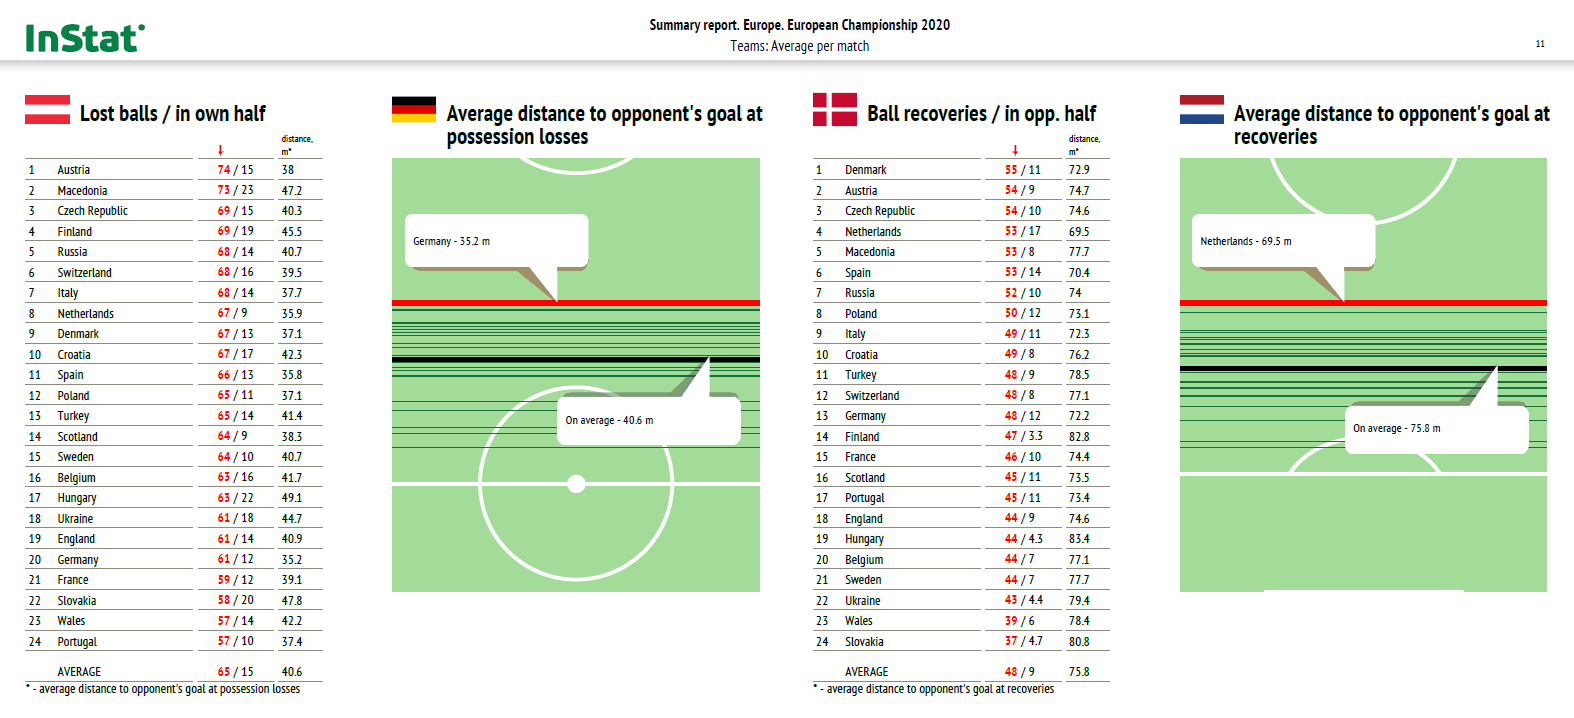
The Netherlands are the side with the highest recoveries for the tournament, averaging 69.5 m from the opposition’s goal which is again in contrast to Hungary’s total, the competition’s worst mark at 83.4 m. Note that the average recovery was 75.8 m from the opposition’s goal.
Set pieces
Finally, we come to set pieces. Though there’s only one image in this section of the report, there were a number of excellent Twitter threads detailing the intricacies of set piece routines. Our own Cam Meighan contributed to football Twitter’s set piece education with several high-quality threads detailing attacking and defending principles of set pieces. We highly recommend you check them out.
Turning to our statistics in the image below, Switzerland led the tournament with 7.4 set pieces per match with a 32% success rate, impressive given their frequency and the 27% average success rate. For the tournament, Finland had the highest success percentage at 50%, but they also averaged just 0.67 set pieces per match, easily the tournament low, suggesting a flash in the pan scenario.
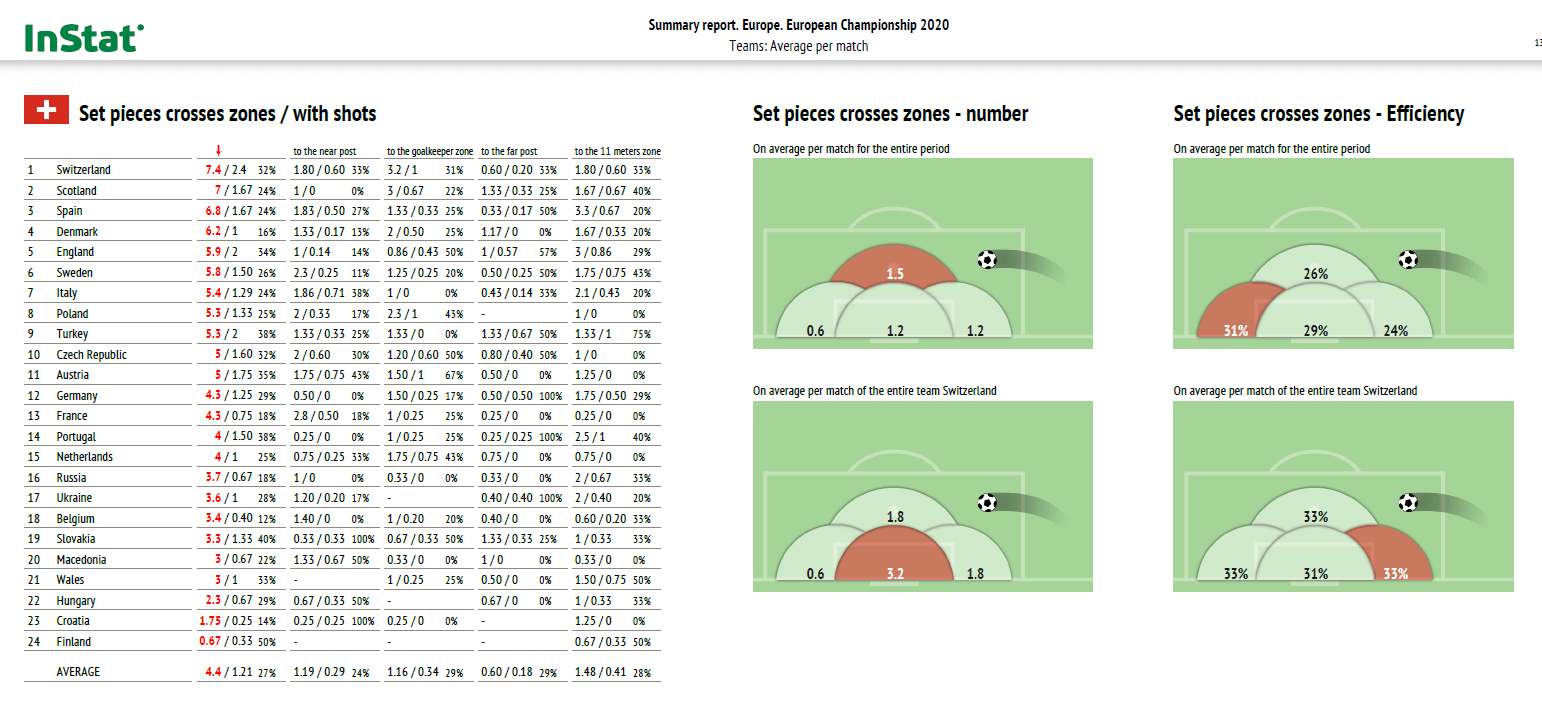
Targeting nations that had a higher frequency of set pieces and a greater percentage of success, Turkey, Portugal, Austria and England are the standout nations. The beauty of these four nations is that each had a different preference in their approach to set pieces. Turkey diversified their targets, Austria showed a slight preference for the near post followed by the goalkeeper zone, then you have Portugal and England who strongly preferred to attack the 11 m zone. Circling back to the Swiss, they attacked the goalkeeper’s zone 3.2 times per match.
It’s the 11 m zone that was attacked most frequently in the tournament but the far post offered teams the greatest success. Personnel will inevitably have a role in set-piece preferences, such as England’s screening of Harry Maguire in the 11 m zone, but this data analysis courtesy of the InStat Euro Report gives coaches and analysts an idea of the top teams to study in preparation for the club season.
Conclusion
A blistering tournament that consistently provided intriguing matchups and storylines, the Euros were exactly what the globe needed more than a year into pandemic induced trials. While only the Italians can revel in the joy of hoisting the trophy, most of us enjoyed it thoroughly.
There were some interesting data trends to come out of the tournament, such as the significant divergence in the number of passes and the duration of possessions in goal-scoring moves from the club game. At the club level, goals typically come at a much more efficient rate. On the surface, this could come down to the lack of training time and tactical cohesion in the international game, but the expanded field and discrepancies in talent from the top teams to the bottom will also play a factor.
Certainly one area that’s ripe for further analysis is a psychological impact of a knockout tournament. Though possessions tended to last for longer periods of time and include more passes than at the club level, there’s also the risk element of conceding. When one goal against can end your tournament run, there’s a natural element of fear and risk aversion at the forefront of the mind, both from the players and the coaches.
We’ll leave those conversations for another day. For now congratulations Italy. Europe eagerly awaits 2024 and the opportunity to take the crown.


Comments