“Messi is playing poorly.”
“Benzema doesn’t look right.”
“Enzo Fernández doesn’t look like he’s everything the pundits made him out to be.”
Just a few of the lines we’ve heard in the months following the 2022 World Cup. Thinking back to previous international tournaments, comments like these seem the norm. Whether we’re blaming international tournament-induced slumps on fatigue or praising the momentum generated by a strong summer showing, we hear many ear-test conclusions following major international cups.
But which are fact and which are fiction?
That’s the aim of this data analysis. We’re going to look at the numbers from recent seasons following the World Cup, Euro and Copa América. Before asserting causes for increases or decreases in performance, we’ll break down the numbers to discover if there are performance trends following international tournaments.
World Cup 2022 Before and After
The natural starting place is the 2022 World Cup, a unique event in its own right given the November and December calendar. Starting here will give us a concrete view of trends from the current season.
Looking at a direct comparison of the before and after statistics is ultimately where we want to go, but it’s equally important to identify which clubs had the greatest representation at the World Cup. On the one hand, the data will reveal which clubs are more likely to have suffered from tournament-induced fatigue. On the other end of the scale, the lack of competitive minutes could be an issue.
To identify where the clubs stand with regard to World Cup representation, our analysis looked at the number of total players each club lost to World Cup service and the total number of minutes played. The pool consists of players from the Bundesliga, EPL, La Liga, Liga Portugal, Ligue 1 and Serie A. As you might expect, the elite clubs have an excellent showing at the top of the table.
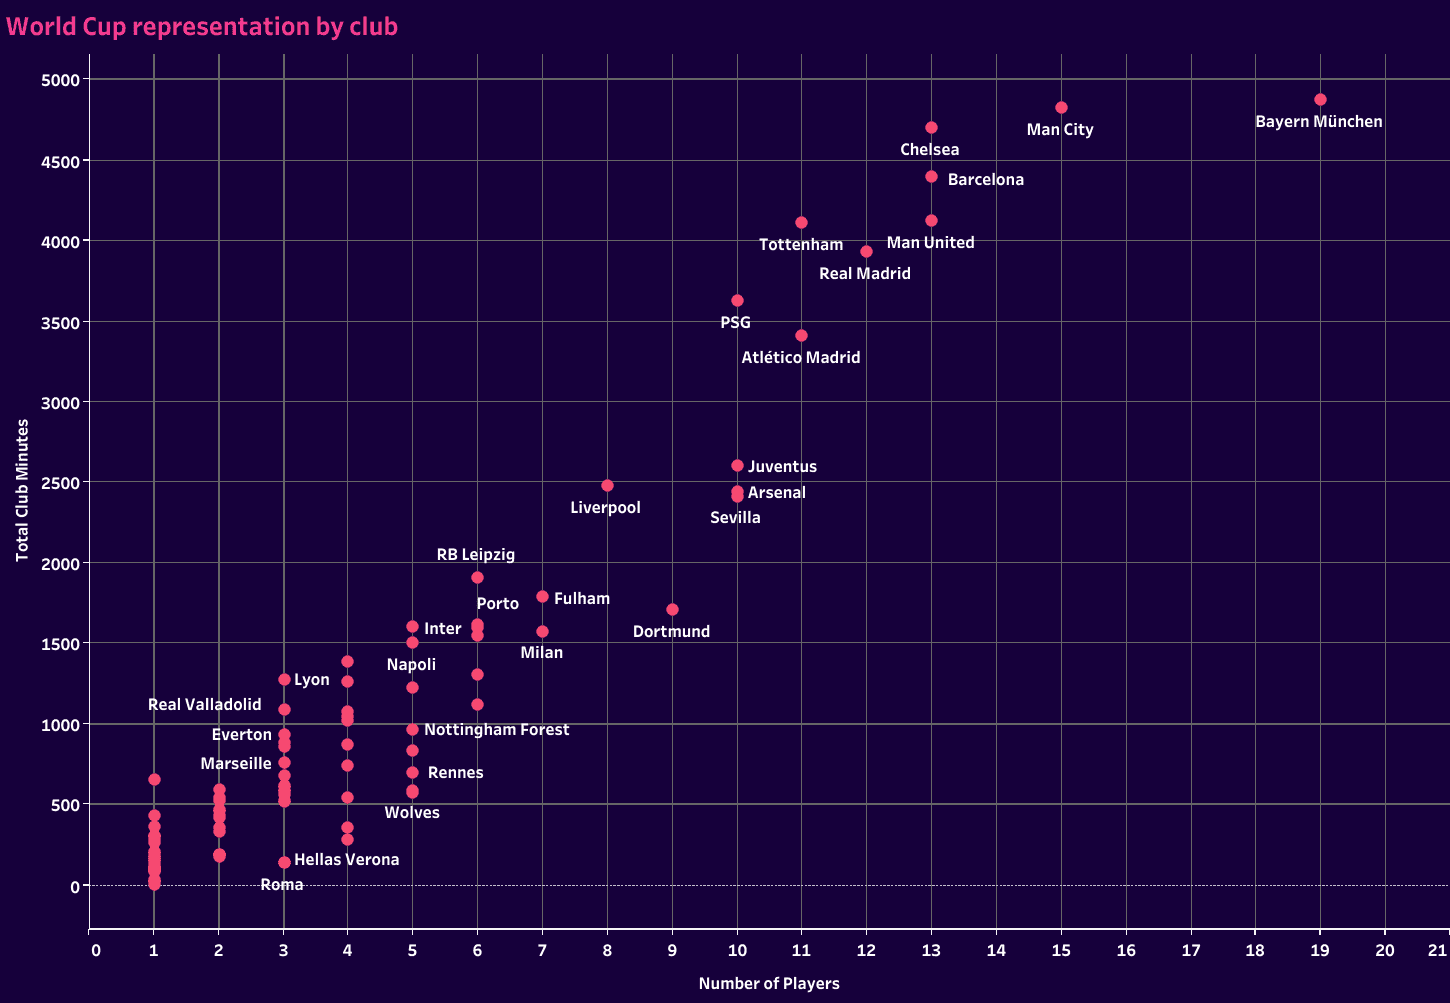
Bayern Munich led the way with 19 players and 4,874 minutes. Manchester City had the second-greatest representation with 15 players in the tournament and 4,826 minutes played, just 48 minutes less than Bayern. With the exception of Manchester United, Arsenal and Fulham, each of the most represented clubs, both in terms of total players and minutes, came from Champions League powers.
Knowing the total numbers is important, but we also want an idea of the average number of minutes for each club’s players. That gives us insight into which clubs saw key players log a higher-than-average number of minutes, offering a potential correlation to fatigue-induced performance decreases.
Josip Juranović of Union Berlin was the outlier, logging each of the 656 minutes claimed by members of the club. The Croatian international ranked 14th in total minutes played. Only Real Madrid (Luka Modrić and Aurélien Tchouaméni) and PSG (Lionel Messi, Kylian Mbappé and Achraf Hakimi) had multiple players with more minutes played than Juranović.
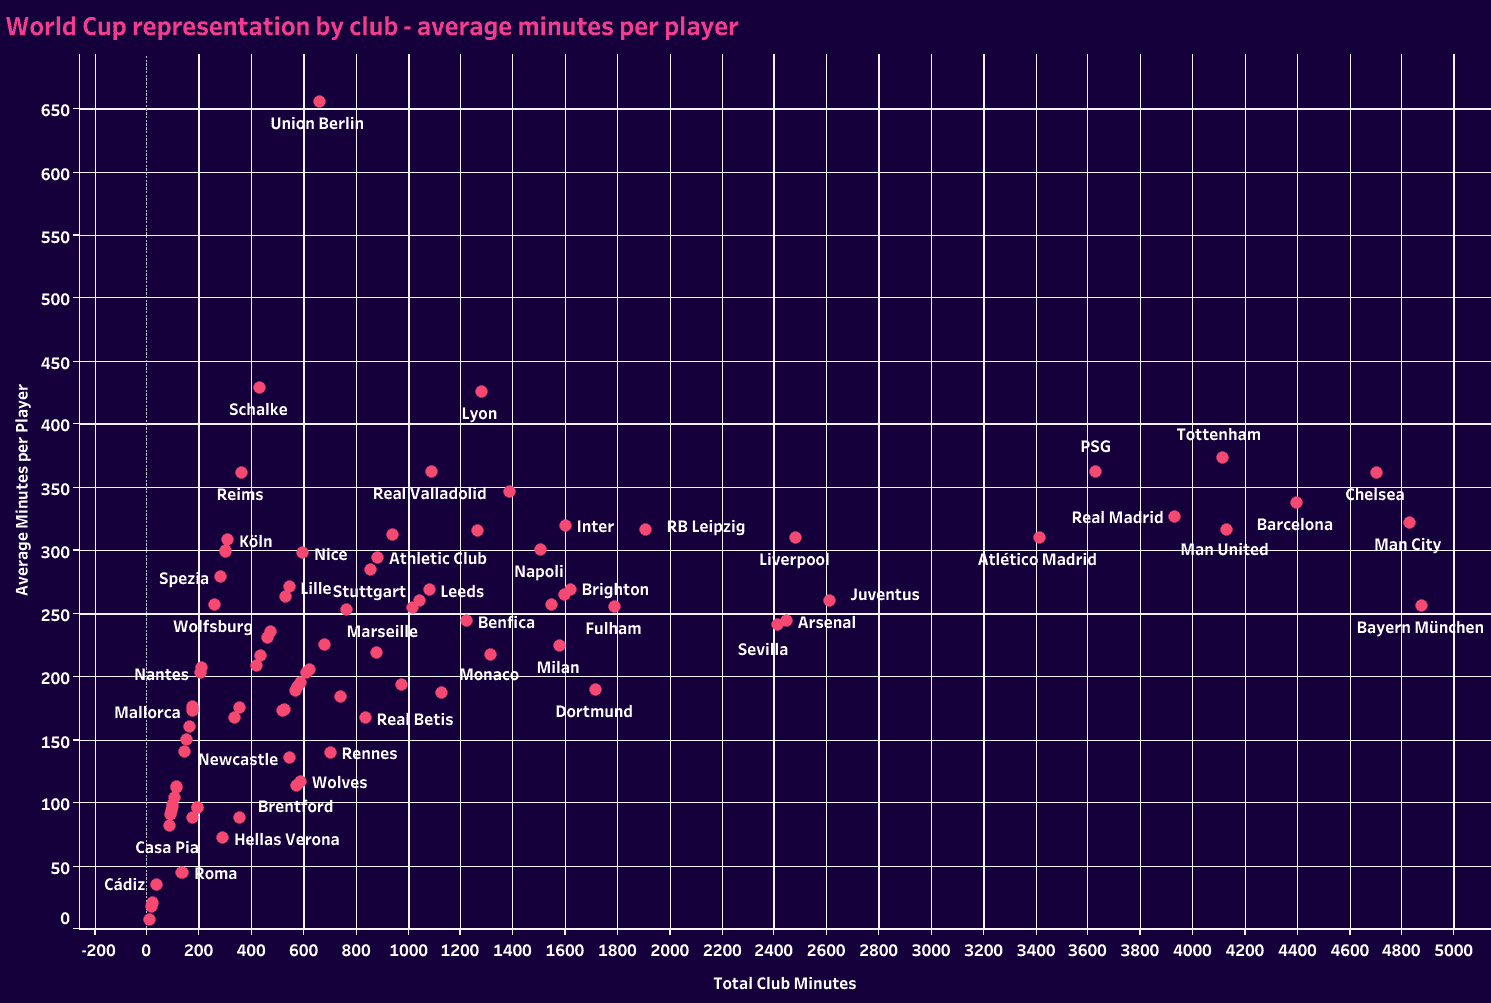
Beyond the elite clubs, Schalke, Lyon, Real Valladolid and Reims also saw above-average minutes from members of their squads. Despite the pace-setting representation, Bayern Munich had a very reasonable average of 257 minutes per player. Juventus, Arsenal and Sevilla fall into the same category, whereas Tottenham (374), PSG (363) and Chelsea(362) all rated near the top of the board in the average number of minutes per player.
With an understanding of club representation, let’s turn to the fun data…the before and after point per game totals at the 2022 World Cup. In the barbell chart, the pink circles represent each clubs’ points per game prior to the World Cup. In the yellow, we have the points per game for the entire season, as of mid-March. The goal is to identify which teams have fallen off their first-half pace. To target the top clubs and fit the image into the article, we’ll start with just the top 25 clubs in points per game.
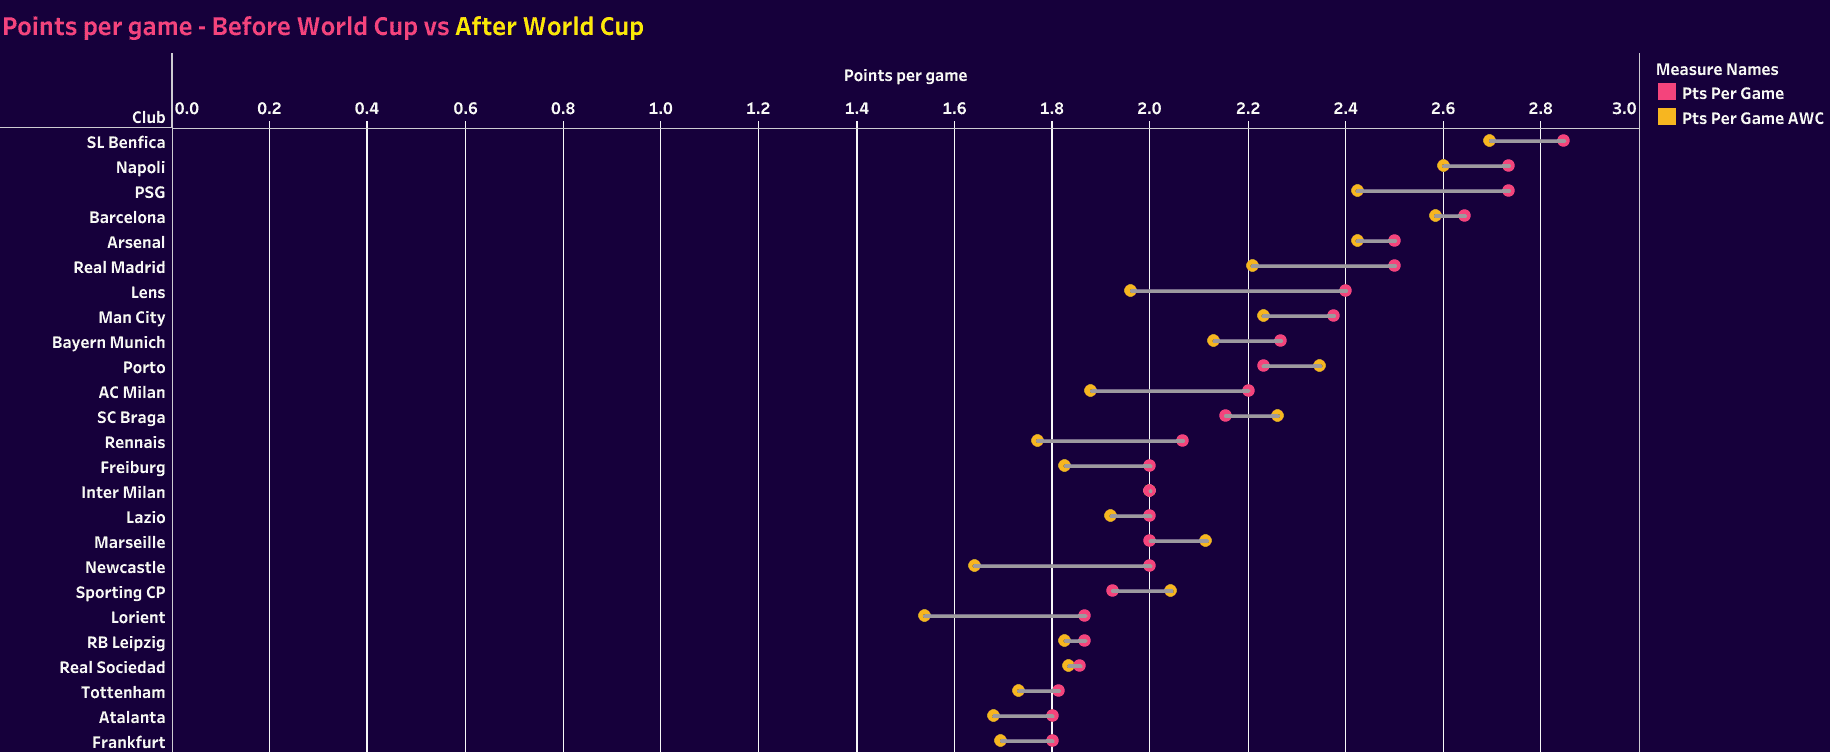
Of the top 25, 20 have experienced a drop-off in their point-per-game pace, including each of the six table-toppers. PSG’s slide has been the most severe of the group. Fortunately for them, Lens, Rennes and Marseille have stumbled as well. Though Chelsea and Tottenham didn’t make the top-25 cutoff, both have seen a decrease in their points per game average as well. Real Madrid’s significant decline is plain to see too. Inter Milan has maintained their pace while four teams have improved.
The negative impact on the top 25 seems conclusive, but what about the bottom 25? For the most part, these clubs had little or no representation at the tournament. Fatigue wouldn’t be an issue, but the lack of competitive minutes might.
Of the bottom 25, 16 saw points per game increases, eight clubs held relatively steady and Angers was the lone club to see a significant decline.
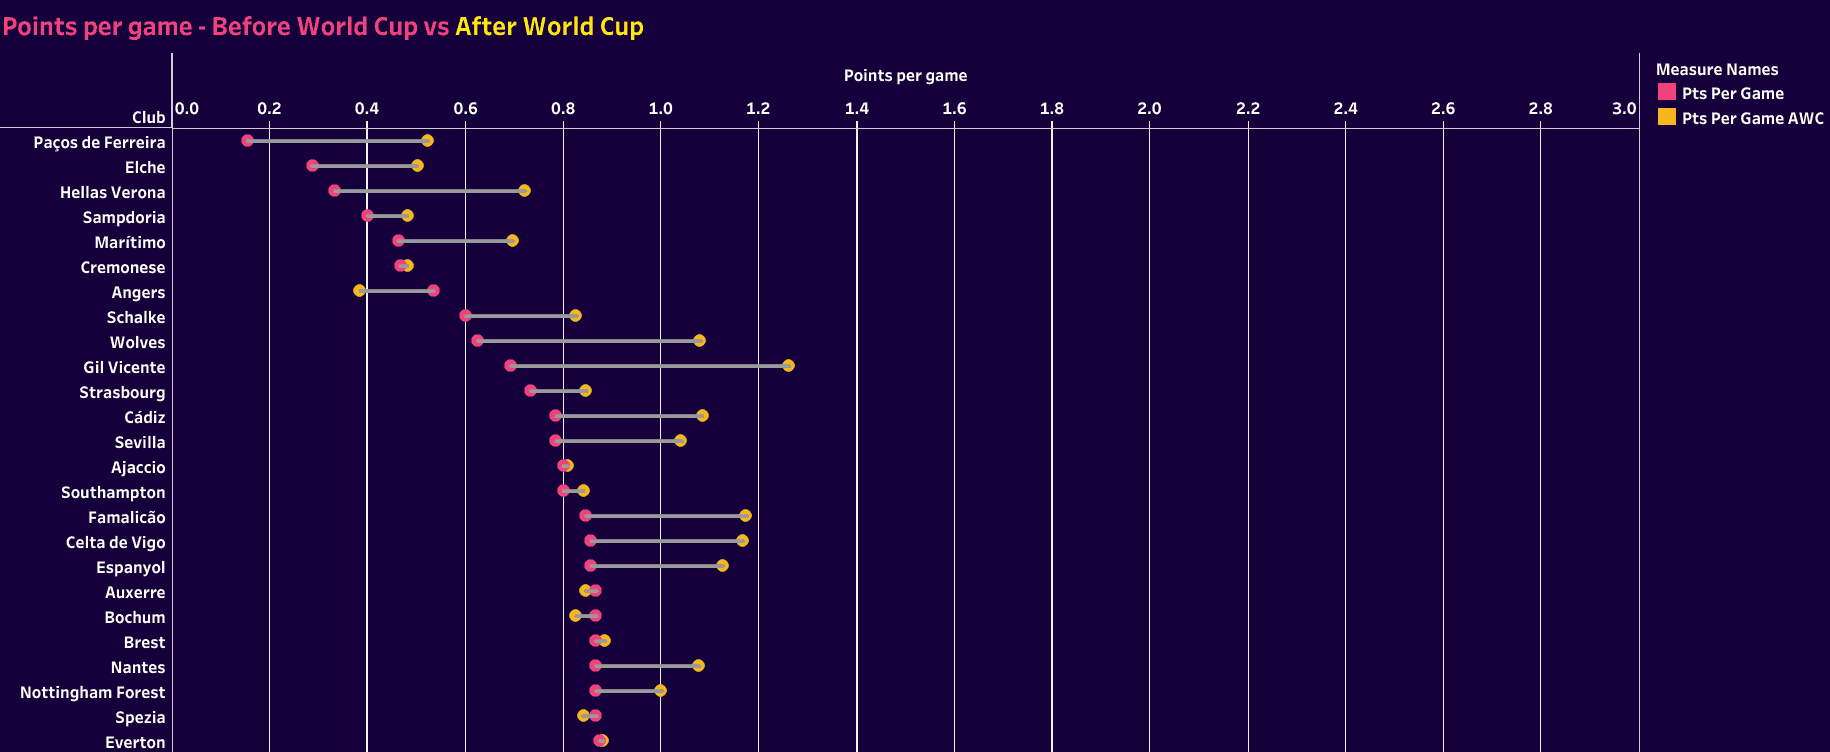
Fatigue and the post-tournament blues do seem to have a negative impact on club performances, whereas the bottom feeders have to look elsewhere for answers.
World Cup 2022 was unique. With the November and December tournament calendar, the drop-off from the top clubs makes sense. Their players had no time to recover. Once they arrived back at their clubs, they were thrust back into the action.
We need to continue our data analysis. With both Euro 2020 and Copa America 2021 happening in the same year (thanks, Covid), let’s look at the numbers from the 2021-22 campaign.
Euro 2020 and Copa América 2021 and the 2021-22 campaign
We’re going to move this analysis in another direction. The first section’s message is clear. Top clubs produce more international tournament participants than others. It’s a common sense take, but one that is now backed up by this analysis.
Rather than look at player representation by club and parsing out the minutes played, our course will look specifically at points per game, goals P90, and goals allowed P90. In fact, we’re even going to reduce the scope of leagues analysed. Since the EPL has significant international representation, they are now the main focus of our study.
Each of those categories has a corresponding graph with a monthly breakdown. Since August has so few games, the first month tracked was September, which typically saw each club play six or seven matches. Manchester City, Liverpool and Chelsea started well and finished top three. Nothing happening here.
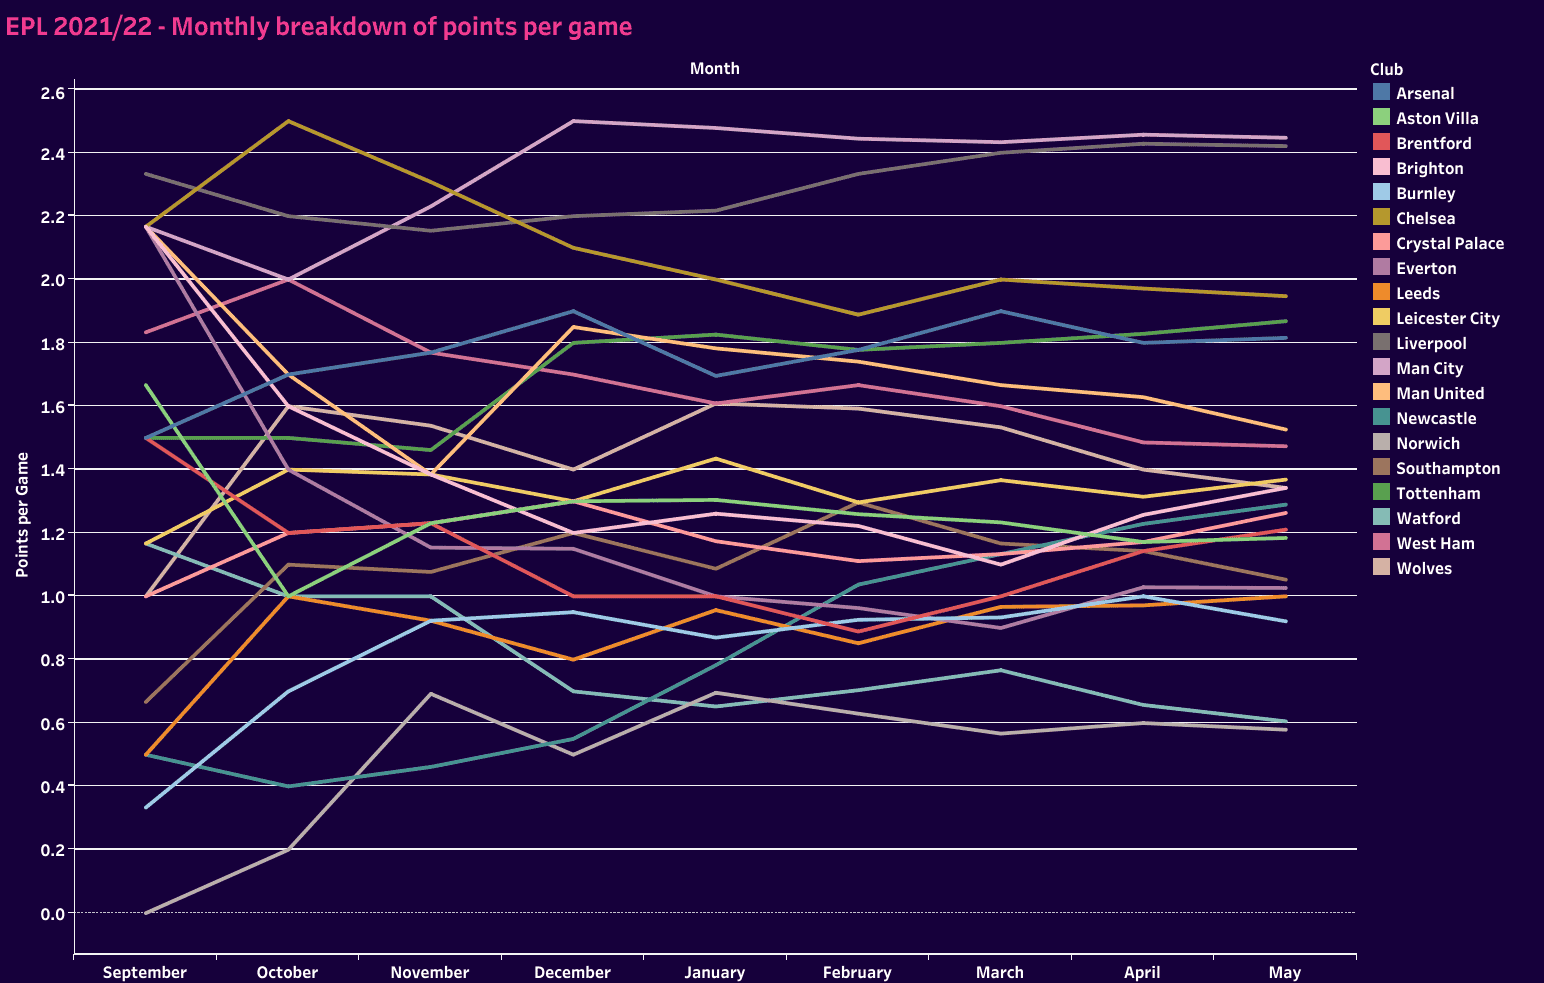
Manchester United started well, then played horrendously in October and November. Meanwhile, in London, Tottenham and Arsenal were mid-table teams at the end of September before gradually working their way into the 4th and 5th spots, respectively.
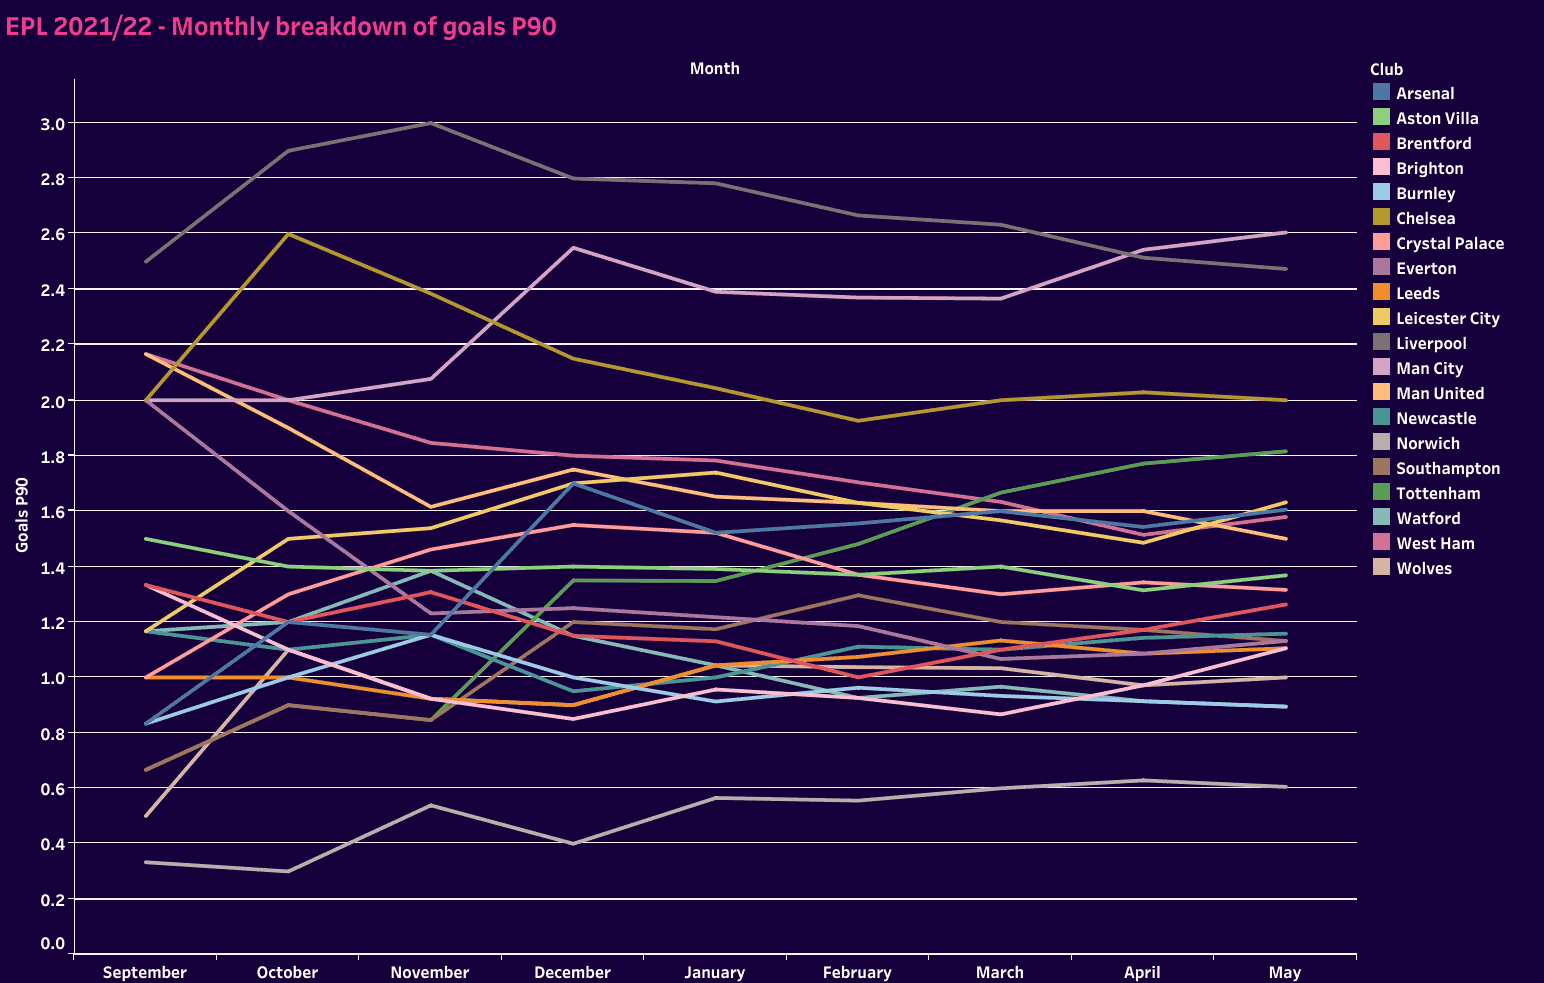
The goals P90 chart is an interesting one. Most clubs ended with numbers that weren’t far from their September stats. That said, most have a wild upward swing in either October or November followed by the inevitable decline. Manchester United’s decline was a multi-month event that only course-corrected in February, whereas Liverpool’s was a gradual decline from the November highs.
Whereas the goals P90 chart found similar starting and finishing numbers for most clubs, the goals allowed P90 was much more chaotic. Norwich started and finished in last place, but look at the improvement from a calamitous start.

At the other end of the chart, Manchester City and Liverpool went from stunningly good to somewhere closer to amazing. Chelsea was the consistent party, seeing very little deviation on a monthly basis. Tottenham managed to knock off 0.45 goals allowed P90 from September to the end of the season and their north London counterparts, Arsenal, improved by 0.41.
Goals allowed P90 was a volatile statistic. Whereas the attacking production was more predictable, albeit with slight dips and improvements in form, a club’s ranking in the table seems very closely tied to their defensive production. Arsenal and Tottenham are the two clearest examples.
Overall, two powerhouses, admittedly off the pace of the front three, staggered out of the gates before recovering. Manchester United was the lone top club to start reasonably well and then fade. 2021/22 is a bit of a mixed bag. It’s time to include more tournaments.
EPL seasons after following the 2014 and 2018 World Cups
We’ll take the same model as section two, but move into the post-World Cup campaigns of 2014 and 2018. Again, we’ll look at each clubs’ points per game, goals P90 and goals allowed P90. Like the last section, we’ll also stick with the Premier League.
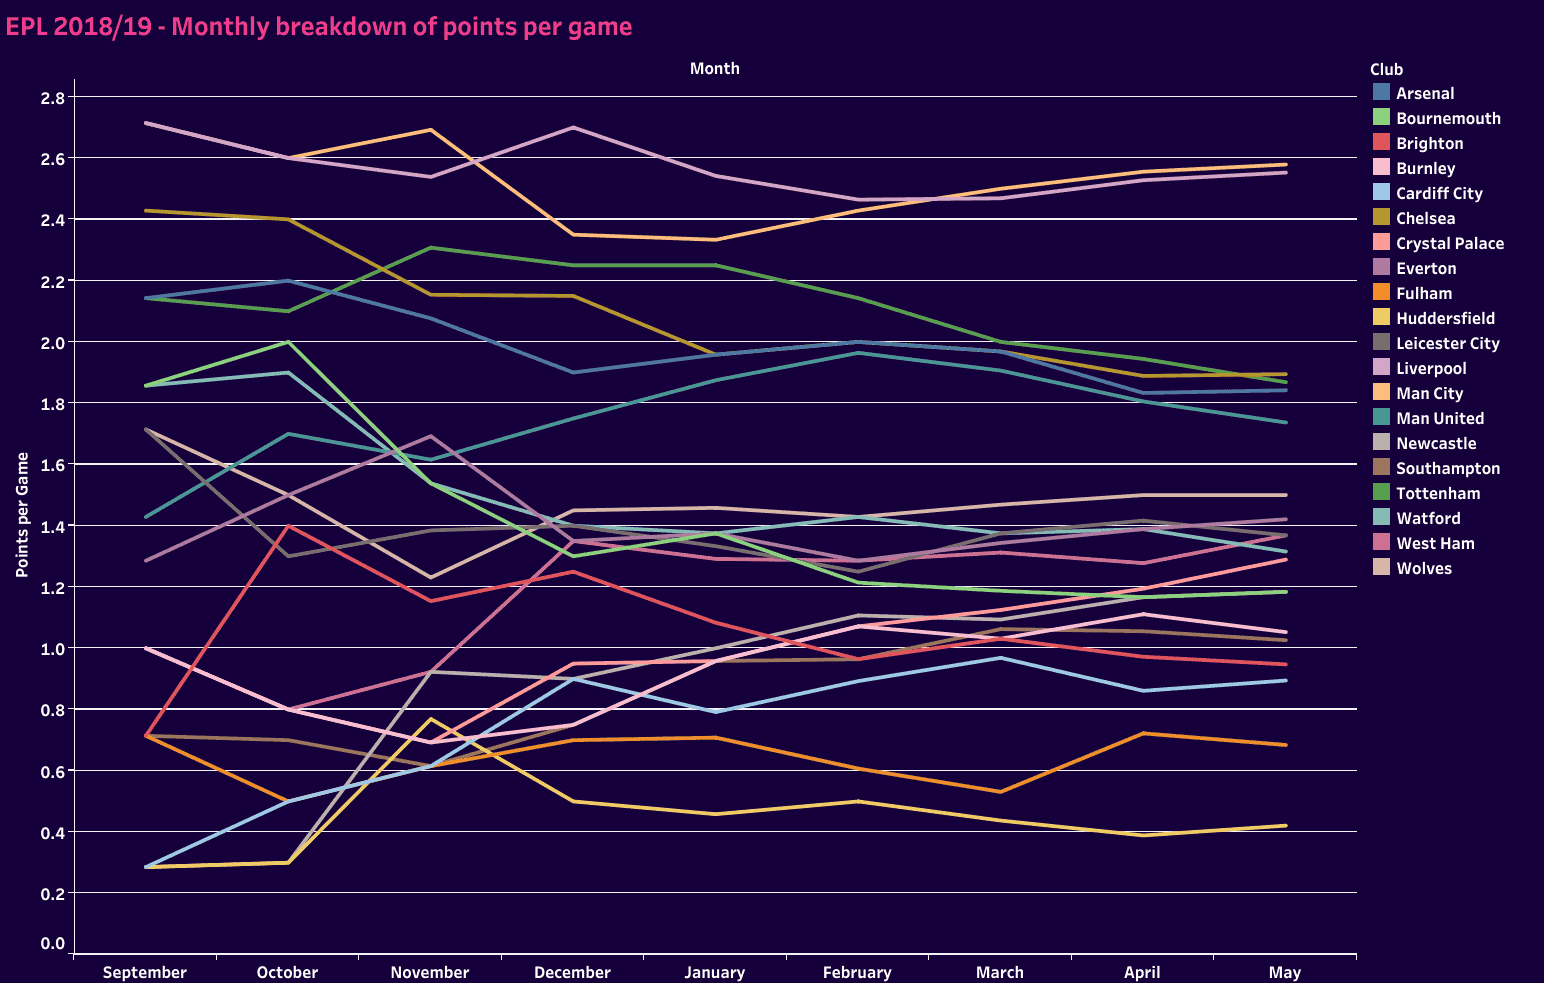
Jumping right into the data, in 2018/19, top clubs excelled out of the gate. International tournaments were not a burden. Rather, the month-long competition at the World Cup seemed to offer a boost. 2018/19’s point-per-game trajectory shows that top teams often finished close to their starting total. There is some difference between those two numbers though, and it’s the September metrics that are better than May for everyone except Manchester United.
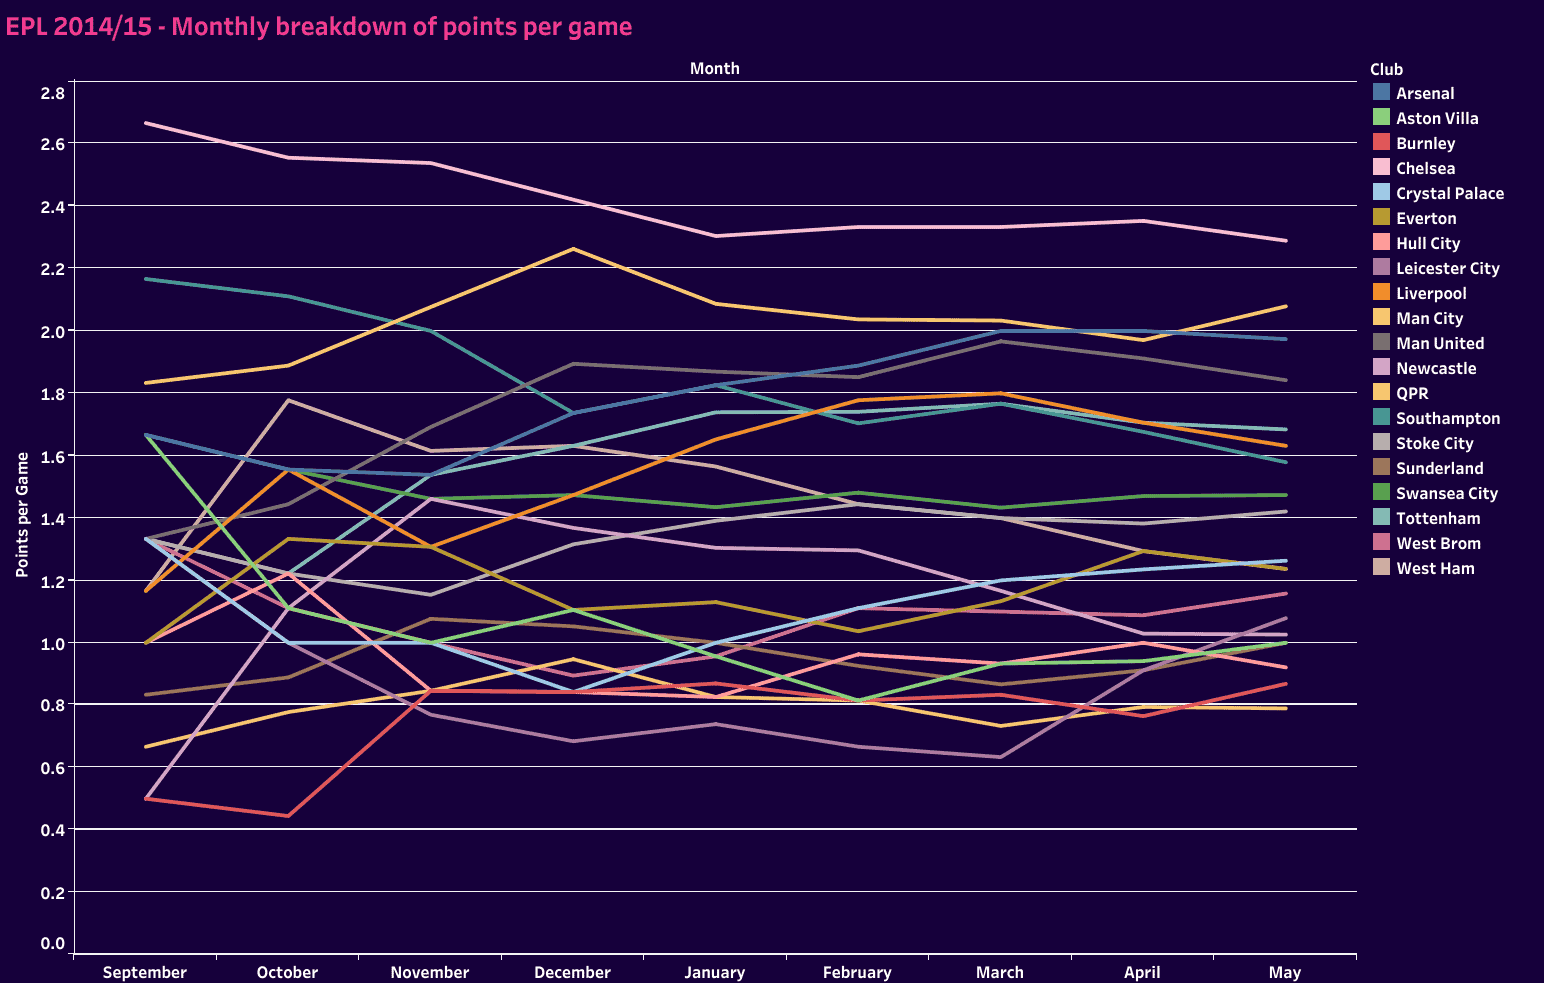
That’s in contrast to 2014/15. Both Manchester clubs, Arsenal, Tottenham and Liverpool all started poorly before recovering their points later in the season. Chelsea was really the only club to start well and see their points per game decrease.
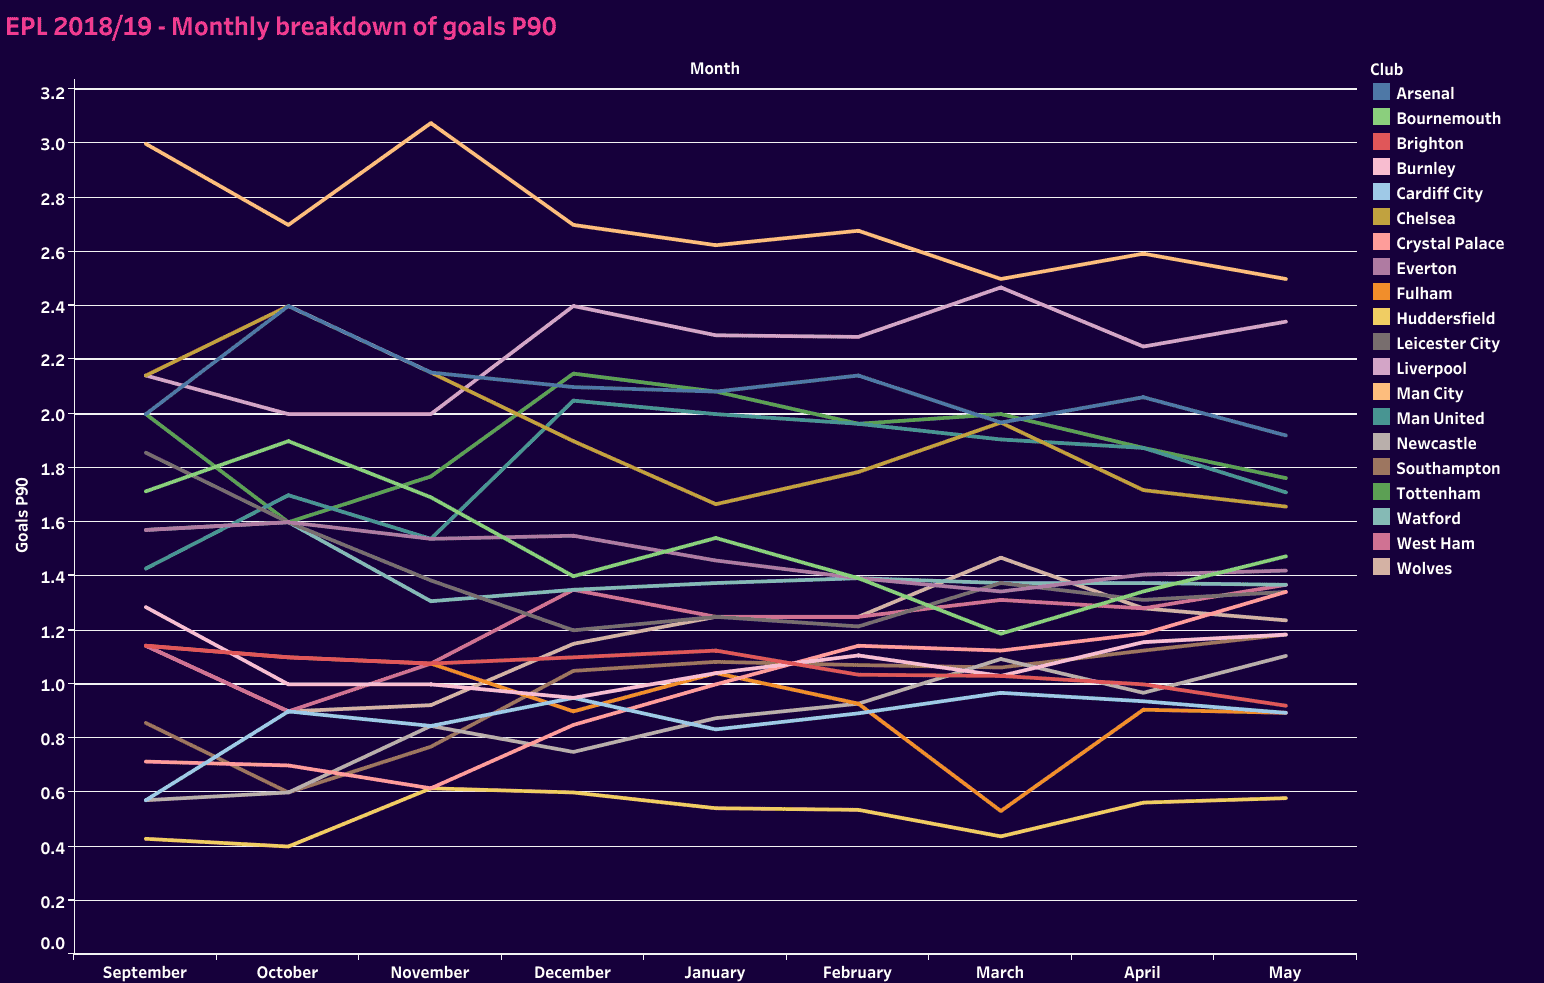
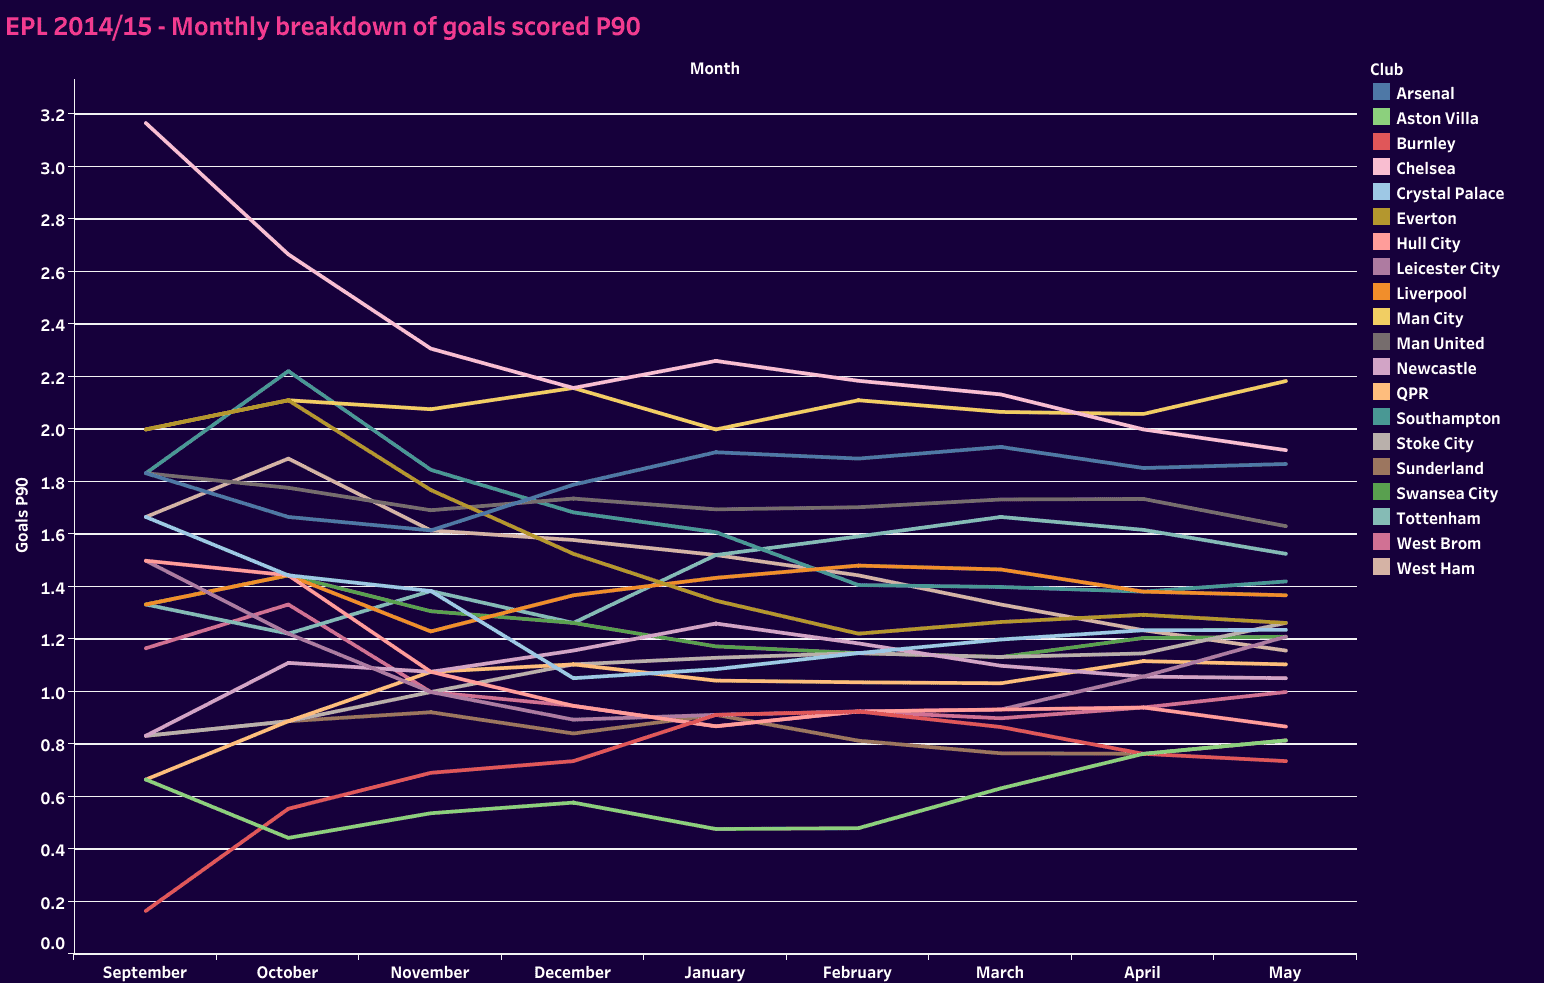
Looking at the goals P90 visual, first for 2014/15, of the Big 6 in England, only Chelsea started the season on a high and experienced diminishing returns. Each of the other five clubs improved their rate by the end of the season. There were ups and downs throughout the year, but the general trend was gradual improvement from start to finish. It’s worth noting that Arsenal’s late season was largely a product of their budding attacking play. As we’ll see in a moment, their defensive stats were a liability that season, so the attacking numbers catching up to the poor quality in defence was pivotal to their success. A poor start set them back, but a late charge saved European play.
Following the 2018 World Cup, Manchester City came flying out of the gates, averaging three goals per game. Arsenal, Chelsea and Tottenham would also start well, but all four teams saw declines in their goals P90 metrics. Meanwhile, Manchester United and Liverpool struggled early before finding their stride later.
In 2014/15, Chelsea started on a massive high before crashing back down to earth. Other than Tottenham’s small increase in attacking production, most of the other changes were negligible in either direction.
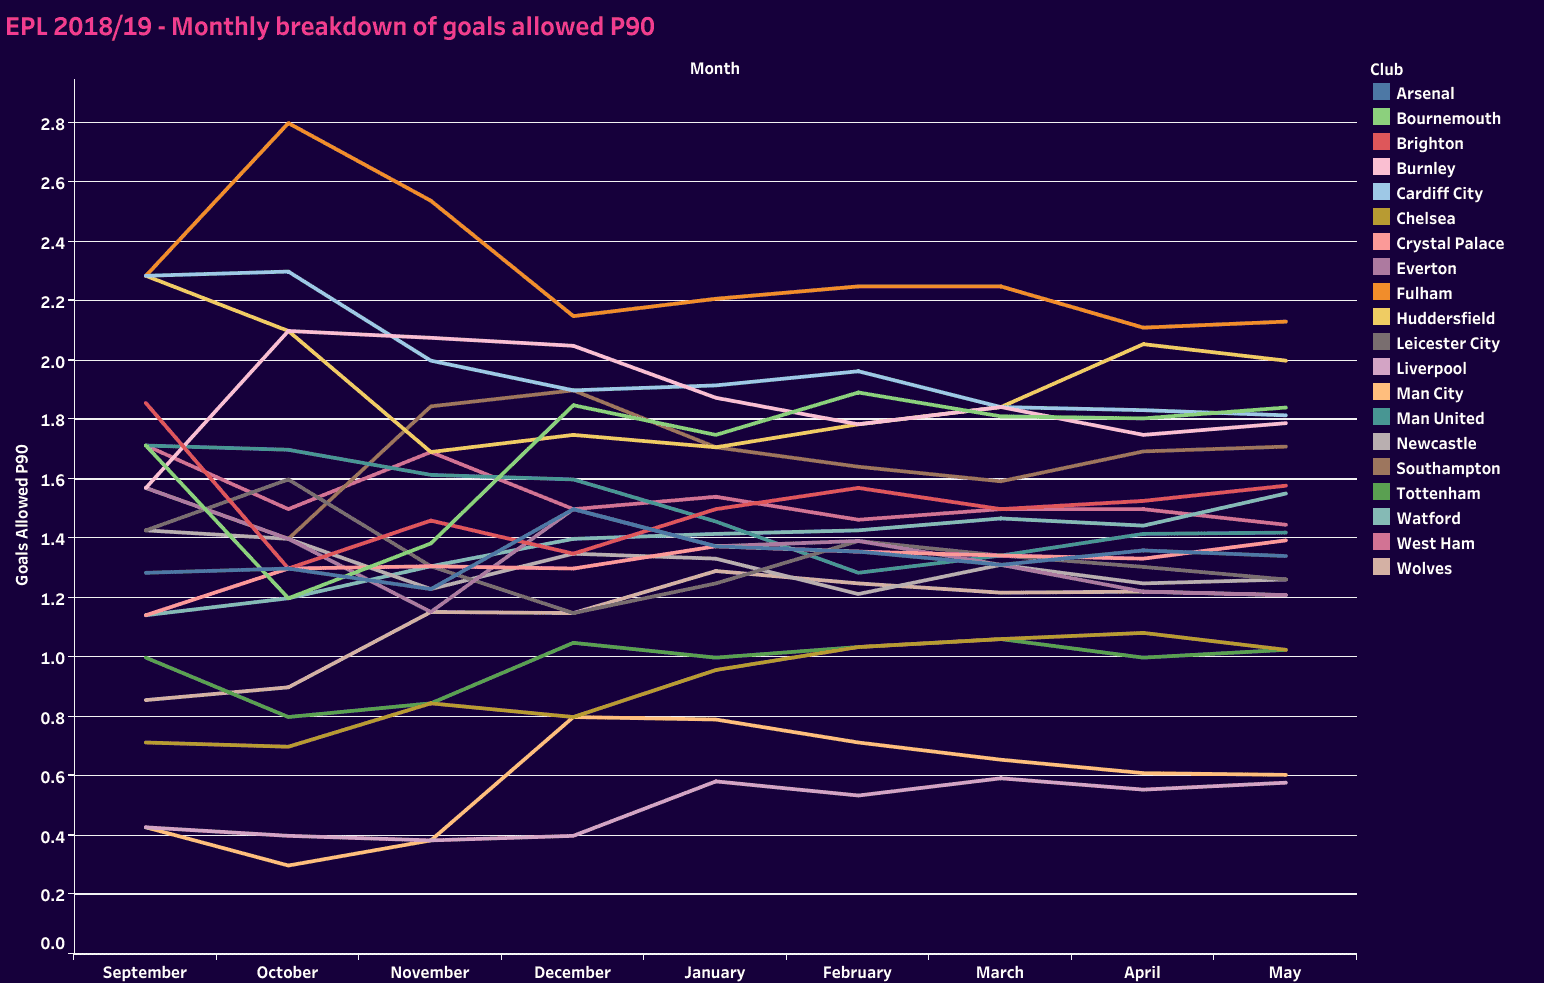
Finally, let’s look at the breakdown of goals allowed P90. As you’ll recall from earlier in the analysis, goals allowed P90 was very chaotic in the 2021/22 campaign. Each club’s place on that chart gave a good idea of where they stood in the league table. For the top-tier clubs, poor performances in the goals-allowed P90 metric likely put them in the middle of the table during the first few months of the season. For a relegation contender, it may as well seal their fate.
It’s not a coincidence that the top four finishers in 2018/19 were also top-five in goals allowed P90 for the entirety of the season. Tightening the defensive tactics first was a key theme among the top teams.
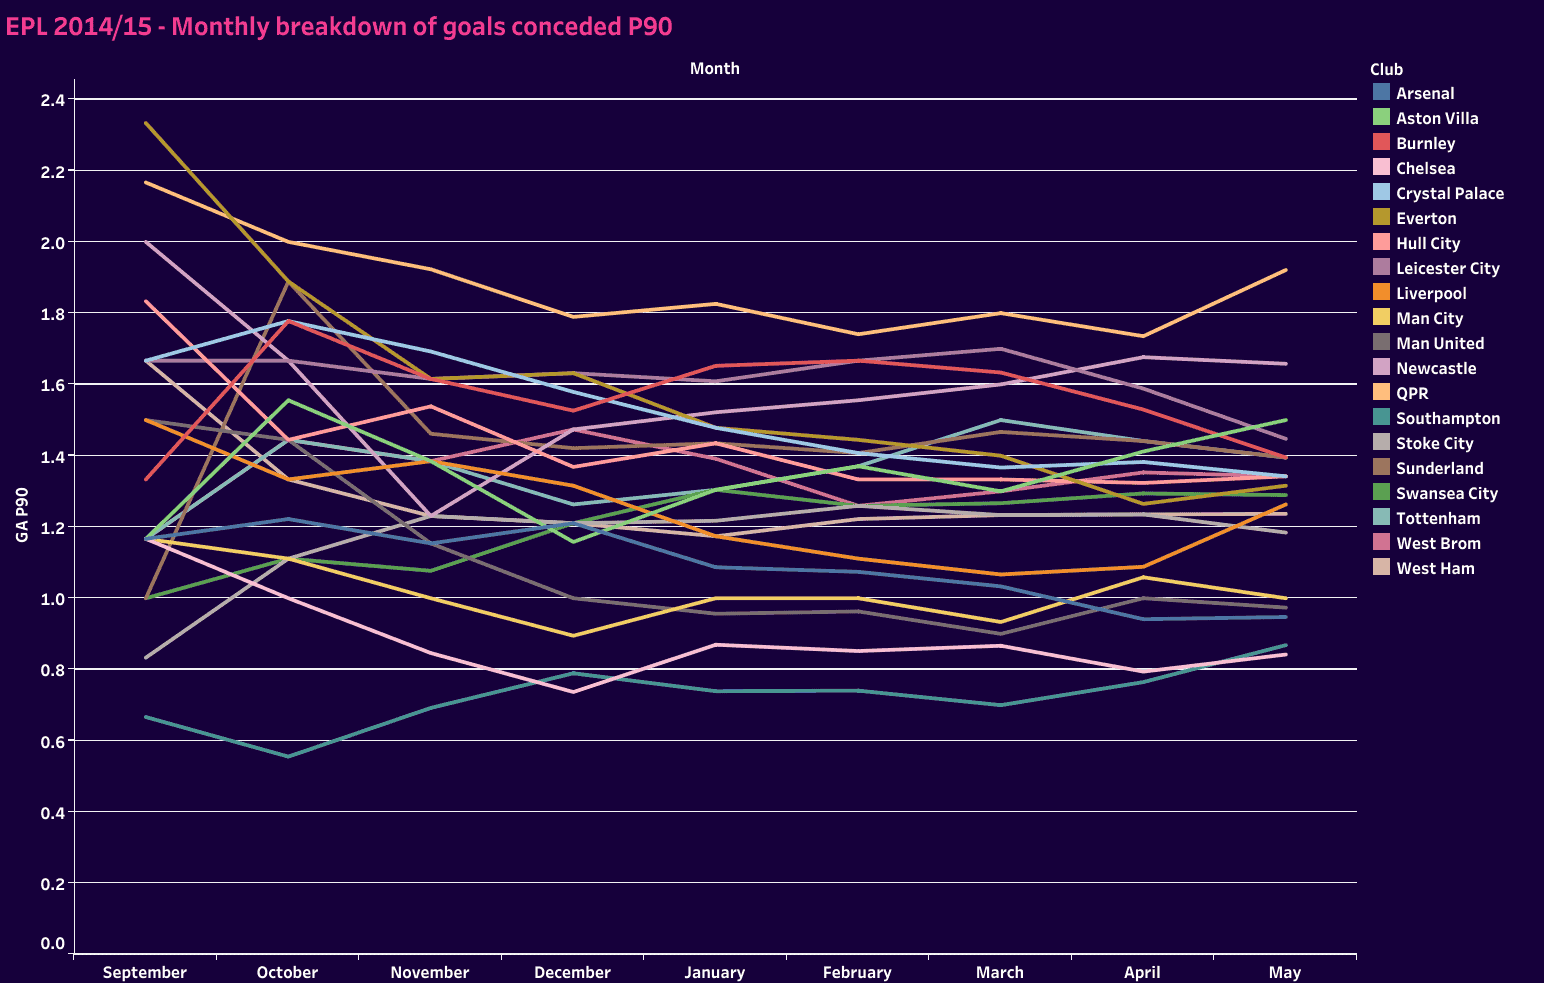
In contrast to 2018/19, the 2014/15 season saw each of the Big 6 get off the slow starts defensively. All six clubs saw significant improvement in their defensive metrics from start to finish. Any correlation to a World Cup-induced boost in form goes out the window. The opposite is the case in 2014/15. Calls for fatigue grow louder.
Looking at the World Cup as an influential event in producing performance slumps or boosts seems unlikely. Instead, one of the key differences from 2014/15 to 2018/19 is in the number of signings from the top clubs. The summer of 2014 was a busy window with many “World Cup” transfers, whereas that number diminished in after the 2018 tournament. Greater squad stability is the more likely reason for 2018/19’s more standard data.
Conclusion
One of the takeaways is that the 2022 World Cup was a unique experience. Many of the top teams have seen a dip in form in the months following the World Cup. Fatigue is likely part of the equation, but so are the discontinuity of club play and players returning from the tournament at varied dates.
But this is a unique case. Looking at the 2014/15, 2018/19 and 2021,22 campaigns, there wasn’t clear evidence to support a case in the direction of performance improvement or decline. Points per game varied and goals P90 were all over the chart.
If one metric was more critical to late-season success, it’s certainly goals allowed P90. Even here, there’s no direct tie to World Cup performances. The Big 6 were generally strong from the start. That may very well come down to superior players or stability within the squad.
Although the 2022 World Cup can claim a tournament-induced slump card, international tournaments do not generally affect performance either negatively or positively.

Comments