Over the past two seasons, Division 1 Feminine has been dominated by Olympique Lyon with the champions scoring 156 goals. The goal-scoring charts have been led by the talismanic Norwegian striker Ada Hegerberg who scores goals for fun in both the Champions League and Division 1. However, right behind her has been another player who has also scored a number of goals in both competitions and has kept pace with the Norwegian. Marie Antoinette-Katoto is a striker playing for Paris Saint-Germain Feminine and at 21 years old, remains one of the top young strikers in women’s football today.
My objective with this data analysis is to see if I can find common data metrics that contribute to a striker’s goal-scoring exploits and find out whether we can use the results to begin searches for other elite-level strikers for recruitment. I will initially be conducting a comparison of metrics that contribute towards goal scoring and discuss the results based on Hegerberg and Katoto. I will then compare both players to other top-level strikers and see if the results are in line with their season’s data.
What metrics are we using for comparison?
For our initial search, I identified four sets of data metrics that can be typically used to find out about a striker’s effectiveness. For this analysis, I have used Average Expected Goals (xG) vs Average goals, Average xG vs average Touches in the box, Average Shots vs average Shots on target, and Average Dribbles vs Average Shots. The reason for using these four comparison metrics is because it should act as the best indicator of a striker’s effectiveness in the final third through the actions they perform most often. Starting with shots, it is a good indicator because of the number of times a striker will look to shoot in a season. If there’s any aspect of a striker that will give you an indication of whether they’re getting opportunities, it is the number of shots they’re taking per game and we need to also look at the goal scoring opportunities they are getting by testing the goalkeeper by using shots on target.
Expected Goals (xG) is one of the most sought after metric in data analysis today, every club and recruitment scout report will have xG figures as a basis of goal-scorers effectiveness. Measuring it against their goals average this season will tell us whether they are able to outscore the number of chances presented to them proving their scoring efficiency and effectiveness. Using xG to compare the number of average touches in the box will also give us an indication of how much time the strikers spend in the penalty area and see their quality of chances.
Next, we’ll observe the number of shots, against the number of shots on target to show their accuracy in front of goal and see how often they test the goalkeepers. Lastly, by looking at the average number of dribbles against the average number of shots, it will give us a suggestion if these strikers are effective as players who are good on the counter-attack plus dribble themselves into shooting positions.
Assumptions
For the purpose of this analysis, I have used the 2019/20 season’s statistics as the information available was most accurate with a differential of 1-2 goals across for both Hegerberg and Katoto. The data will only comprise of statistics from the league and Champions League.
Before we look at the results, it’s important to note that Katoto has scored 19 goals this season including one scored penalty and Hegerberg has 22 goals with three penalties. It’s better to understand how many of their goals came from penalties as to not skew the results. In this case, because the numbers are low, we can include them in our data set. Out of the 41 goals scored between them, 37 have come from open play which still gives us a healthy sample size to base our results on.
Average xG vs Average Goals
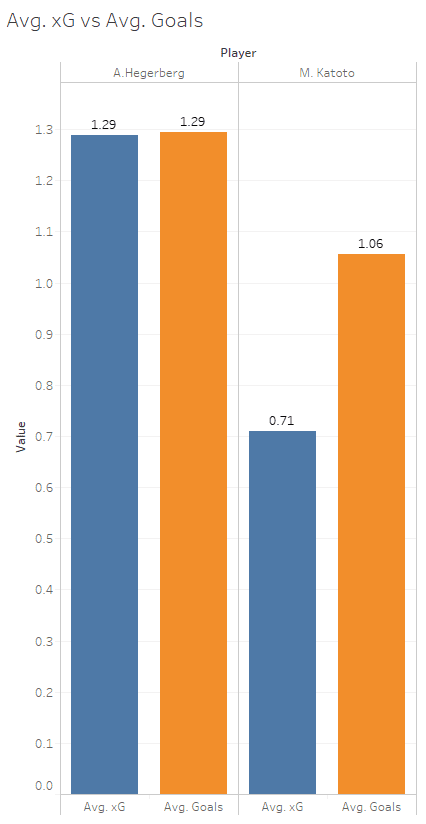
For the first data comparison, I am looking at Average xG and Average goals scored. This is a very common comparison where the results will give us a high-level indicator of whether these strikers are outscoring the number of chances they are presented across the season. The higher the xG, the better the quality of chances to score and if their average goals exceed this number, it means they are scoring more than expected, be it an easy or a hard chance.
The results are quite interesting. We can see that Hegerberg is scoring at a consistent rate of 1.29 goals and equally matching her average xG of 1.29. This means the Norwegian is keeping pace with the chances being presented to her. Naturally, this makes some sense because of the number of chances and possession Lyon have in the majority of their games. While one would have thought that Hegerberg should have outscored her xG simply due to the number of chances Lyon create per game, it’s worth noting that she did sustain a season-ending ACL injury that kept her out of three games before the season was suspended.
Katoto, however, has exhibited some interesting results with her performances. With a goal average of 1.06, she has been outscoring her xG of 0.71 which suggests that the Parisian striker is putting away more difficult chances and is clinical in front of goal. It would have been interesting to see if she could have continued her scoring rate with the latter stages of the Champions League yet to be played with high-quality opposition such as Arsenal to come but nonetheless, it is remarkable.
Average xG vs Average Touches in the box
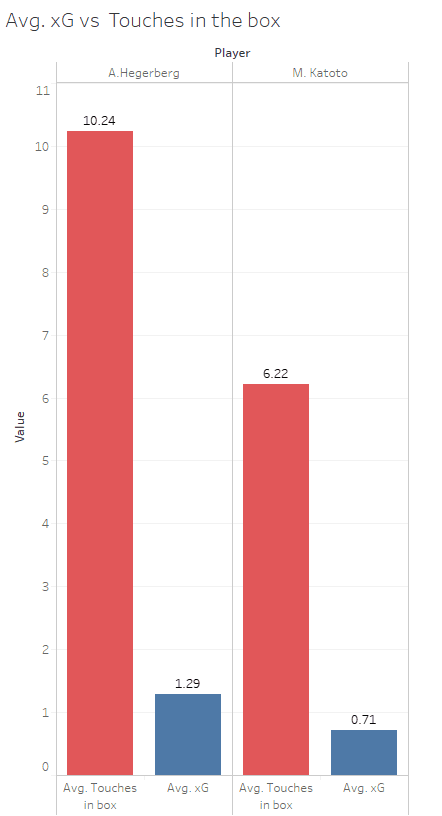
Next, I wanted to look at the xG figures and see if there was a correlation with the number of touches in the box. This would help us measure and find out how involved the strikers are in the 18-yard box and if there is a link between the number of touches in the box to the quality of chances presented. From the outset, we can see that there seems to be a correlation between the two metrics. Hegerberg’s xG of 1.29 comes from an average of 10.24 touches in the box. Katoto’s results are an average xG of 0.71 and 6.22 touches in the box. This could help us understand their team’s style of play coupled with their own effectiveness in the final third. There seem to be a lot shorter passes and build-up to Lyon’s play given the high number of touches Hegerberg has in the box resulting in her 1.29 xG.
For Katoto, PSG seem to have a slightly more direct build-up approach with seemingly fewer touches in the box by the striker resulting in her 0.71 xG. There could be two reasons to Katoto’s fewer touches in the box, one being shots taken from outside the box and the other being Katoto is the type of striker that gets in the right place at the right time to get on the end of the final pass or cross within the box, thus giving her fewer extra touches.
Average Shots vs Average Shots on target
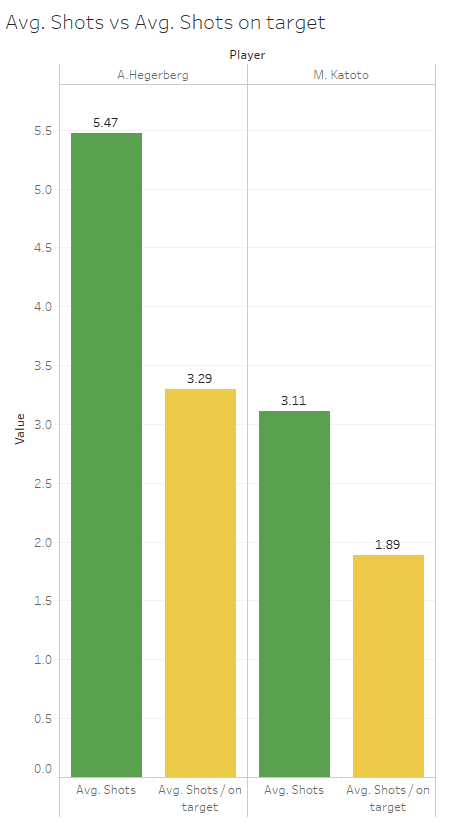
This test will be used to identify both centre-forward’s accuracy and whether they are able to get enough shots on goal in the first place. To score goals, one must take shots. This metric could be one of the very few that could possibly grow or remain similar year on year and produce similar results. Unfortunately, we only have current season data to analyse, however, this should still give us a good indication of Katoto and Hegerberg’s involvement in the final third.
Hegerberg has registered an average of 5.47 shots with 3.29 on target while Katoto has averaged 3.11 shots with 1.89 on target. If we look at the percentage conversion rate of both strikers, they sit at 66% and 65% respectively. While the PSG striker has a lower absolute value, the conversion rate remains similar which gives us an indication that both high scoring forwards register a 50%+ conversion rate of shots to shots on target.
Average Dribbles vs Average Shots
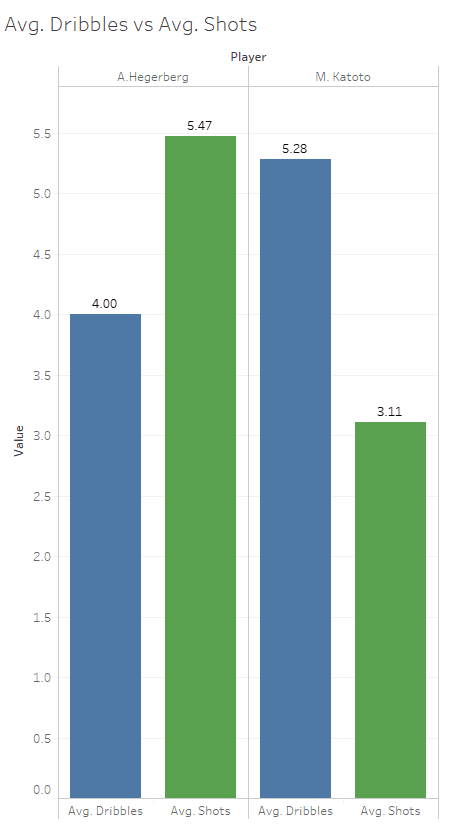
Lastly, I wanted to look at Average Dribbles against Average shots taken to determine how much involvement both strikers have in counter-attacks and/or smaller spaces to create and get away with goal-scoring chances. The results are striking. Hegerberg has an average of 4.00 dribbles and 5.47 shots across the season, whilst Katoto has the opposite with 5.28 dribbles and 3.11 shots.
The initial outcome would be that Hegerberg takes more shots than dribbles and the opposite can be said of Katoto. If we look deeper at these results, we can derive the difference in results from the team’s playstyle. Lyon seem to play Hegerberg as a sort of static striker who’s movements and involvement is predicated on possession in the 18-yard box whereas Katoto’s seem to be more active in PSG’s build-up play before it reaches the 18-yard box. This could also help us understand the fewer number of touches in the box because her involvement in the build-up is mostly in the areas outside of the box.
So are they as good as the other top strikers?
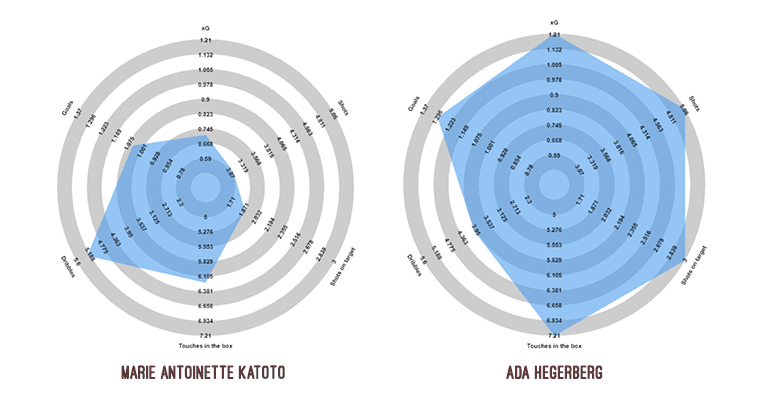
After seeing the results of our tests, it’s important to see how they hold up against other world-class strikers around the world and whether these metrics hold any value to our original idea. The strikers I chose include Bethany England, Pernille Harder, Vivianne Miedema, Sam Kerr, Nicolle Billa, Lara Prašnikar, and Lea Schüller. There is a mix of strikers from the Frauen-Bundesliga and FAWSL.
These forwards have been chosen on the basis that they have scored 14 goals or more in their domestic and/or European competitions and played over 1,000 minutes this season. For Kerr, we are using the 2019 NWSL data because of the way the American competition is played. Based on the two radars above we can see how both strikers fare to other top strikers around the world. The minimum and maximum values have been determined by looking at the highest and lowest averages of each metric of the other strikers.
The most staggering result is Hegerberg’s exceptional metrics when she’s measured against the rest of the strikers. Her metrics from this season alone are far and above the rest in comparison to the average minimum and maximum of the world’s elite strikers. This shows her being a well-rounded centre-forward with the ability to do well in all aspects of her play. Katoto, however, exceeds in some capacity whilst she is on the lower end of the spectrum in others it does show that both her and Hegerberg are both within the ‘industry’ average of elite strikers this season.
Final Remarks
While we haven’t been able to get a complete picture based on data from the past two seasons, the current results do show us that there is a correlation in certain statistics being able to determine the type of centre-forward who will look to score goals. Obviously we need to take the team’s playstyle into consideration but tailoring the data to a team’s specific playstyle could help bridge that gap.
Using Katoto and Hegerberg as an example, it’s clear to see that Katoto is much more involved outside the box whereas the Lyon striker prefers to get involved in the box. This can be catered to the type of players a club would need, but what’s clear is that these metrics can be used to identify an initial list of potential goal scorers using data. The next step would be to use video footage to analyse and further understand if they truly fit into the team’s tactics.




Comments