Football is returning, and Swedish football is no exception. Last week, head coaches and officials were discussing the schedules of Svenska Cupen and Allsvenskan. In this data analysis, we use statistics to find the best offensive midfielders in Sweden.
From an offensive aspect, we are going to measure the player in four domains by eight metrics:
- Dribbling data (dribbles per 90 X dribbles success %) were used to indicate the technical level of an individual.
- We move to a collective perspective and investigate how the candidates performed in terms of moving the ball forward, using progressive runs per 90 and progressive passes per 90 as the metrics.
- Since it was inevitable to compare the creativity of players when discussing offensive midfielders. Smart passes per 90 and key passes per 90 were used to quantify the creative level of players.
- By considering xG per 90 and shots per 90, we understand the shooting qualities of players.
After gathering and comparing the stats through drawing scatter diagrams, we will have a three-man shortlist who performed the best in terms of numbers. Our charts included 27 players who played more than 984 minutes in the Allsvenskan, which means at least around 1/3 of the league. The players might play in multiple positions, while all candidates had tried the role as an attacking midfielder and were identified by Wyscout.
Dribbling
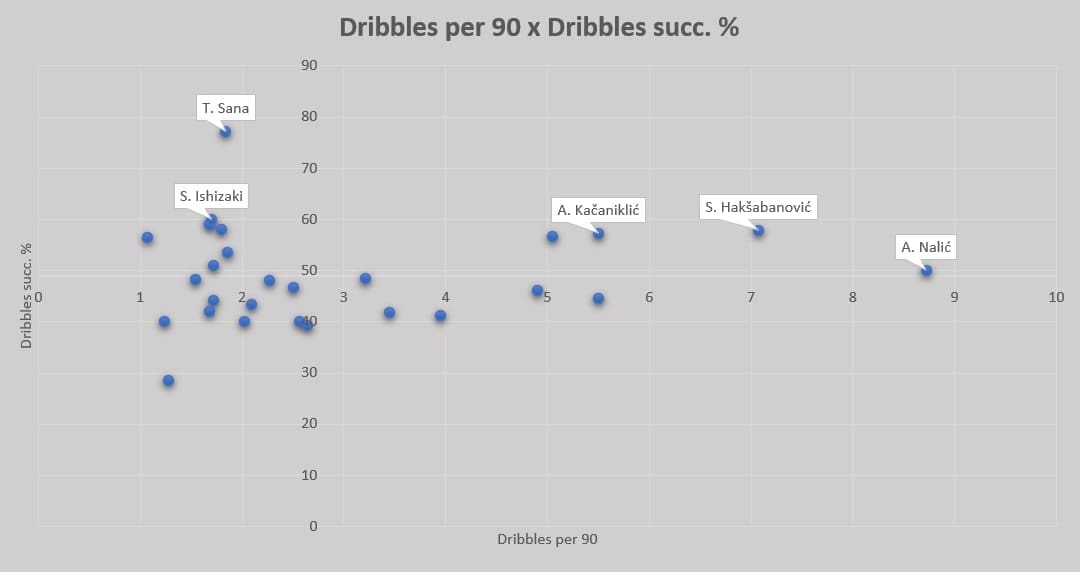
Clearly, the Malmö midfielder Adi Nalić stood out in terms of the attempts of dribbling, in which he had 8.72 per game, but averaged the success rate at 50%. Two other players: Alexander Kačaniklić and Sead Hakšabanović had more dribble than average (7.05 and 5.5) but behind Nalić, their success rates were higher than most players in the chart (57.86% and 57.27%).
We would also like to point out Tobias Sana and Stefan Ishizaki since both lied in the top-left quadrant. This means they dribbled less than league average but whenever they tried, the success rates were high. Sana only had 1.84 dribbles per game, but the chance of success was very high at 77.27% – comparable to Adama Traoré in the Premier League if we excluded the differences in standards.
Ball progression
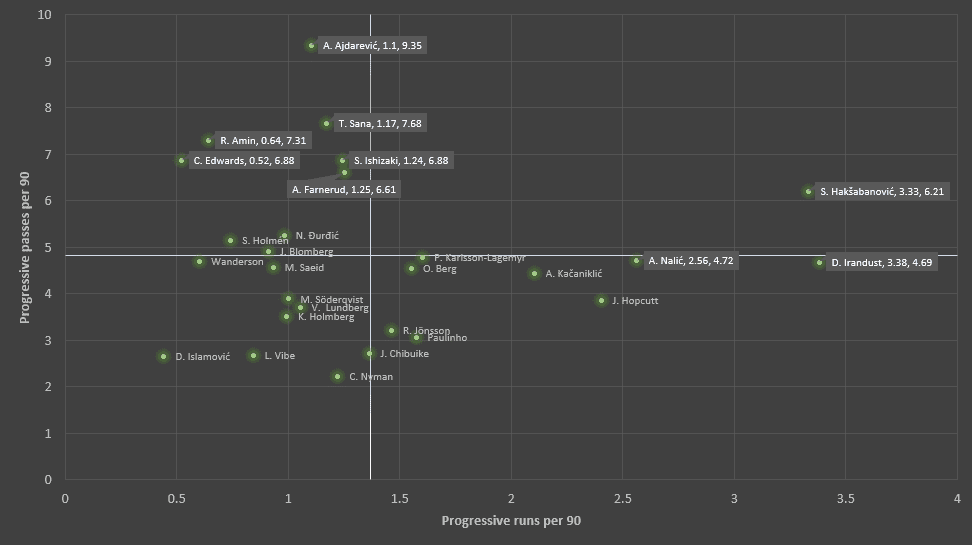
However, merely dribbling was not enough as moving the ball towards their own third was also a dribble. We have to understand how the player helps his team to progress the attack by moving the ball towards the goal. Some players were specifically highlighted in this chart and they shall be classified into three groups.
Strong at carrying the ball forward: Nalić and Daleho Irandust were strong at progressive runs (2.56 and 3.38) but averaged in terms of progressive passes (4.72 and 4.69). Jamie Hopcutt was nominated as he ranked 4th when comparing progressive runs per 90, but his ability to progress by passing was below par.
Strong at progressive passing: Players in this group lied in the top-left quadrant. This chart has shown that offensive midfielders in Allsvenskan tended to progress by passes rather than by runs. Astrit Ajdarević was the best progressive passer with 9.35 per 90. Meanwhile, Sana was the second-best as he provided 7.68 progressive passes per game. Some other players who were good at playing progressive passes were Ishizaki, Rewan Amin, and Curtis Edwards. However, all of these nominations were below average in progressive runs per 90.
Good at progressing by both methods: The best ball progressor was undoubtedly Hakšabanović, whose 6.21 progressive runs per 90 was outstanding while also better than most of his counterparts in progressive passes (3.33).
Chance creation
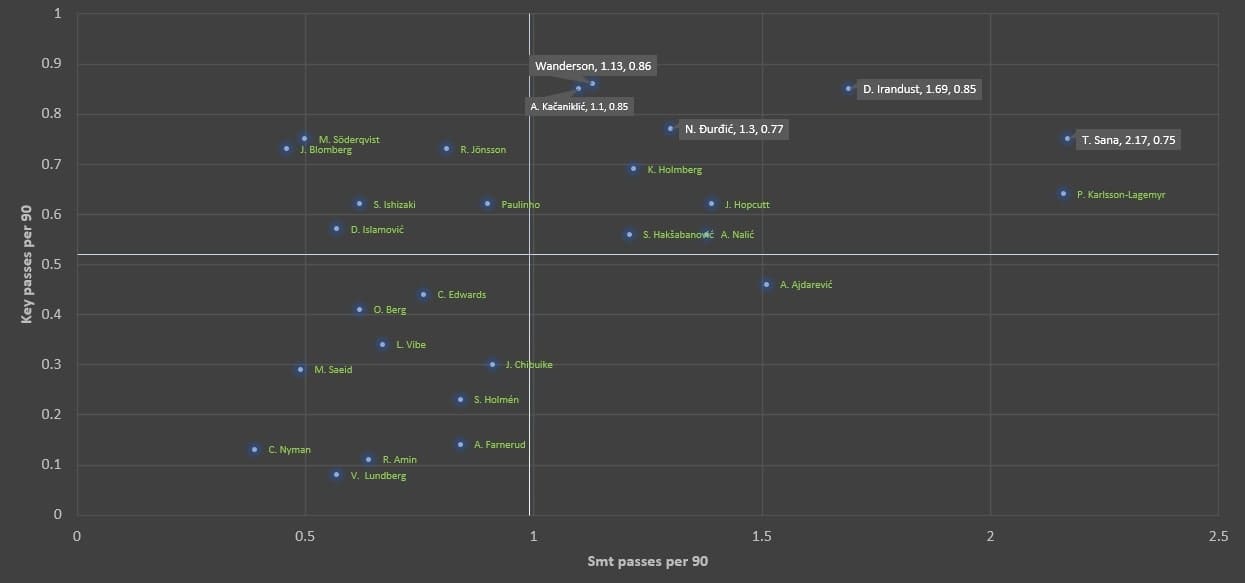
According to the definitions from Wyscout, smart passes refer to “a creative and penetrative pass that attempts to break oppositions’ defensive lines to gain significant advantage in attack”, while key passes refer to “a pass that immediately creates a clear goal-scoring opportunity for a teammate who in turns fail to score”. By measuring these metrics, we could understand the creativity of players from the threat of their passes.
This scatter charts show the attacking midfielders in Allsvenskan were better in playing key passes than smart passes – there was only one player on the bottom-right quadrant. Since the standards of both metrics were similar, we should look for players in the top-right quadrant, which means they were good at both metrics.
Six players were highlighted here, as Sana, Patrik Karlsson Lagemyr, and Irandust were good at smart passes, they handed 2.17, 2.16 and 1.69 per game. Nikola Đurđić balanced in both metrics as only the Serbian stayed in the middle of the quadrant. He had 1.3 smart passes and 0.77 key passes per game. Wanderson and Kačaniklić were the other two we highlighted in this quadrant, since both were good at playing key passes (0.86 and 0.85) while having better numbers in smart passes than average (1.13 and 1.1).
Some players apart from the above six to be noted were Nalić, Hopcutt, Hakšabanović, and Karl Holmberg, they also lied in the top-right quadrant but did not stand out in either metric.
Goal-scoring ability
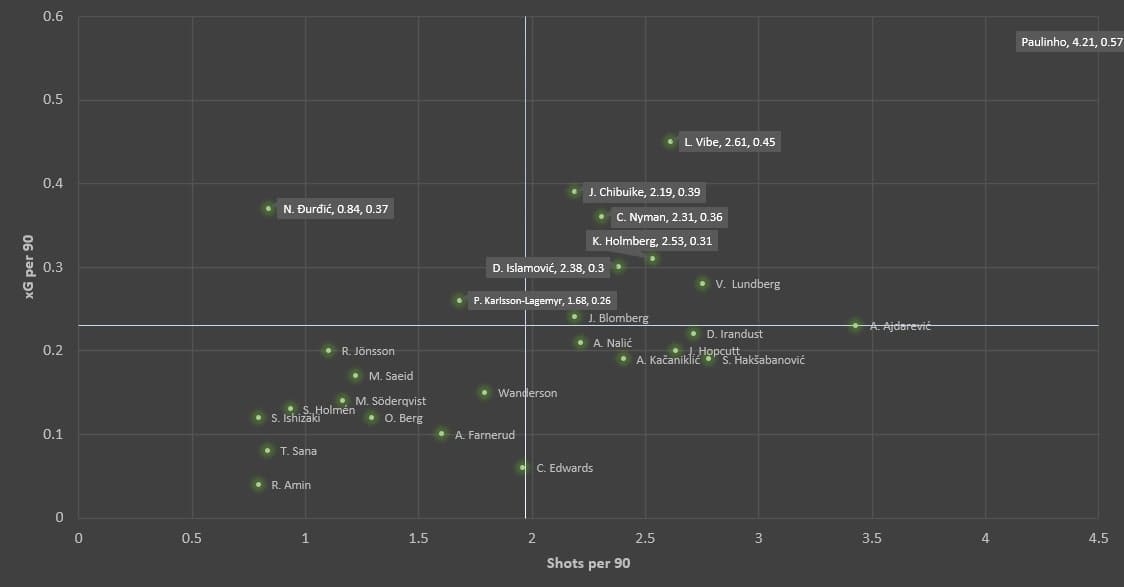
Our last domain is goal-scoring ability and shooting. We use xG per 90 and shots per 90 as the metrics, as these gave us hints on the players’ quality and quantity of shots. We could exclude the bottom-left quadrant as these players seldom shoot and their shots tend to carry a low xG. Players on the bottom-right quadrant were not considered as they take shots frequently, but those might not be good chances, such as shooting outside of the penalty box, so their xG per 90 were below averages.
We emphasised on players on the top, we briefly divided them into two groups: shooting a lot but the quality of chances was better than the bottom-right quadrant (higher xG). Another group included players who shot less, but those are good chances, suggesting their ability to get into good positions.
Paulinho’s name appeared on the top-right comer, the Brazilian midfielder always shoots (4.21 per 90 mins) and accumulated 0.57 xG per game. Another impressive player was Lasse Vibe, who had 2.61 shots and 0.45 xG per 90. We should also note Holmberg, Christoffer Nyman, and John Chibuike, they were keen to shoot and accumulated a high xG per game.
We should pay attention to Nikola Đurđić, who stood on the top-left quadrant. His 0.84 shots and 0.37 xG per game suggested the English player was shooting cautiously, possibly having a good positional awareness to receive quality chances. A player who has a similar trait was Karlsson Lagemyr, who had fewer shots than average (1.68) the quality of chances was reflected in terms of xG (0.26 per 90).
Shortlisted player 1: Sana
Undoubtedly, Sana must be included in our list despite his relatively weak goal-scoring ability. The 30-year-old from IFK Göteborg played 1092 minutes in the league and handed three assists but never found the back of the net. He is versatile as he could also play as a winger, a second striker, or as a central midfielder. According to Transfermarkt, his estimated market value is €475,000. Passing and dribbling should be the strengths of the player, as his stats were outstanding in the related metrics.
Shortlisted player 2: Hakšabanović
It was not difficult to choose Hakšabanović as our second shortlisted player. He is a very good ball progressor and we could expect him to help his team to move the ball forward. The 21-year-old Montenegro player was quite good in terms of creating chances too. The contract of the player expired in next month and given his age and estimated market value of €1,000,000, we believe clubs from Scandinavian and Eastern Europe would be interested in him. The West Ham loanee played 1689 minutes in the Allsvenskan, provided with six goals and eight assists.
Shortlisted player 3: Đurđić
How can we forget Đurđić? The 34-year-old was one of the best players in Allsvenskan 2019, scored 13 and assisted 11 for Hammarby IF. He could also play as a left-winger and even as a centre-forward. Despite having an estimated market value of €950,000, the former Serbian international moved to Chengdu Better City FC, a club in the second tier of Chinese leagues at a reported fee of €450,000. Đurđić is good in front of the goal and creating chances, having the strengths you would expect an attacking midfielder to possess.
Final remarks
We have to stress that the above results in this analysis were purely generated by comparing metrics and numbers of players. In other words, off-the-ball movements were neglected. These scatter diagrams gave us a brief impression on the best offensive midfielders in the Allsvenskan, we probably would continue to investigate their performance by writing scout reports in the future.



Comments