Once every so often in football, a team reaches its peak. A delicate aggregation of experience and youth, flair and work-rate pieces seamlessly together to complete the perfect footballing picture. The result? A well-oiled, match-winning machine destroying everything in its path.
At this point in history, that team is Liverpool. Their recent defeat to Watford put an end to a remarkable unbeaten run of 44 Premier League games. Within this tenure, Liverpool won 18 games straight, securing three points in 39 of the 44 games. This sequence of results puts this Liverpool side amongst the greats, comparable to legendary sides such as Milan in the nineties, Guardiola’s Bayern and of course, Arsene’s invincibles. These runs inevitably come to an end, as all must. For Liverpool, there’s no time for reflection as an important period in the club’s history looms. All thoughts must be focused on lifting the Premier League title. For others, however, a dissection of the numbers can begin; poking and analysing each game to identify whether Watford have single-handedly unveiled a design for beating the Merseyside club, or whether, within the numbers, a blueprint existed all along.
This tactical analysis looks at the hidden numbers behind Liverpool’s great run and attempts to identify an answer to the question that has kept managers awake at night; how do you beat Liverpool?
Defensive Organisation
Such is the firepower possessed by the Reds, that naturally, the starting point for the investigation is defending. Any manager looking to beat this Liverpool side has to have a clear defensive plan, balancing tactical risk and space management with player responsibility to keep the goal-hungry Liverpool at bay. Outscoring this side is simply not an option.
As we know and are continuing to develop our appreciation for, results and performance are two vastly different measures. In my previous article, I identified key matches in Liverpool’s season where performance didn’t match the expected result, due to expected goals variance. This means looking only at Liverpool’s defeats is futile. Not just because there are so few, but because the result doesn’t necessarily reflect whether a team deserved to win or not.
The first graph looks at the formations used by each side against Liverpool in the 44 Premier League games. The formations used have been tested against the Expected Goals Against (xGA) each side subsequently achieved in the game. By cross-referencing these numbers we aim to establish which shape is best for our 11 players to start in.
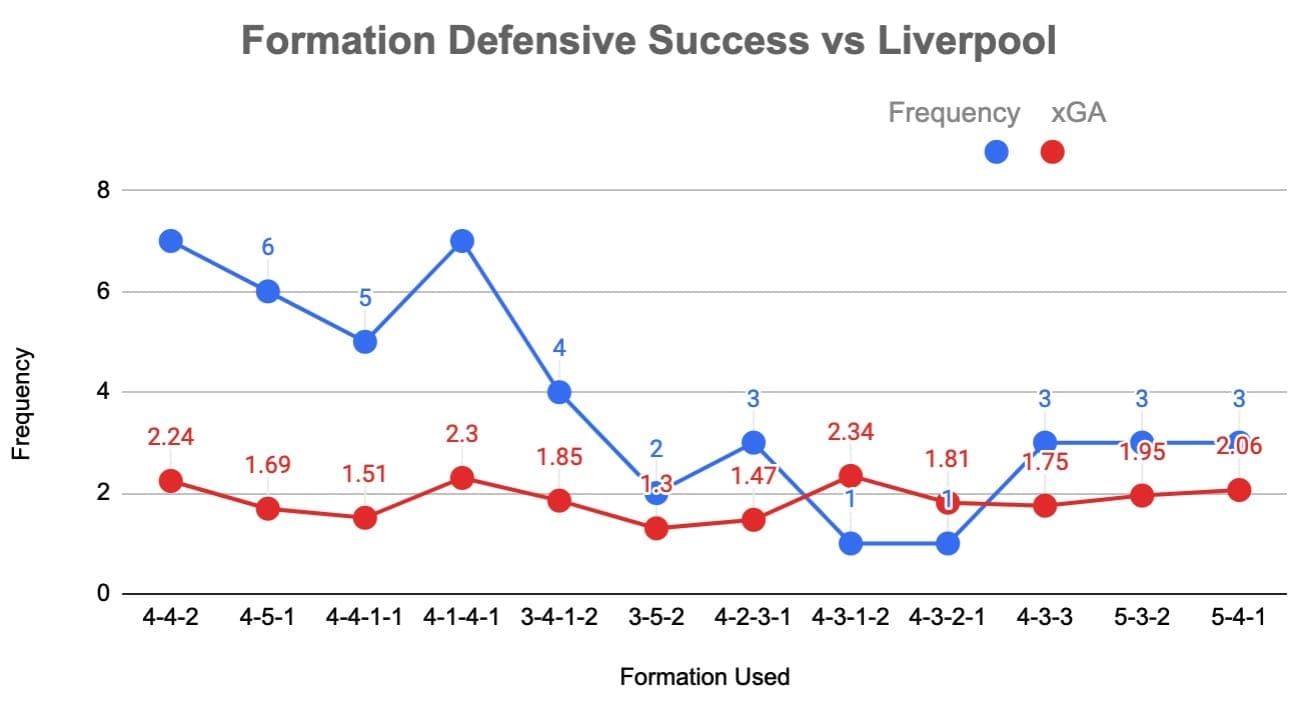
A wide range of systems were used in an attempt to stop Liverpool, from 5-4-1 to 3-5-2 and everything in between. It’s no surprise that the more adventurous shapes were unsuccessful. For example, 4-4-2 and 4-3-1-2, both of which don’t provide an additional man to the defensive line, meaning more space for Liverpool’s front three, conceded an xGA of 2.24 and 2.34 respectively. Conversely, the systems where additional defensive support was provided helped blunt Liverpool’s attack. Looking at 3-5-2 and 4-2-3-1 which achieved an xGA of 1.3 and 1.47 respectively, we can see that robust systems found some success in reducing the likelihood of conceding.
There are too many caveats to this test to draw conclusions. Firstly, the test doesn’t take into account the quality of each player, potentially skewing how effective a team’s shape is. For example, a 4-4-2 of Atletico Madrid is likely more robust than one implemented by West Ham. Secondly, tactics are often variable and fluid so just by reviewing shape we get no clear indication of the system behind each team’s approach. Finally, the data set is spread too thinly across too many formations to definitively say how successful each shape was. There is also the added point that xGA only shows a team’s success in defending and not the success of the tactic as a whole. I need a metric that incorporates the success of both the attack and defensive strategy into one metric. Here I turned to Expected Points (xPTS).
In order to really see how to beat Liverpool, I dug deeper into the numbers and came up with three charts, which I think most clearly demonstrate an effective way to keep Liverpool at bay. Looking at the fundamentals of defending, I considered what are the key components of a defensive system. Once identifying these I measured them against the level of success achieved when facing Klopp’s side, to see if a defensive blueprint emerges.
Aggression was the first pillar I believed to be important. The degree of pressure by which a team imposes on their opponent in possession is a cornerstone to how they will operate in all four phases. To measure this I have used the passes per defensive action (PPDA) stat, which provides a single number that can be used to gauge the level of pressure imposed by a team. By cross-referencing PPDA against xPTS, I hope to find a suitable level of pressure to use against Liverpool.
Note: To measure the tactical success opposed to that of a team, where Liverpool have faced a team multiple times, I have labelled them separately.
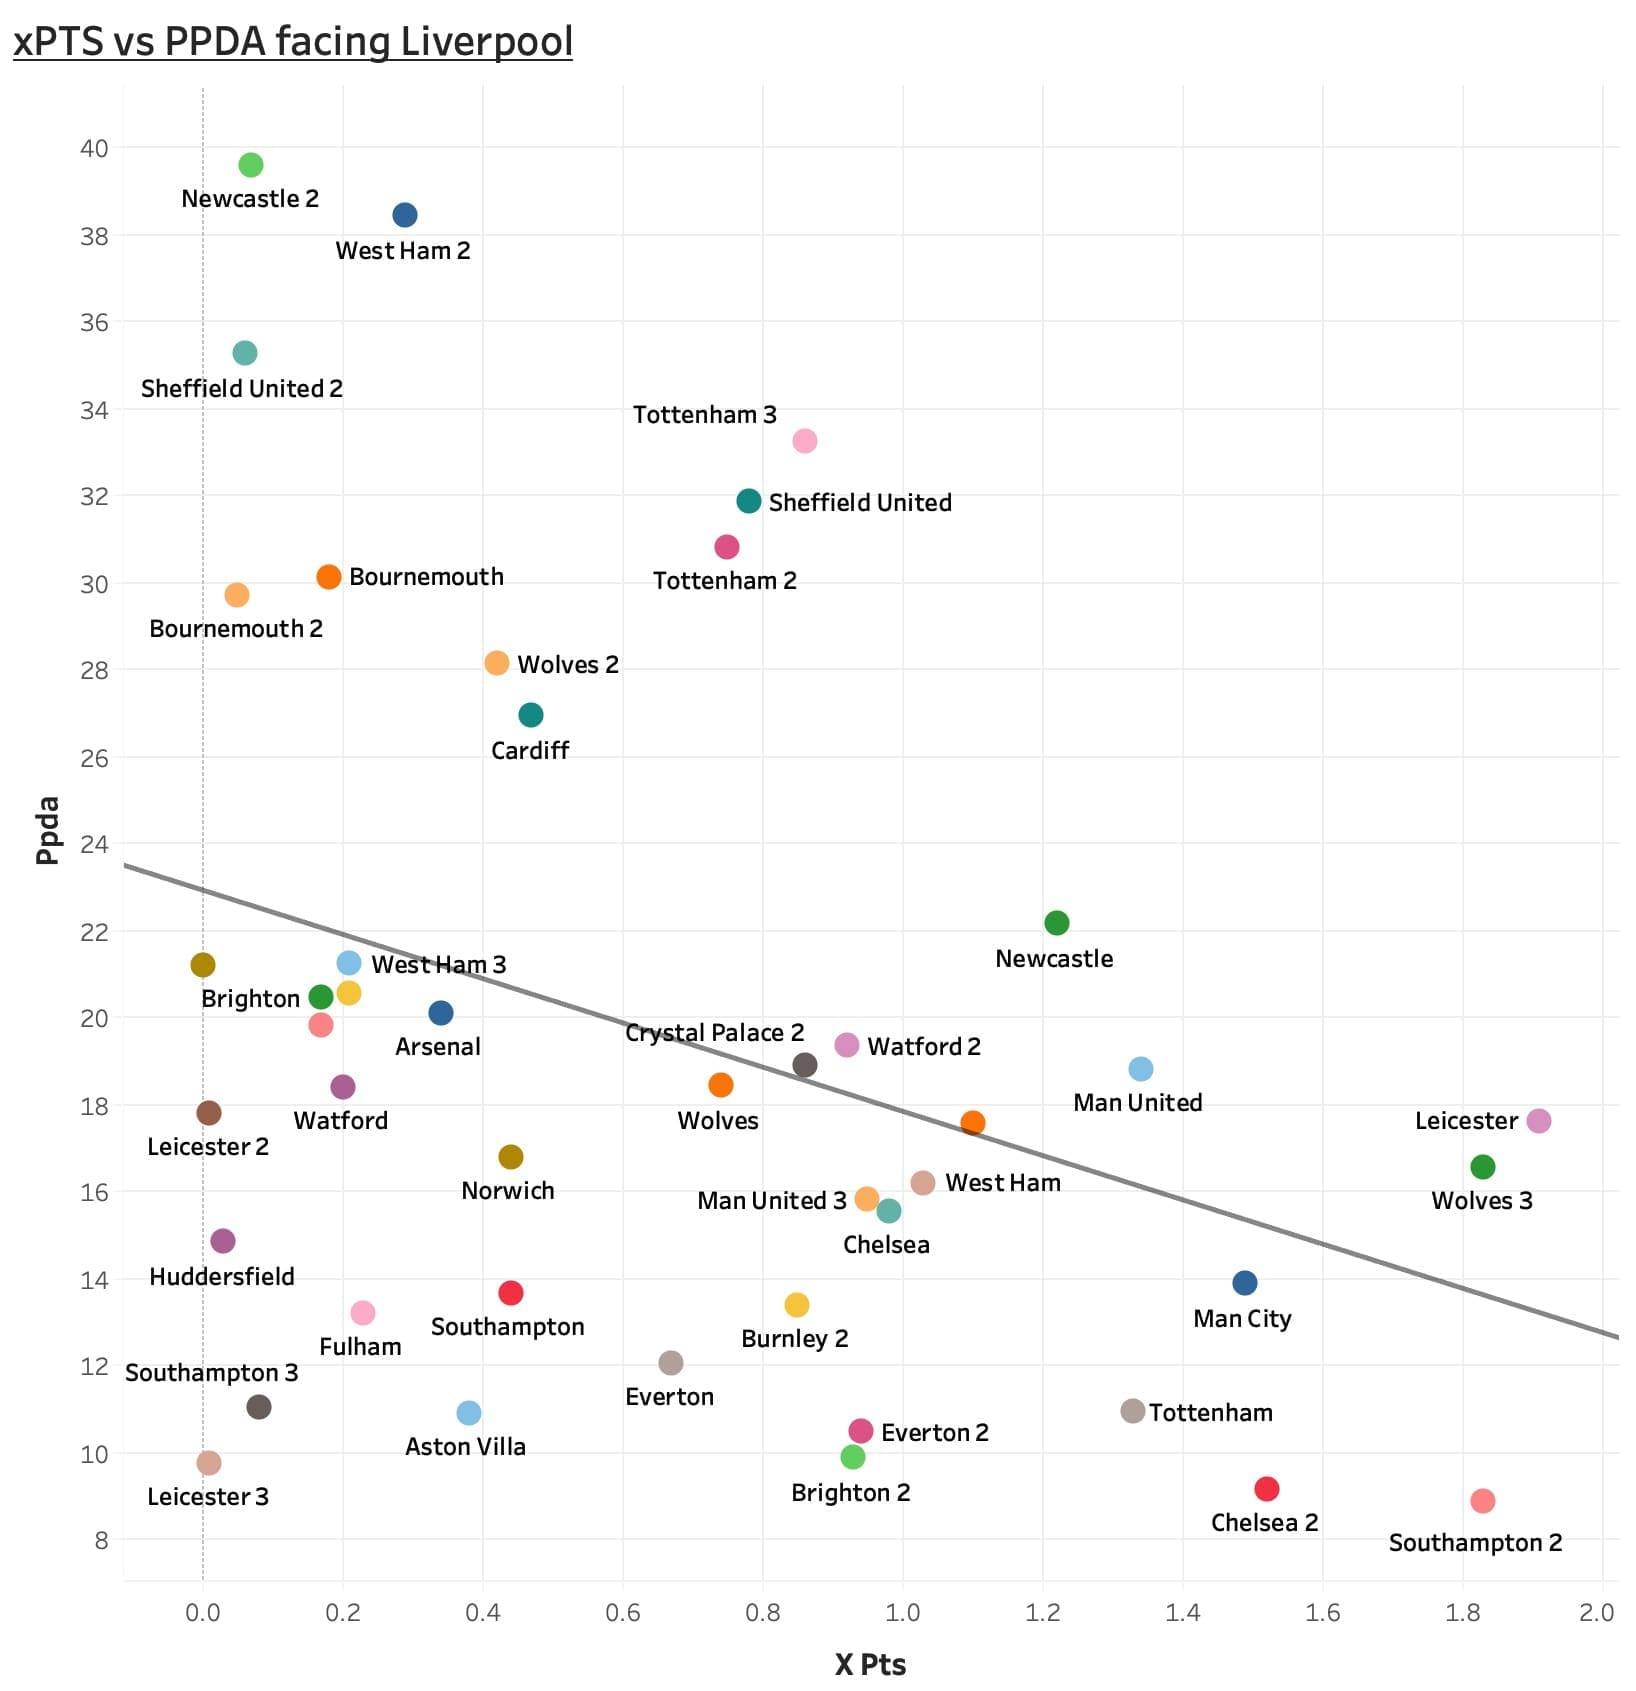
The results are not as expected. Before the test, I imagined teams that sat off the ball – opting for a containing system as opposed to an aggressive one would yield the best results. However, as we can see above from the regression line, the opposite is true. Teams that have got in the faces of Liverpool with high intensity and aggression achieved the highest amount of xPTS.
It is clear from the graph that there is a fine balance between aggression and risk. Teams with the most success are ‘Wolves 3’ and ‘Leicester’, whose PPDA’s are 16.57 and 17.52. This shows that an ultra high-press, other than for the very best teams, can potentially result in disaster. This is proved by ‘Leicester 3’, where ‘Leicester’ attempted a more aggressive approach but achieved an xPTS of just 0.01.
Now we have identified we need our team to operate in a controlled aggressive system looking for an optimum PPDA of 14-16, I moved onto the next pillar. Compactness was the next principle I considered vital. This is a difficult metric to assign a numerical value to, so I looked at a by-product of compactness for the answer. A team that is compact, reduces spaces through their structure, in order to prevent passes from penetrating. It’s logical then to assume that a more compact team will make more interceptions per match, due to the higher difficulty the opponent faces of passing through congested passing channels. By cross-referencing a team’s interception frequency against their xPTS, I hope to find a level of compactness that yields success against the Merseyside club.
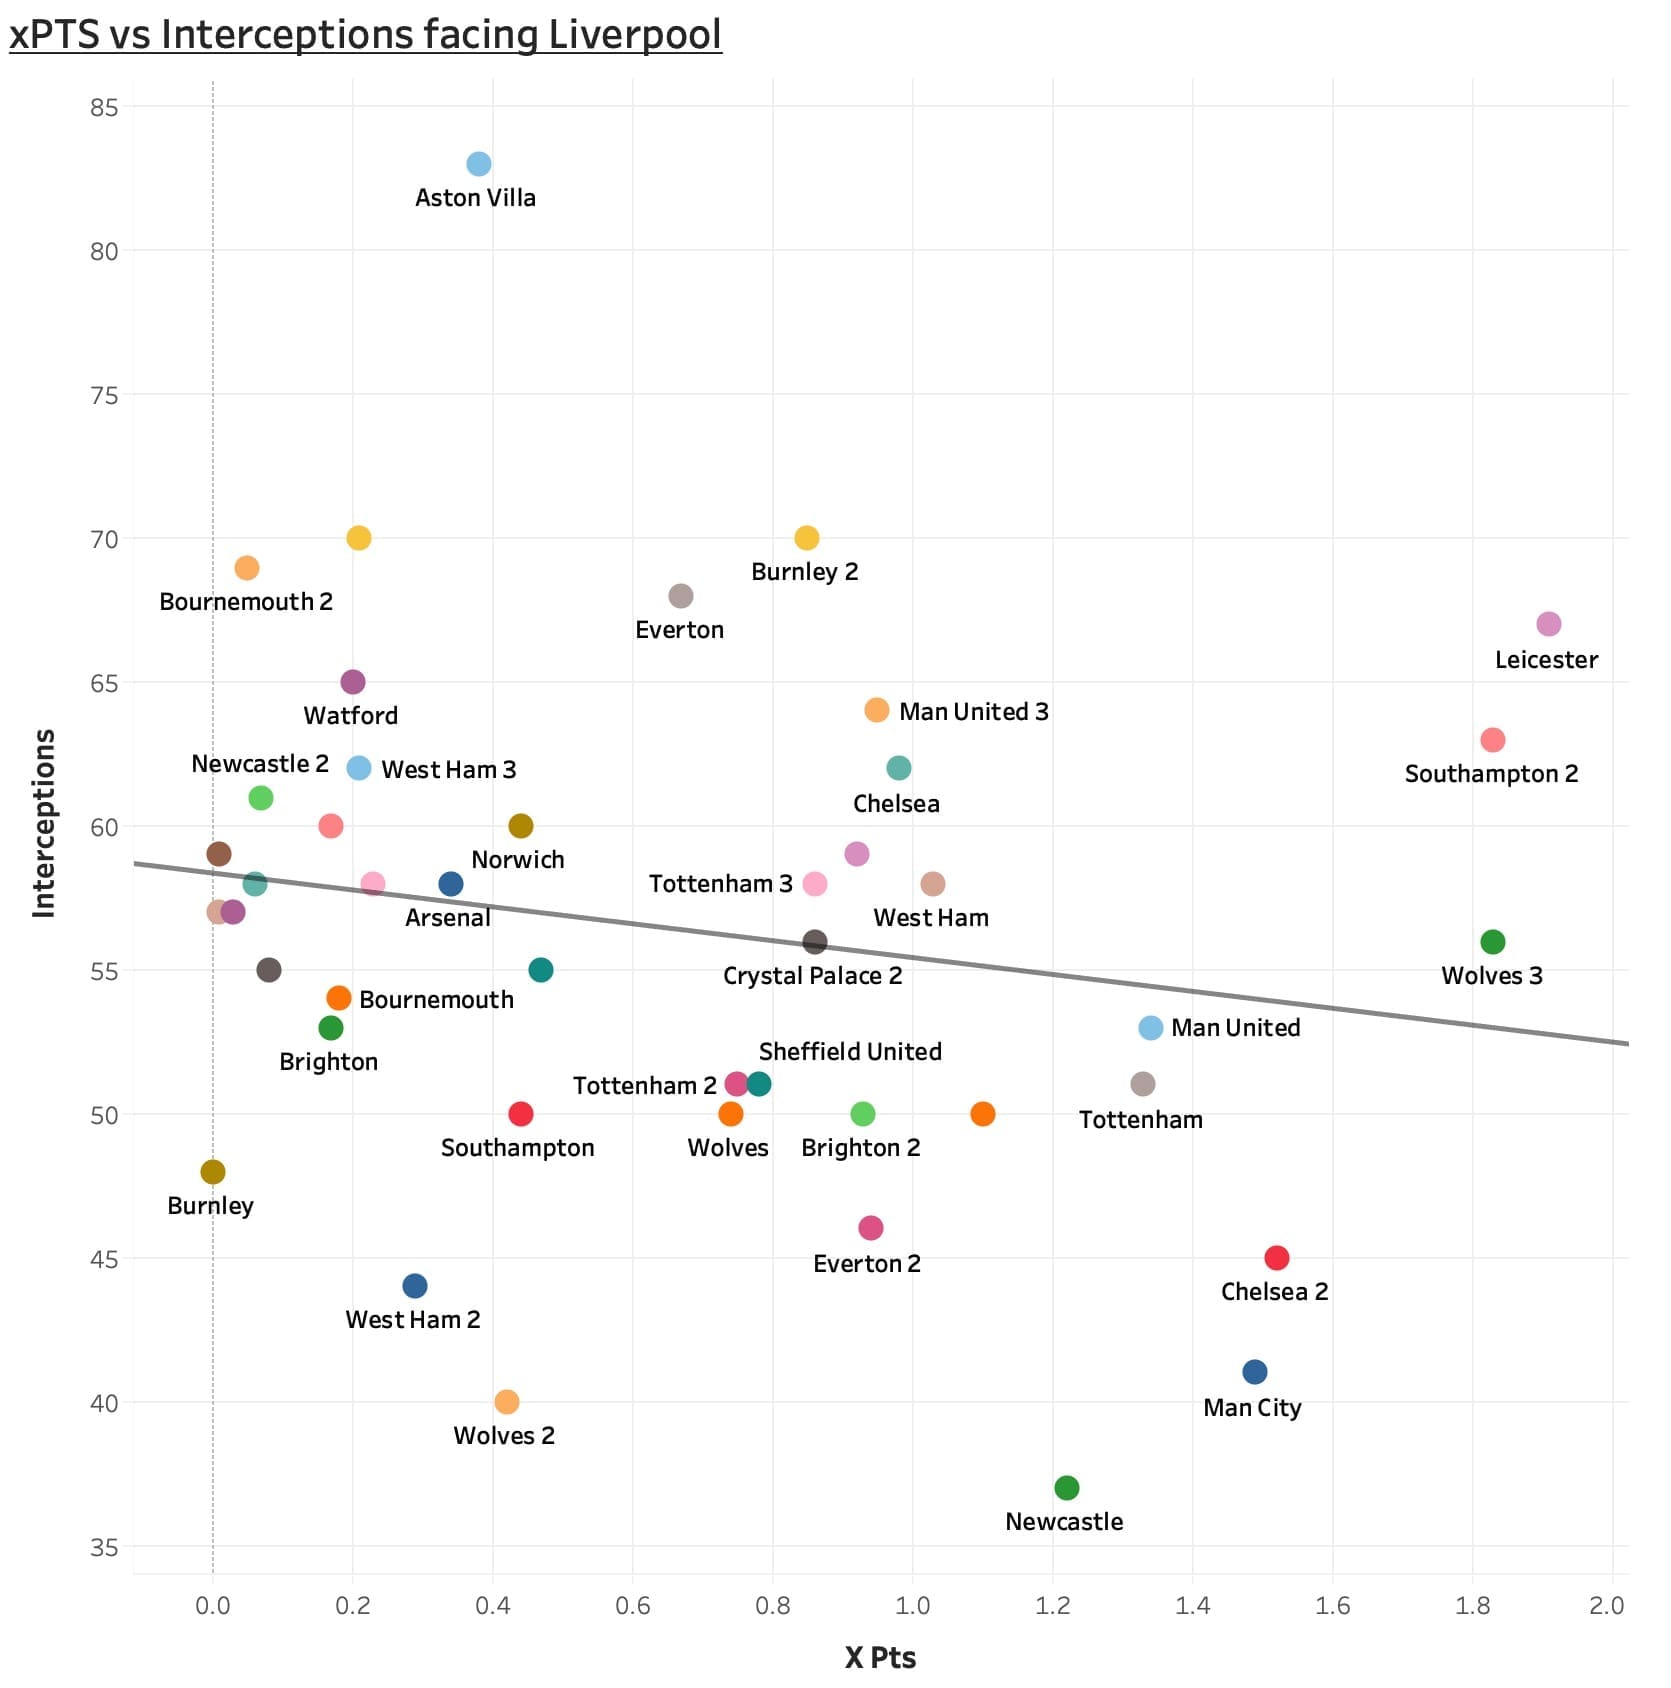
This test wasn’t as successful. There is minimal correlation between the level of interceptions made and the xPTS generated. Some teams were particularly good at intercepting, however, achieved a low xPTS – Aston Villa, for example, made 83 interceptions but amassed just 0.38 xPTS. A team’s ability to block passes through their shape is offset by what they do with the ball once they’ve regained possession, and as a result, we cannot see any clear patterns emerging by looking at this metric.
Perhaps this is due to interceptions not being a direct measure of a team’s compactness. A more insightful figure to use would be a team’s average defensive width throughout the game and compare this to their xPTS.
The final principle I deemed a key measure was control and restraint. A higher line leads to a more advanced team unit, which leads to recoveries in more advanced positions of the pitch. Therefore, by looking at how many recoveries each side made in the final third versus Liverpool and cross-referencing it with their xPTS, we can demonstrate the tactical risk undertaken and use it to understand what level of restraint is required to take points from the soon to be champions.
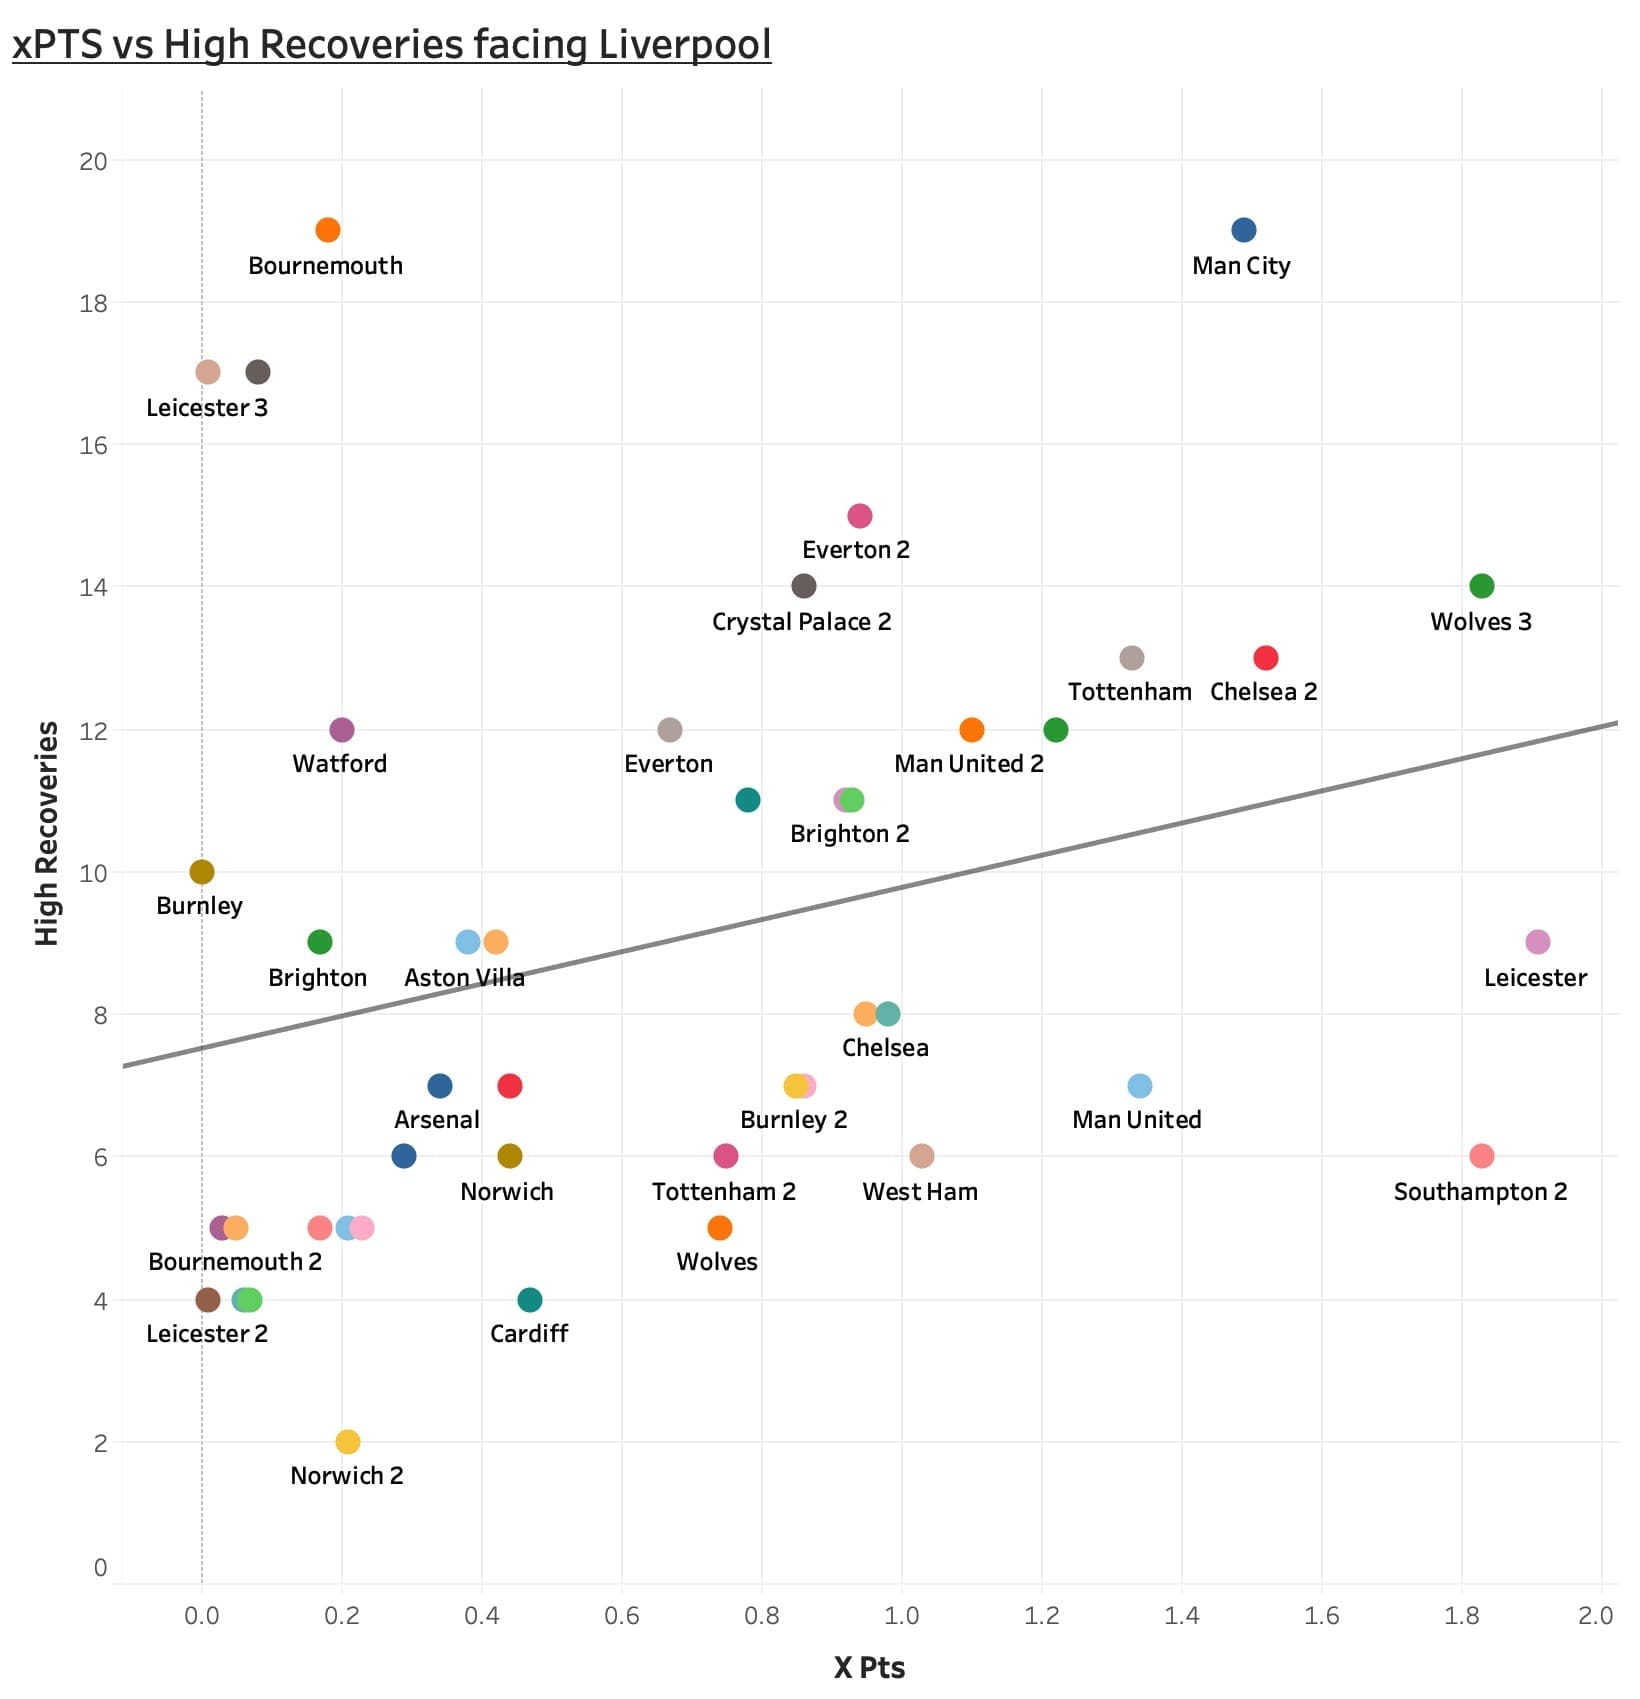
Based on what we learned from the levels of aggression required to beat Liverpool, the results are as expected. We know that aggression is vital if you want to earn points, but the control and restraint test measures where it is best to confront Liverpool. We can see from the graph that there is a correlation between the number of high recoveries made by a team and the likelihood of winning. ‘Wolves 3’ made 14 recoveries in the final third, which yielded them an xPTS of 1.83. What is noticeable is the large cluster of teams that have decided to allow Liverpool possession by sitting deeper, in an attempt to close off the spaces in behind. Though this seems a logical tactic, we can see that by doing so Liverpool are more likely to be victorious.
Attacking Organisation
I have identified the key concepts of attacking and looked to find metrics that underpin these fundamentals. From this point, I have compared each team’s metrics from their matches against Liverpool in the 44-game streak and measured it against the levels of success they achieved. This is all in the hope of identifying an attacking blueprint that can be used to win.
The first fundamental concept of attacking is mobility. A team’s ability to be fast, fluid and incisive is paramount to their success as an attacking entity. I considered the most appropriate underlying metric to measure mobility was counter-attacking success. The counter-attack is a demonstration of a team in peak mobility. It comes in the transition phase between defending and attacking, so speed, accuracy and decision making are vital components. Therefore, I have used each team’s counter-attacking frequency in their matches against Liverpool and measured it against their xPTS.
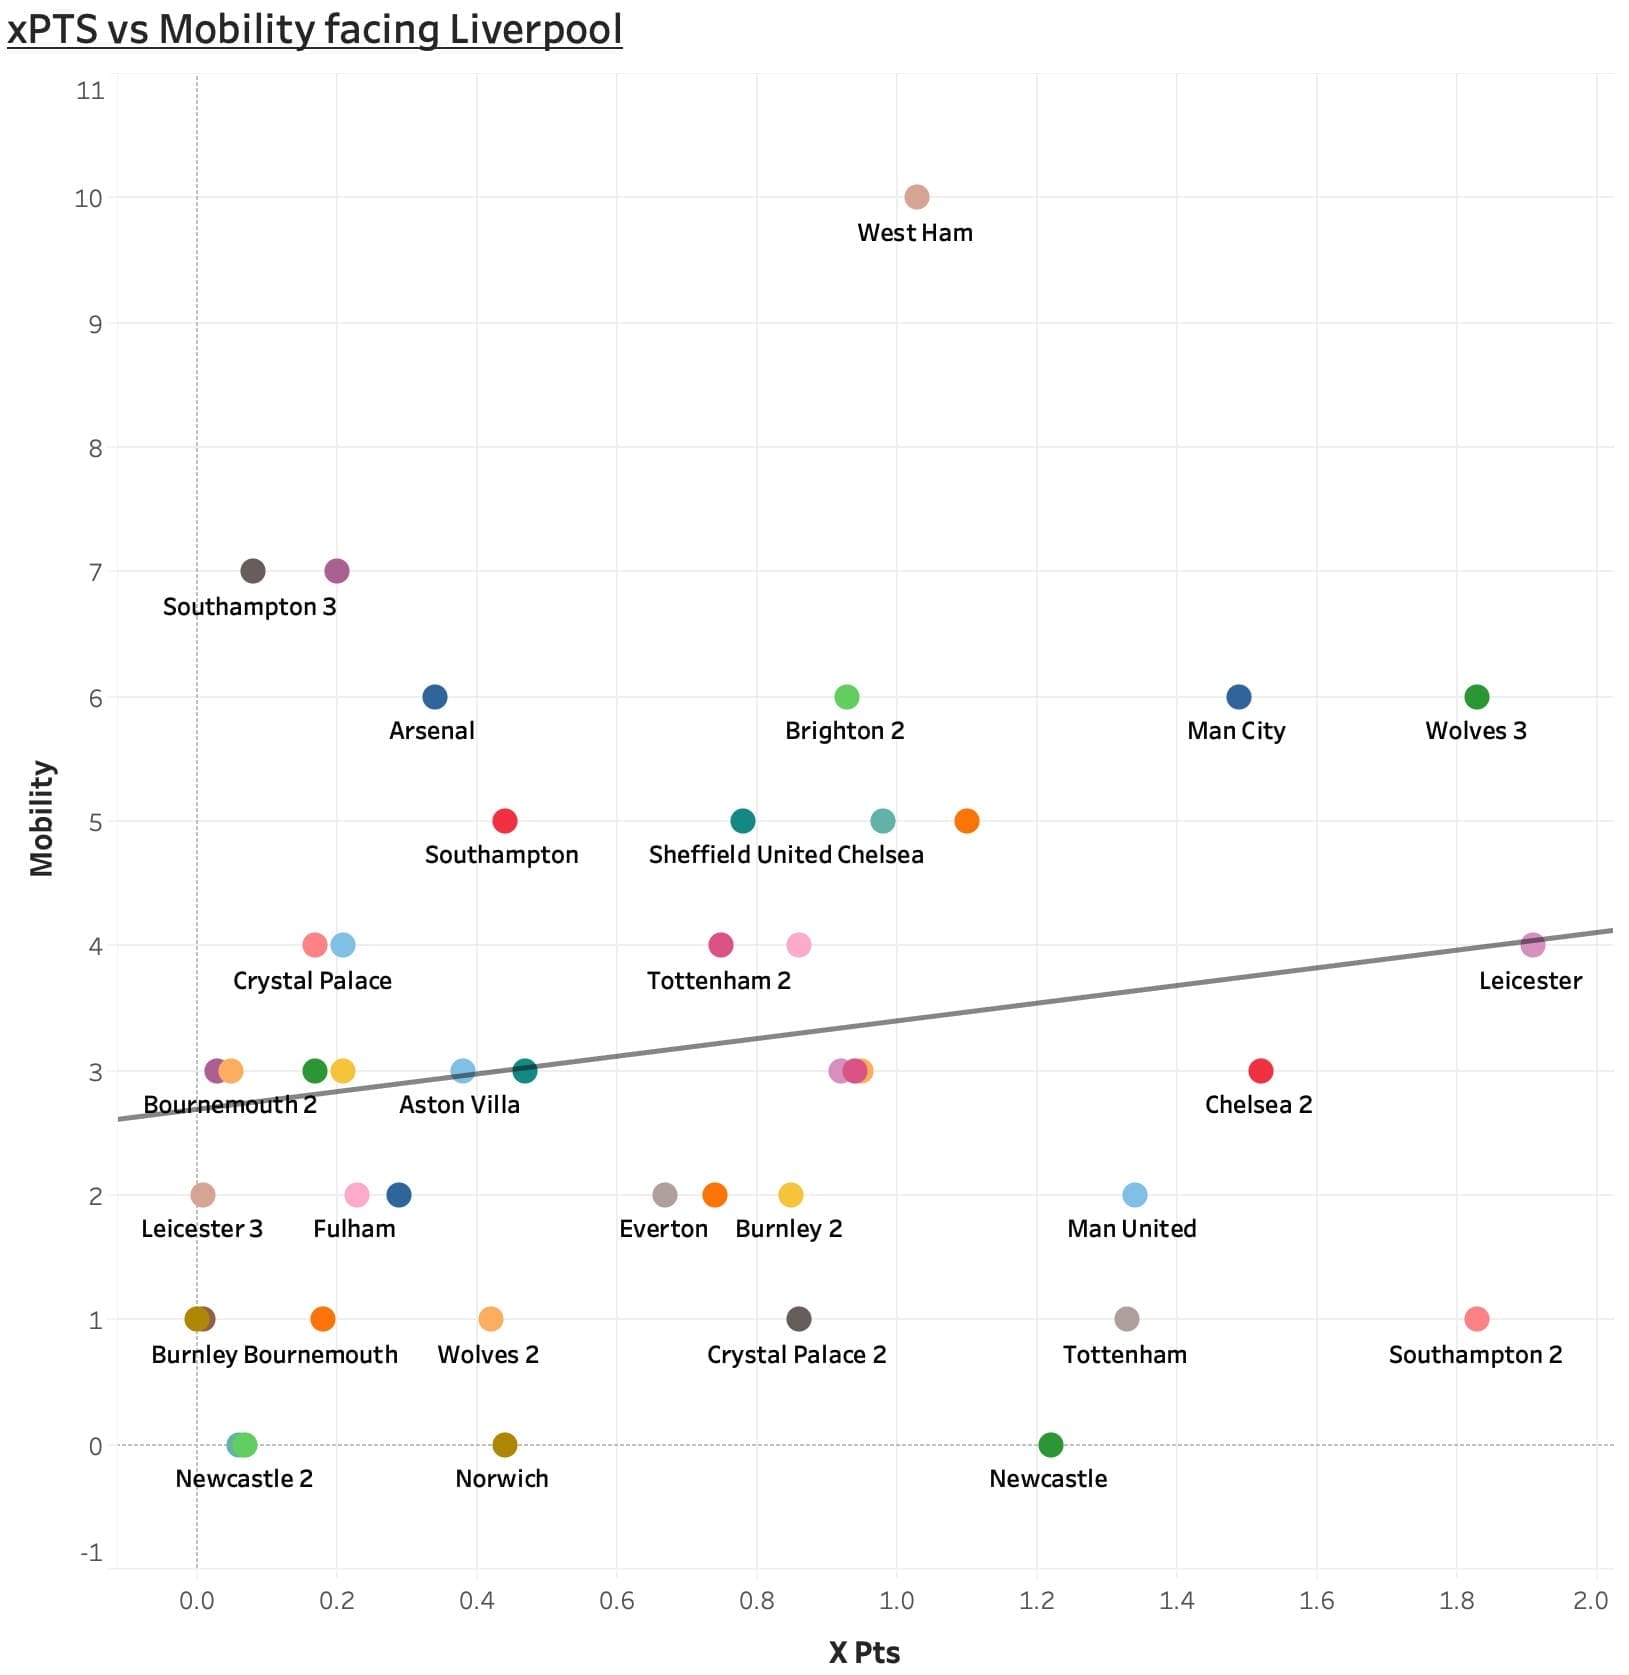
The graph shows there is merit in opting to transition quickly aginst the Reds, despite their notorious counter-press. The teams that achieved the highest levels of success were Leicester who counter-attacked four times. The graph shows there’s a balance required between countering at every given opportunity, which would leave you susceptible defensively, and countering at the opportune moments.
By countering between 3-6 times per match we can see teams have yielded a good level of success, demonstrating the ability to pick the right moments to commit players in transition. Teams who have tipped over the balance such as ‘West Ham’, who attempted 10 counter-attacks, suffered with their xPTS. This, however, is not as detrimental as the teams who offered no counter-attacking threat. A large percentage of teams – but for a few outliers – that countered under two times in a match, saw themselves overcome too easily and achieved meagre xPTS as a result.
The second pillar of a good attacking team is width. A well-known rule of football is to make the pitch as wide as possible when in attack, and as small as possible when defending. To find a metric that reflected a team’s ability to create width, I turned to crossing frequency. Again, this metric is not a perfect reflection of this pillar, due to the fact that a team can tactically create width to create spaces or overloads elsewhere on the pitch. However, to demonstrate this using one numerical figure, crossing frequency was the most appropriate statistic available.
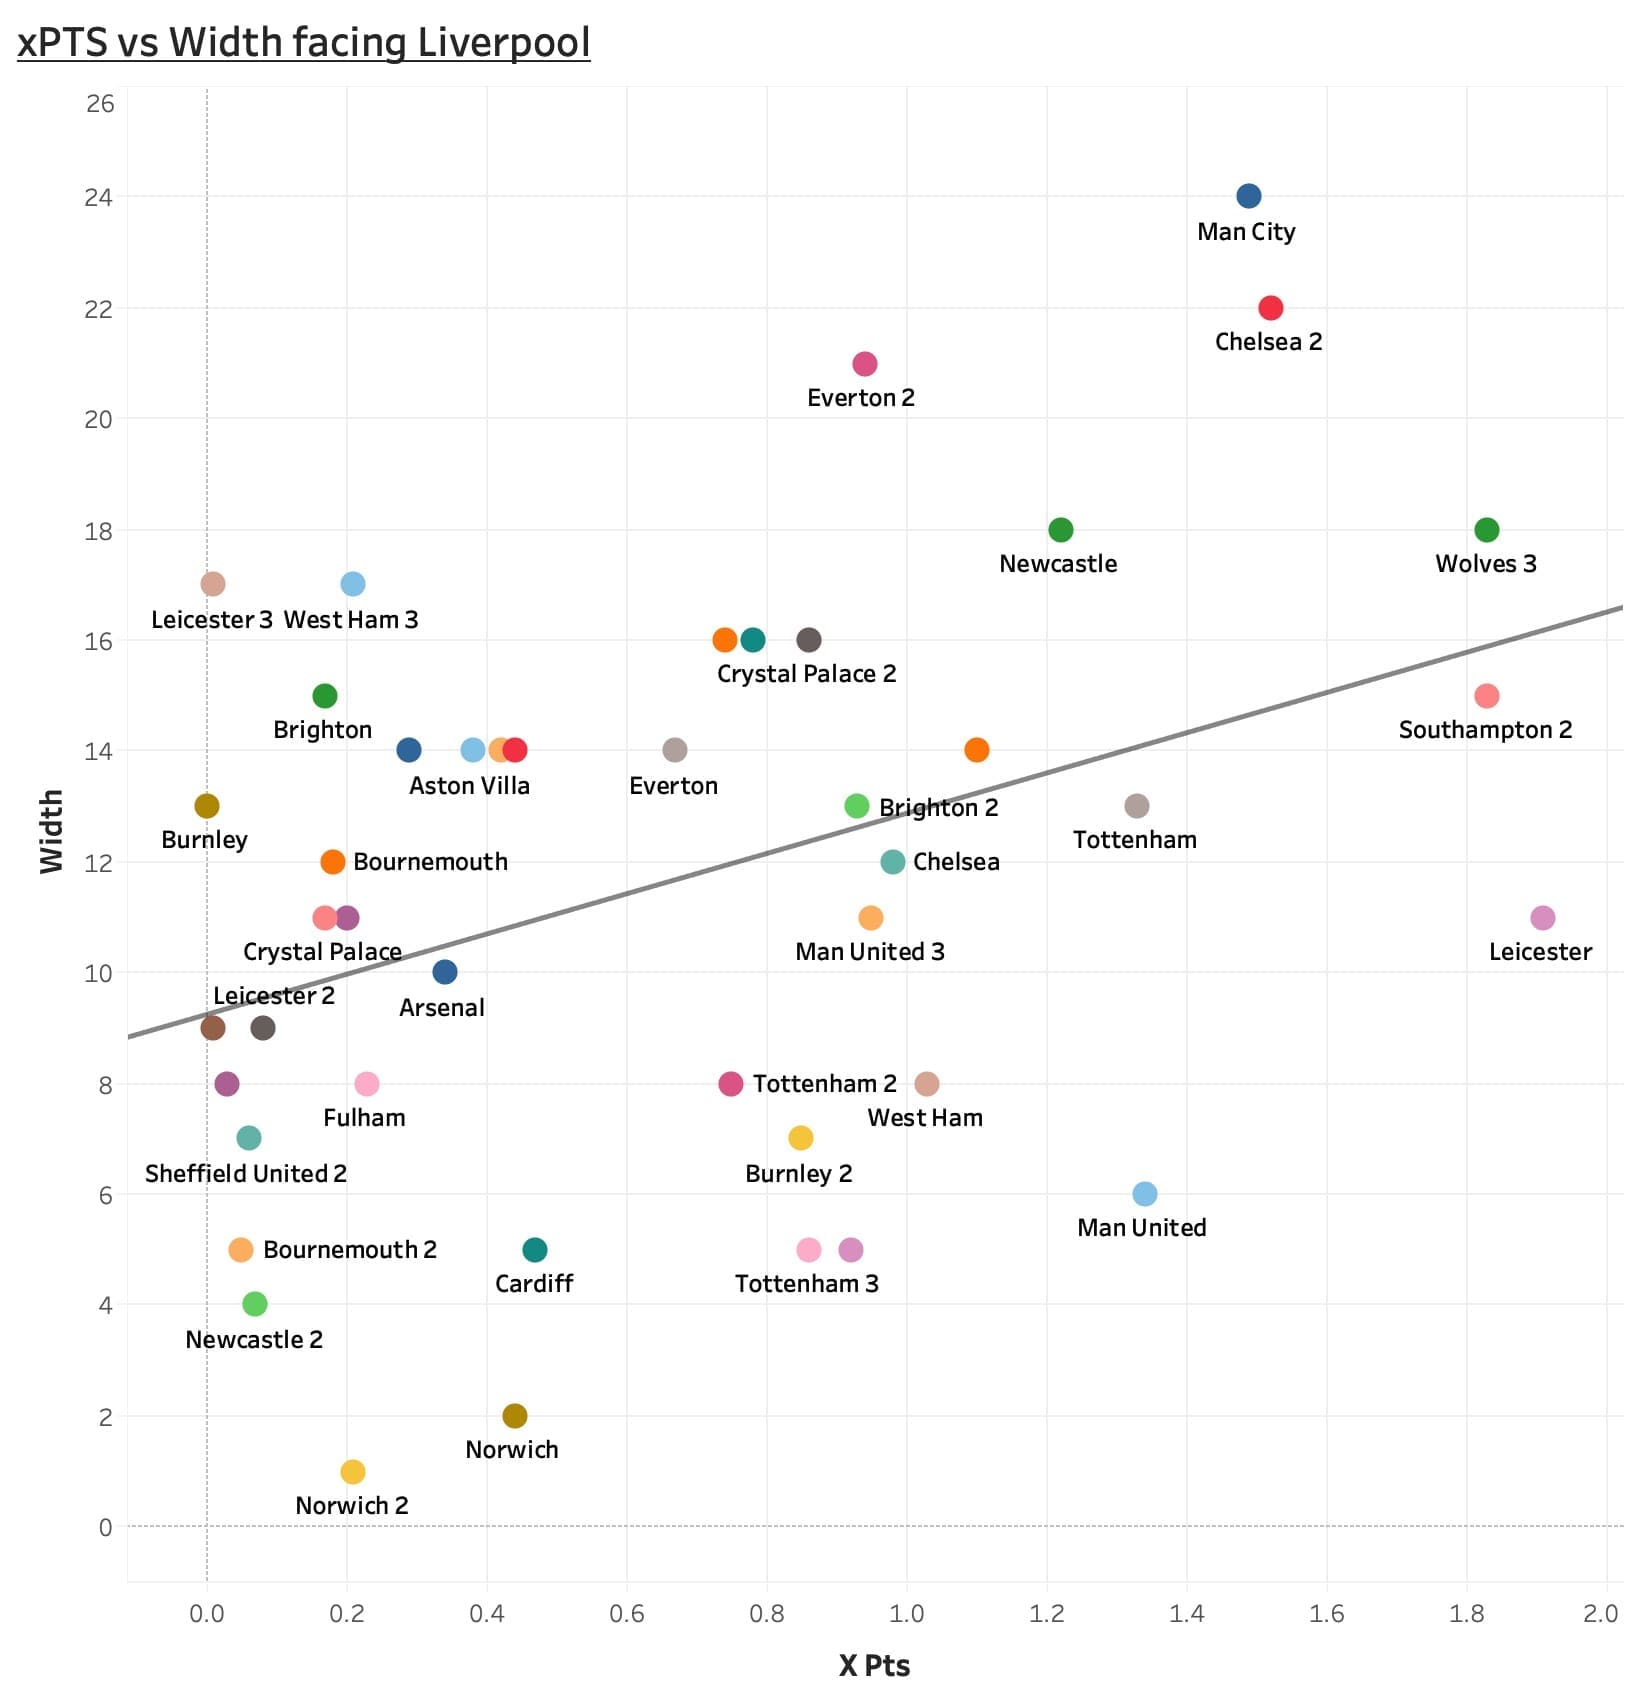
Once again, the correlation is clear. The analysis shows crossing is linked to a team’s success against the North-Western club. From the 44 games, the more crosses teams have chosen to deliver, the more points you will earn against Liverpool. What we can also take from this graph is that there’s a balance to crossing frequency. Too many ineffectual crosses means handing the ball back to Liverpool, and therefore being at risk of conceding. Too few crosses allow Liverpool to be comfortable in their defensive shape, not having to deal with deliveries into their area. Where the graph lacks information, and this is due to us using it for an indication of width, is from where the crosses are taken. This information would give a better understanding of the optimum frequency a side would need to cross, and from where to be most effective. From this graph alone, however, we can deduce that the more width a team operates against Liverpool – despite the obvious risks – is the more xPTS a team will achieve.
The final facet to a successful attacking team is penetration. This is a metric that’s also complicated to measure by using just one value. Penetration is the ability a side possess in breaking through the defensive lines of their opponent. A team that can penetrate more easily will inevitably see better chances at goal, due to their ability to get closer. As a result, I opted to use the average shot distance (metres) as the measure for penetration.
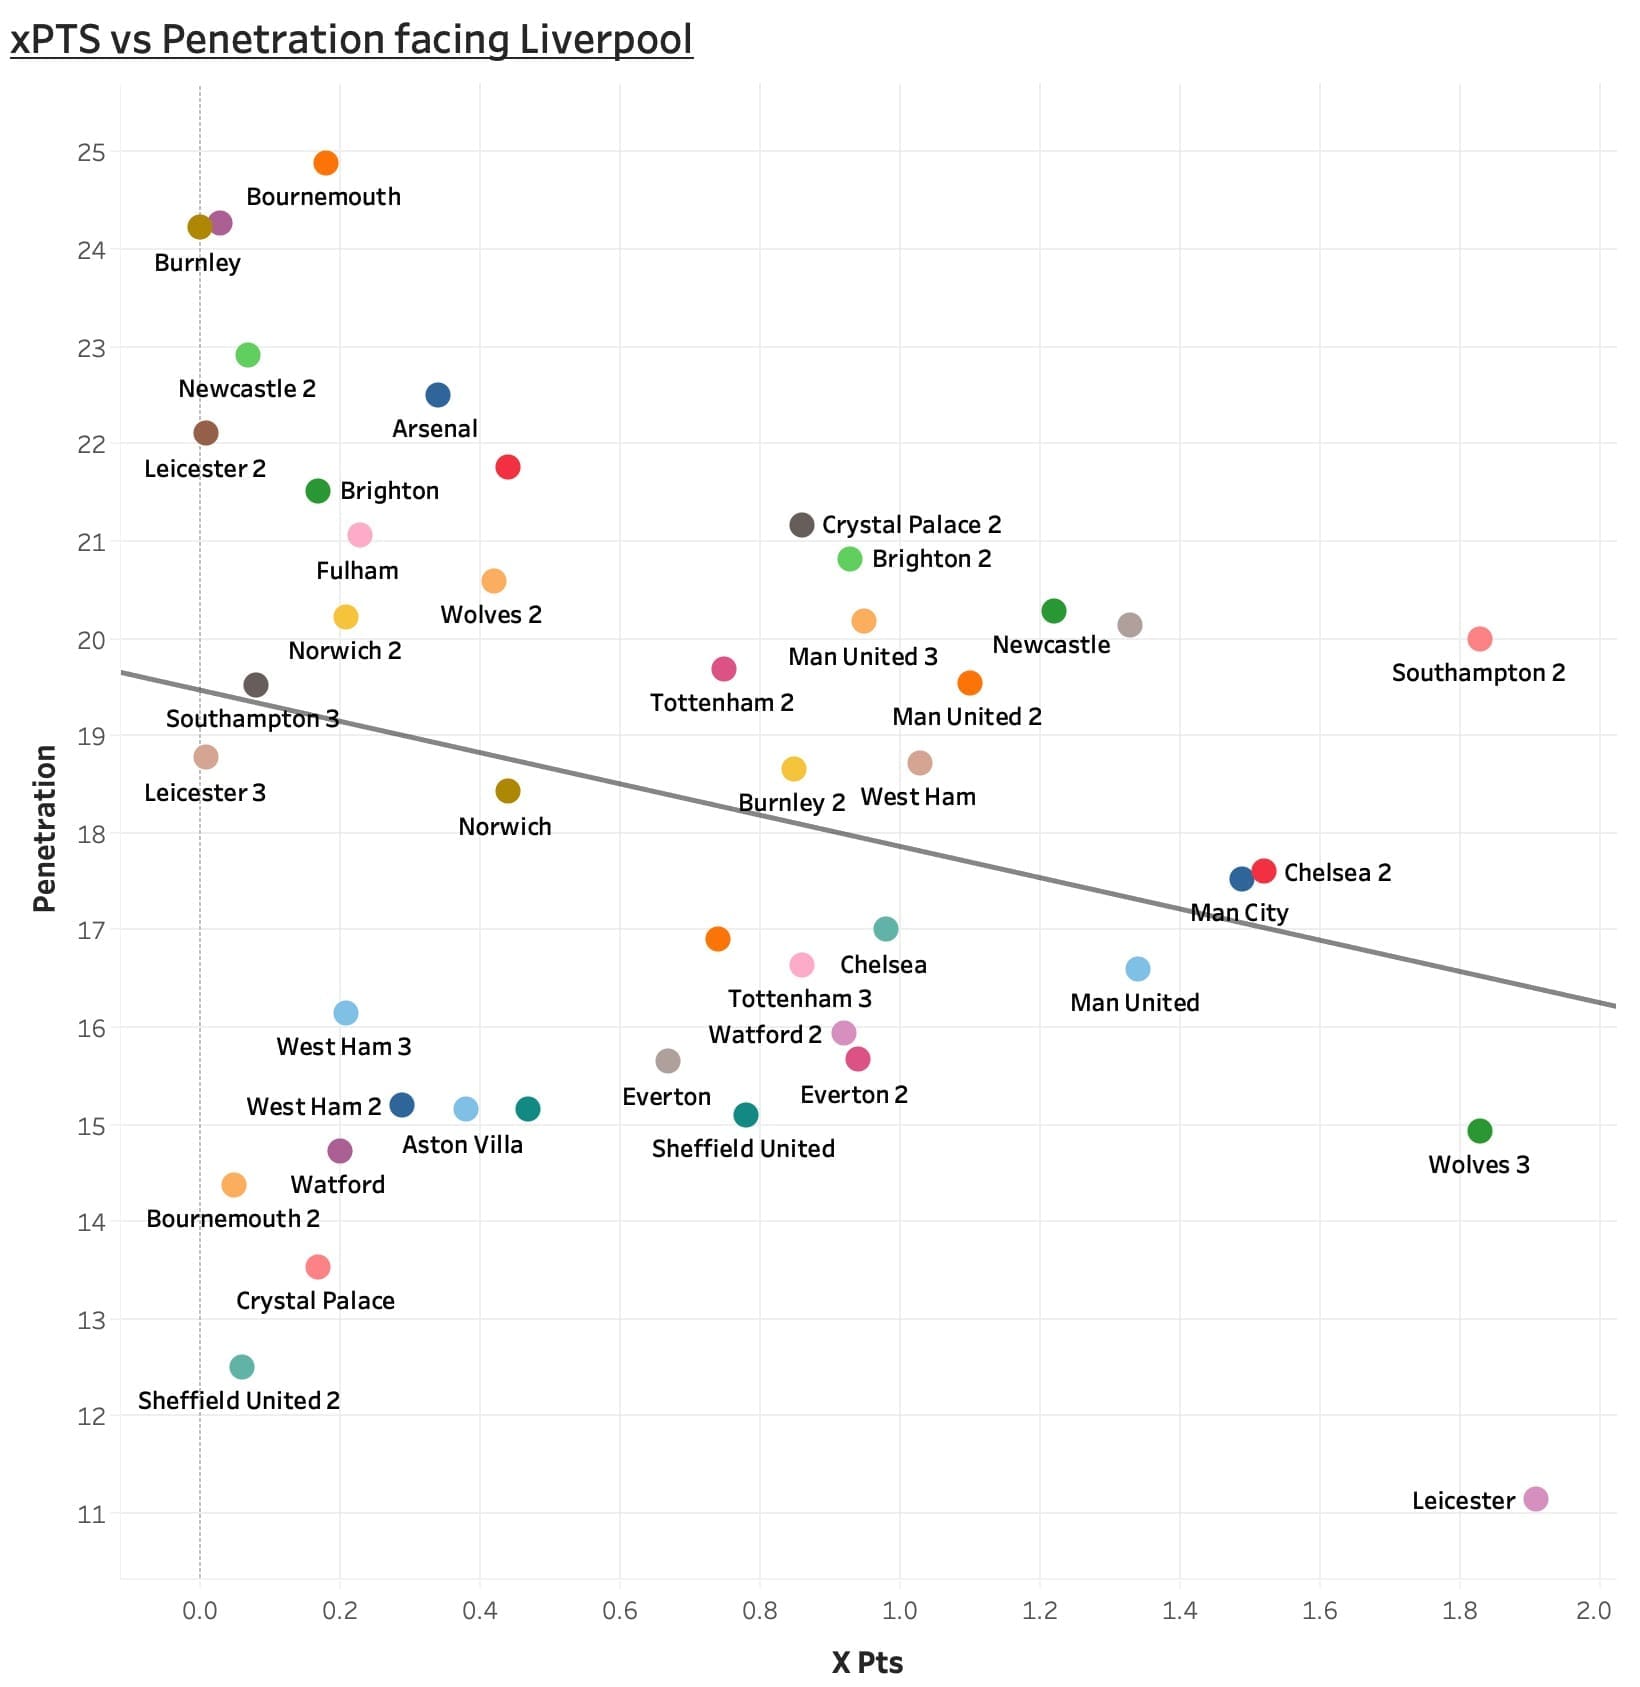
The results are as expected. Teams who are taking fewer shots and waiting for opportunities closer at goal are seeing better success. The graph shows that the additional tactical flexibility and risk required in order to penetrate more effectively is beneficial to the likelihood of winning. We can see above that too often teams are under committing players forward, and therefore being reduced to longer efforts at goal. Whilst this may seem like a safer option that will leave your team more defensively secure, it’s actually a false economy and teams end up with fewer xPTS to show for it. The graph tells us to take risks against Liverpool, as it will result in additional penetration (closer shots at goal) and ultimately garner more points in the long run.
So what have we learned?
We have looked at the defensive DNA a team requires to be effective against Liverpool by using metrics that underpin the cornerstones of defending. From this, we can deduce that a starting point for our defensive tactics is aggression as opposed to a containing, passive system. We can then progress this to say that the risk levels of being aggressive higher up the pitch outweigh the safety of dropping off and defending deep. We have also learned that interceptions – though not the best measure of compactness – shows little correlation to xPTS, and is likely outweighed by what is done with possession once it’s been recovered.
After establishing our defensive philosophy, we looked at the attacking organisation required to beat Liverpool. The statistics show that a decisive counter-attacking system must be implemented in order to hurt Liverpool and not allow them to become too comfortable in possession – otherwise, xPTS plummet. Over countering is an issue, committing too many players too often reduces the chances of winning as the offensive/defensive balance becomes one-sided. Width is also key to the attacking blueprint when facing Liverpool. By delivering more crosses and operating from a more offensive, wide shape, teams are generally earning more xPTS. Finally, we’ve seen that when teams do allow for offensive flexibility by incorporating risk in their systems, that they are able to penetrate Liverpool more frequently, which improves their chance of winning.
Ultimately, there’s no one specific way to beat Liverpool. All managers can do is interpret the numbers that are put in front of them and come to their own conclusions about the optimum way to win. What we have done here, is show that blueprints can be created from the hidden numbers and answers are often more complicated.




Comments