A year on from the somewhat risky appointment of Julen Lopetegui, it seems as if the risk has paid off for Sevilla. Despite a huge turnover of players in the summer window, the Spaniard achieved just their second top four finish in nine years alongside a Europa League final. This data analysis will outline how Lopetegui managed to bring so much success in just his first season in Seville, and how he approaches games and gets results. It will also take a wider look at how Sevilla shaped up statistically against other teams in La Liga in the prolonged 2019/20 season.
Season overview
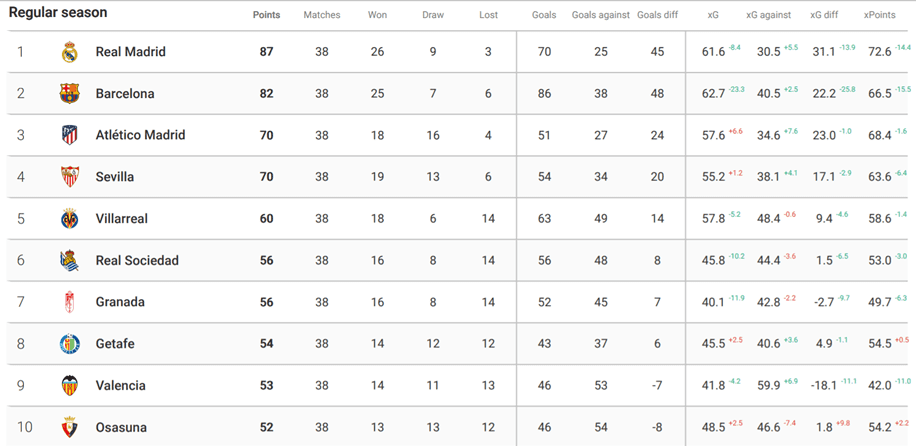
In the summer of 2019, Sevilla experienced nothing short of a squad overhaul. Over ten players left, including the big names of Wissam Ben Yedder and last season’s star man Pablo Sarabia. They made notable replacements, including Lucas Ocampos, Fernando, Sergio Reguilón, Jules Koundé and Diego Carlos, and in the winter, Suso and Youssef En-Nesyri. Despite the high turnover of players, Sevilla impressed, and between November 10th and the season’s end they only spent two weeks outside of the top four. They breezed through their Europa League group and didn’t lose any of their final 15 league matches. This wasn’t enough to take third place off of Atlético Madrid however, meaning they finished fourth with 70 points, scoring 54 and conceding just 34.
The system
Lopetegui employs a possession-based 4-3-3, whereby the full-backs are pushed extremely high (often acting as wing-backs) and the striker is usually a physical hold-up man – Luuk de Jong and En-Nesyri were their two strikers of choice this season. The wingers will occasionally drift inside to get close to the front man, and one (sometimes two) of the midfield three will also push high to support the striker. This allows for a one or two-man pivot in front of the defence, which can cover the absent wing-backs and prevent frailties when facing a counter-attack. The most frequent centre-half pairing this season was Carlos and Koundé. Both men enjoyed great seasons and are quick, strong and also great passers of the football – their passing success rates for the season were 88.55% and 91.02% respectively.
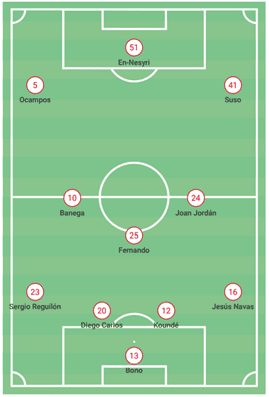
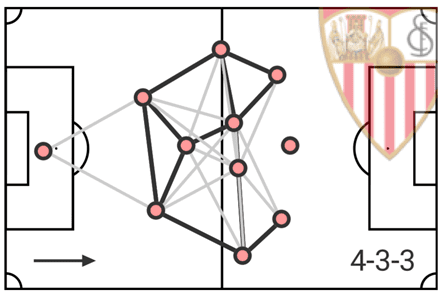
The pictures above show their most used starting eleven from this season and also their general shape with passes mapped – a darker line signifies a more frequent passing route. The loneliness of the striker is noticeable, but owing to the nature of striker Sevilla play with, it is not his job to be involved in building-up play. Sevilla’s lone front-man is tasked with occupying opposition defenders and finding space in the box to convert chances. The centre-backs and one-man pivot will keep the ball amongst themselves until a chance arises to shift it forwards to either the wing-backs or the midfielders (usually to journeyman playmaker Éver Banega). While Sevilla opted for a 4-3-3 in 54.3% of matches, in tighter scenarios Lopetegui played a 4-2-3-1 (16.5% of the time), with the two-man pivot ahead for extra stability.
Protect the football
Sevilla scored 54 league goals this season, 7.1 more than the La Liga average of 47.1. Yet, they scored just four of these goals in counter-attacking situations – only six teams scored less on the counter-attack. This exemplifies the desire of Lopetegui to keep the ball and build up attacks slowly. Players like Banega, Suso and Navas have the technical ability to effectively play this way, and by keeping possession and moving the opposition around ahead of them, Sevilla can begin to structure their attacks. The graph below maps the possession and passing figures of La Liga teams for the 2019/20 season.
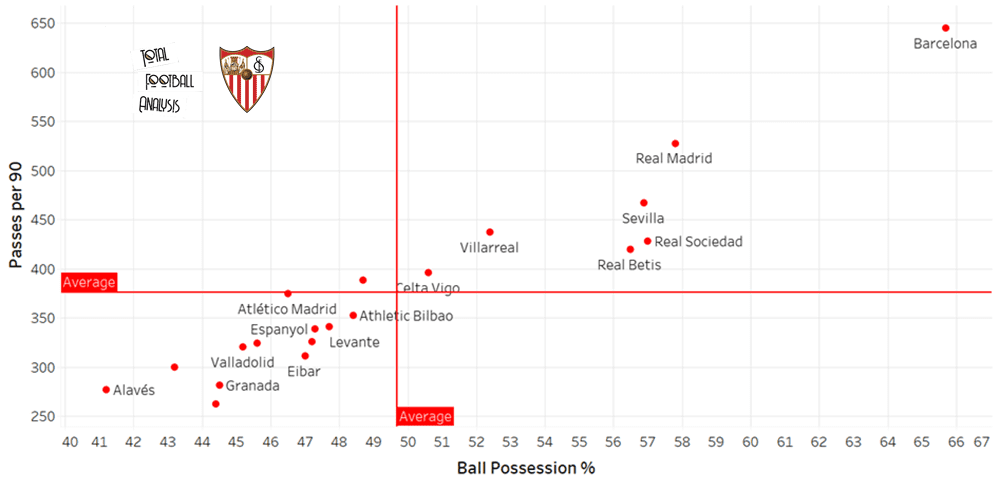
Sevilla are one of only seven teams to have made an above average number of passes per 90 and hold an above average amount of possession this season. With 466.9 passes per 90, just Real Madrid and Barcelona made more. This is expected, given how teams approach games against the two Spanish giants, and therefore the high figure that Sevilla post suggests more of a skill at keeping the football, rather than an allowance to keep it. This is backed up by the fact that they averaged a ball possession of 56.9% over the course the season – a figure higher than 16 teams.
The average duration of a Sevilla possession this season was 15.9 seconds – the fifth highest in the league – and they achieved a total of 245 possession spanning longer than 45 seconds, dwarfing the average of 169.2. With a team pass completion rate of over 87%, Sevilla clearly know how to pick a pass. However, these passes wouldn’t be possible without a malleable shape and movement ahead of the passer.
Sevilla are very flexible in their movements in order to facilitate a possession-based game. The picture below displays the average positions of Sevilla players in two of their recent games: a 1-0 win against Valencia on the final day of the La Liga season (left) and a 2-0 win against Roma in the last 16 of the Europa League (right).
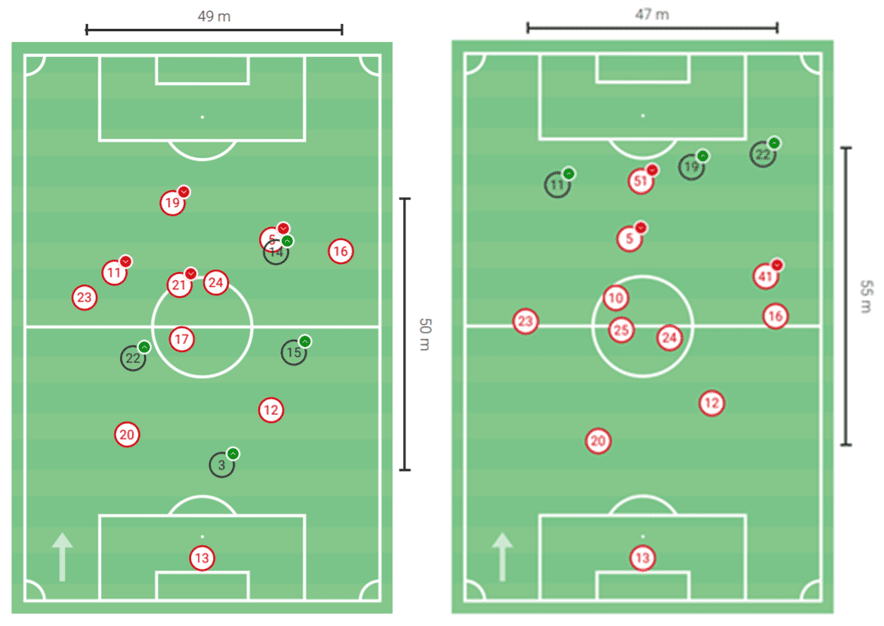
What’s prevalent is the lack of consistency in the formations. While they employ a 4-3-3 on paper, Sevilla are able to identify opponents’ weaknesses and adapt their game to exploit them. In the Valencia, picture we can see a cluster of five players towards the left-hand side. By grouping together in this space, Sevilla could play around Valencia’s weak right flank and keep possession more effectively. In the Roma game, we can see that Suso and Navas stayed wide and close, as they were able to interchange play and utilise Roma’s use of a back-three to gain space.
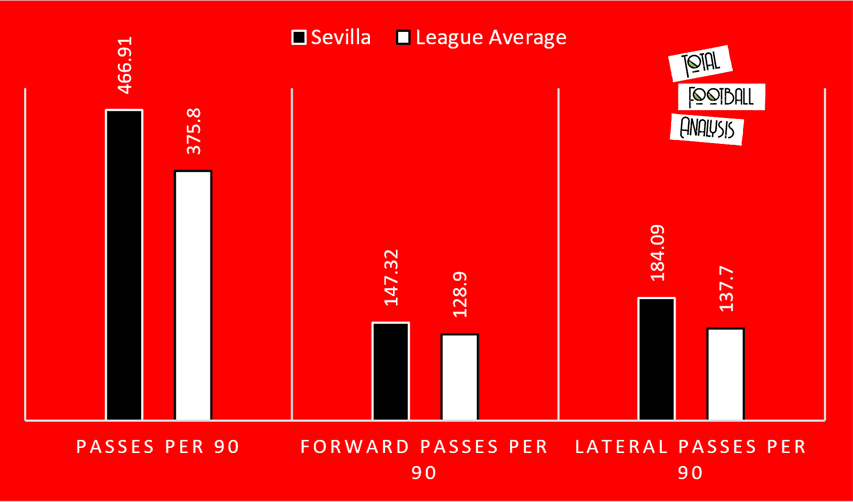
From just two examples, we can see that Lopetegui is willing and able to adapt his team’s shape during a game in order to maintain dominance. The desire to protect possession in midfield and defence and wait for a chance to penetrate the opposition is shown by the graph below. While Sevilla make 91.11 more passes per 90 than the La Liga average, they make just 18.42 more forward passes per 90, but 46.39 more lateral passes per 90.
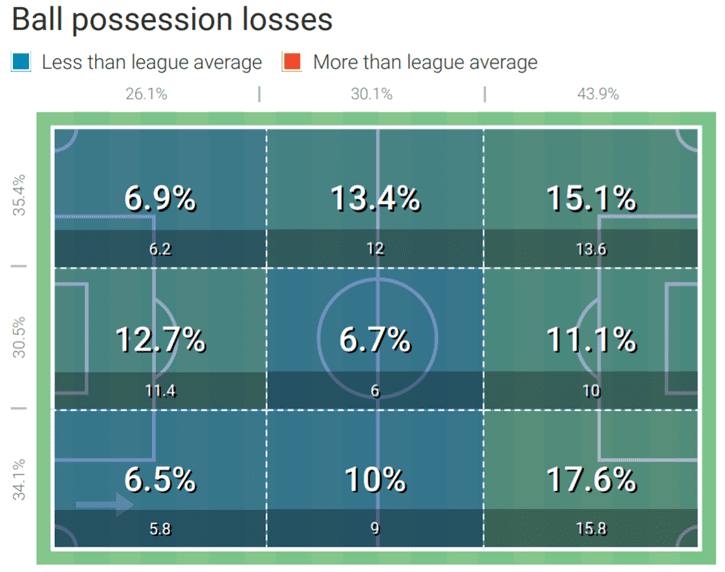
Via studying the data in the map below, we can conclude Sevilla’s confidence and safety when holding possession in the defensive and middle third. Despite having 92.47 losses per 90, just 50.46 of these are in the backmost two thirds.
Getting into the final third
While it is good to hold possession for such a large amount of time, it counts for nothing if you cannot create chances from it. For Sevilla however, this is not the case. They scored 54 goals in La Liga this season – the joint fourth most – against an xG of 55.2. Clearly they can create chances off of their extended periods of possession.
A lot of credit for this can be given to their midfield maestro, Banega, who himself made the seventh most passes in the league this season with 70.69 per 90. More impressive though is the fact that he made the second most progressive passes and the second most passes into the final third of any La Liga player in the 2019/20 season. With 13.14 progressive passes per 90, only Jordi Alba made more. His figure of 14.08 passes to the final third per 90 this season was only bettered by Fran Mérida, but also shows that a staggering 19.9% of all of his passes are into the final third.
While Sevilla can patiently build-up, it is Banega who can find the spaces in opposition defences. His output contributes to Sevilla’s overall progressive passing figures, which are mapped against through passes below with all La Liga teams.
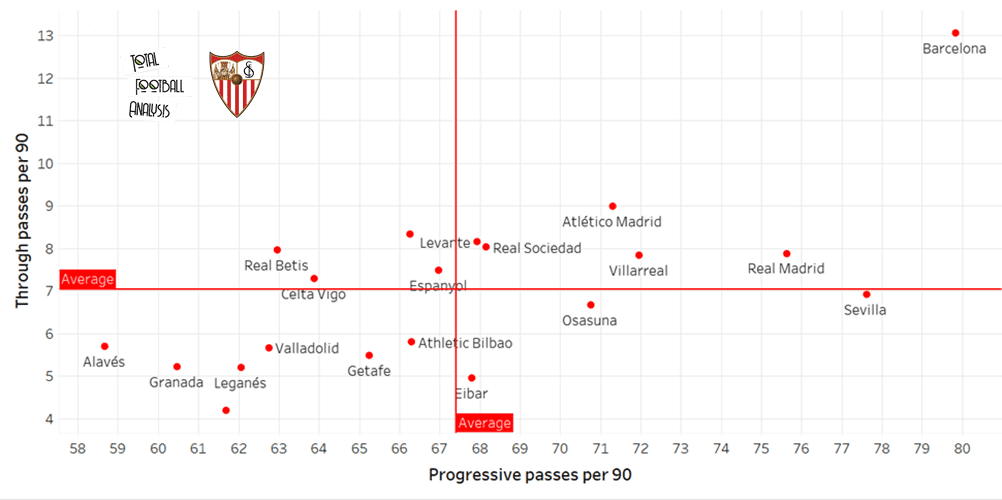
We can see that Sevilla make 77.62 progressive passes per 90 – a figure only bettered by Barcelona. Interestingly, they make just the 11th most through passes, with 6.92 per 90, which is slightly below the average of 7.04. It seems strange that a team so adept at progressing the football do not do so with through balls, but we can understand that passes into feet have a higher chance of reaching the intended receiver and therefore retaining possession. So, by opting for the through ball at a much lower rate, Sevilla can keep possession more effectively higher up the pitch and carve out chances to score.
Creating (and taking) chances
Sevilla scored 54 goals this season, more than 15 La Liga teams. Against an xG of 55.2, this shows that they can create chances well and, despite a tiny inefficiency, take them relatively well also. Only Real Madrid and Barcelona took more shots than Sevilla this season. Lopetegui’s men averaged 11.3 shots per 90 against a league average of 9.87. Top scorer Lucas Ocampos took 86 shots on goals this season and scored 14 times – only five players scored more in the league.
Although a left-winger by nature – Ocampos frequently drifted inside this season to support the lone front man. It was this movement that got him his goals. Not only does he create space for the left wing-back by bringing the opposition full-back inside, he opens up the pitch for himself by drifting inwards, giving him freedom to attack the penalty area following a cross.
By keeping the ball and spreading opposition defences, Sevilla’s main attacking aim is to shift the ball out to captain Navas on the right-wing where he can deliver a cross. Note in the crossing map below not only the increased frequency by which crosses come in from the right-hand side, but the increased accuracy of them too.
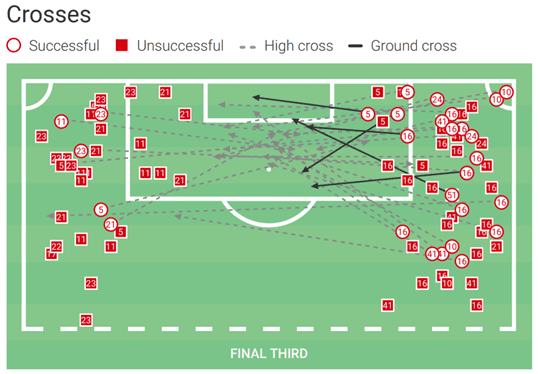
Navas himself made 6.15 crosses per 90 this season – the most in the league and 1.07 more per 90 than the next best. His success rate of 35% is no mean feat also. When someone crosses with this volume and accuracy, you are bound to get goals from it. As mentioned, Ocampos liked to drift into central positions, and as he often did so unchecked, Navas could frequently pick him out in the middle. With strikers En-Nesyri and de Jong to choose from, Sevilla also possessed an aerial threat with crosses into the box – it was a cross to de Jong that resulted in the winner in their Europa League semi-final against Manchester United.
By keeping the ball so well in the middle third, they can displace the opposition as they chase the ball. When the moment is right, a quick shift out wide and a cross into the box can be devastating, especially when Navas, with an xA of 6.66 for the season, is one of the men delivering the ball.
It is not only Navas who is keen to cross, but the team as a whole. The fluid 4-3-3 allows wingers, wing-backs and midfielders to drift into crossing positions and also enter the penalty area themselves with the aim to penetrate more directly. The graph below shows crosses per 90 and touches in the penalty area per 90 for La Liga teams for the season.
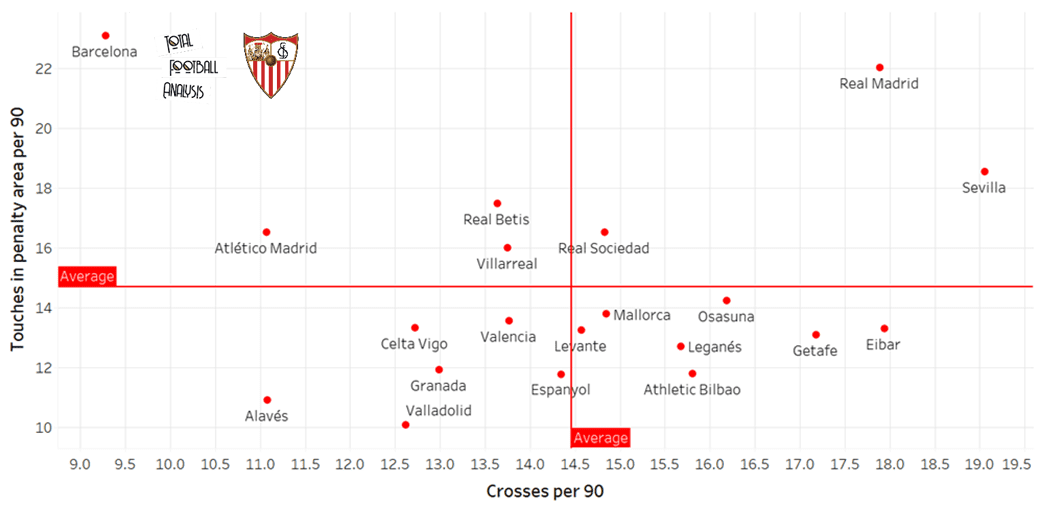
In terms of crosses, Sevilla made the most of all La Liga teams, attempting 19.06 per 90 against a league average of 14.46. This is a huge gulf, and we can conclude that a lot Sevilla’s attacking joy comes from crosses. Furthermore, with 18.53 per 90, they are above the average figure of 14.69 touches in the penalty area per 90, suggesting that even without crosses they can work the ball into the box.
Defending
Owing to their possession statistics, Sevilla don’t do an awful lot of defending. When they have to defend however, they are often successful in doing so. With just 34 goals conceded, Sevilla had the third best defensive record in La Liga.
Whatever defensive struggles they experienced came from dead-ball situations. 36% of the goals they conceded were either direct from a free kick or penalty or following a set-piece. While they defend well in open play, the lack of height across their midfield and back line must be a contributing factor. Of their most regular midfield and defence, just one player is taller than six foot. Balls in the box will cause Sevilla problems due to their lack of defensive physicality.
Their open play defending however was excellent this season. Sevilla are keen to press opponents high and win back possession early – their PPDA figure of 7.67 is bettered only by Getafe, and this can lead to winning possession back high up the pitch. Shown below is their final third recovery map from July.
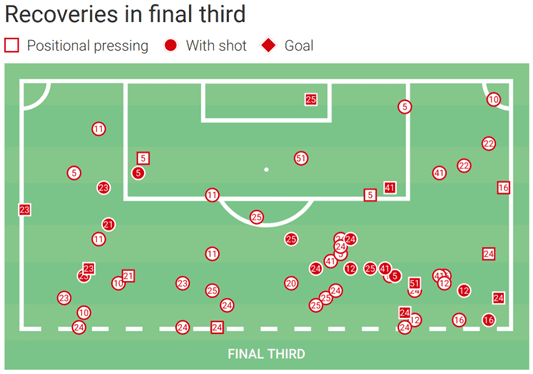
Their often midfield pivot, Fernando, made eight of these recoveries which led to a total xG of 0.92. Fernando is a key defensive player for Sevilla, his 6.69 interceptions per 90 is the fifth highest figure in the league. Even if Sevilla do not win the ball back early in their counter-press, the pace of their centre-halves is enough to cover any gaps that may be left. Only three teams conceded less goals than Sevilla on the counter-attack this season. This is impressive considering Sevilla attack with so much fluidity and is really a testament to their centre-backs.
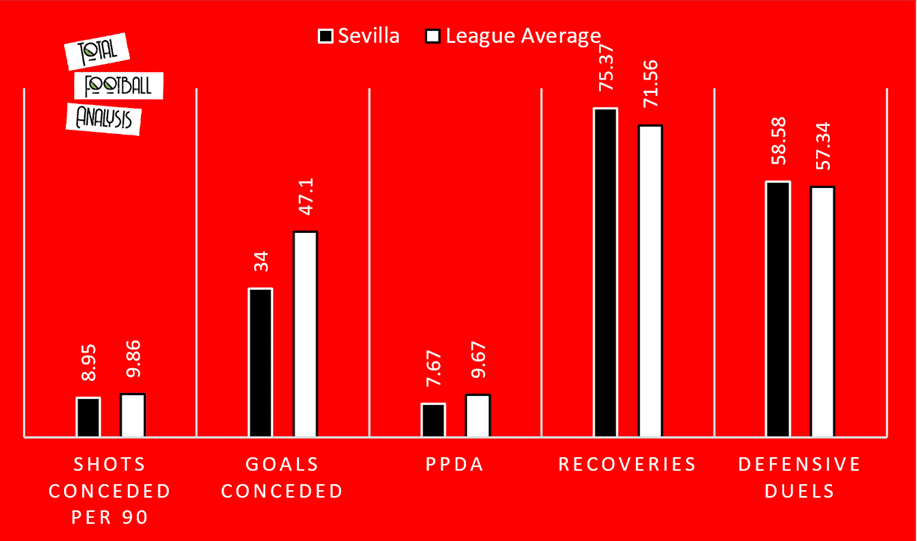
While Sevilla aim to win the ball back high, the majority of their recoveries come in the final third with them soaking up pressure and crowding out the opposition. They averaged 75.37 recoveries per 90, while the league average was 71.56. With a defensive duel intensity of 6.7 also (the second highest in La Liga), Sevilla are adept at winning the ball back deep inside their half.
Ultimately, this all leads to a reduced number of shots faced and goals conceded. Sevilla faced an average of just 8.95 against a league average of 9.86. More interestingly, however, is that the average distance of a shot they faced this season was 19.29 metres – the lonest distance in the league, further personifying how difficult Sevilla are to breakdown (providing you beat their high press also).
Conclusion
This analysis showed that Lopetegui’s first season at Sevilla can only be defined as a success. He managed to effectively employ the possession-based (yet defensively pragmatic) style of play that got him the Real Madrid job in 2018. With a clear idea of how he desired to play, Lopetegui made good signings who could seamlessly fit into the system. The likes of Navas, Ocampos, Koundé and Fernando in particular have enjoyed stellar seasons, and there is no reason why Sevilla cannot challenge the seemingly immovable top three next season. With the Europa League final awaiting, we can see that Sevilla are an efficient and effective unit at both ends of the pitch with a clear preferred style of play.


Comments