May is the month of champions.
League winners are crowned, both continentally and domestically. It’s a time of wild exuberance and the devastation of defeat as a season of work and suffering falls just short of the mark. Football fans live for May.
As we prepare for the coronation of the champions, it got us wondering, are certain tactical styles more conducive to hoisting trophies?
Put it in this perspective, Arsène Wenger won four league titles and 17 domestic cups, but he never won the Champions League. The Invincibles conquered England but bowed out of the Champions League in the quarterfinals.
Do you remember which club won the Champions League in that 2003/04 campaign? None other than a Porto side coached by a young José Mourinho. In the Arsenal ideologue’s most famed season, it was one of the game’s preeminent tacticians who claimed the highest honour.
Is there something the 2003/04 season is trying to tell us?
We had to find out. That is where this one-of-a-kind data analysis comes in. We’ve looked back at the past 15 years of continental and domestic winners, looking at the advanced metrics from the winning managers from the 2015/16 season (the oldest available season on Wyscout) to the present day. Using advanced statistics, we’ve sorted the managers into two groups, the ideologues and the tacticians. This analysis is their story as they battle for continental and domestic supremacy.
The process
This data analysis started with the end in mind. Since the objective was to identify whether ideologues or tacticians were more likely to claim domestic and continental trophies, we started by identifying each manager who has claimed a Champions League, Europa League or Conference League title in the past 15 years.
The majority of those titles were claimed by clubs in La Liga, the Premier League, Serie A and the Bundesliga. Since the continental trophies primarily reside in those countries, the domestic portion of the study came in those four leagues. We added managers to the analysis pool if they had coached a team to a domestic league or season-long cup title. Super Cup and the like were ignored. No trophy padding here. Once again, the time frame was the past 15 years. That gives us a list of 28 coaches, a few of whom did not have advanced statistics available.
To separate the managers into two camps, the Ideologues, whose game model is paramount, and the Tacticians, with fewer principles of play and a greater emphasis on matchup-specific tactics, we targeted discrepancies in data consistency. Significant differences in matches between top teams and all other opponents were key. To define what a top team looked like, we settled on clubs that were top six in the league, all Champions League matches and knockout stage games in the Europa and Conference leagues. Any team that did not meet these qualifications was shuffled into the “all other opponents” category.
After downloading spreadsheets for each manager, the next job was to separate the top clubs from the rest of the pack, highlighting the top six league finishers in each spreadsheet. Once that was done, we pulled specific KPIs to a central spreadsheet to essentially build a vision of gameplay through data. Averages were produced for matches against top teams and “all other opponents,” and then added to the central spreadsheet for direct analysis.
The images below show the results of the study. Kick back and enjoy.
Ideologues vs Tacticians – defining the pools
Let’s jump straight into it. The first task of the data analysis was to use statistics to identify performance inconsistencies.
On the one hand, there are managers who you just know what you’re going to get from them. Whether they’re on the front foot in every match or parking the bus and waiting for their moment to spring to life, some managers have a highly identifiable MO. Game in and game out, you know the game model takes the highest priority and the matchup-specific tactical tweaks are somewhat muted. They happen, but are subtle.
The tacticians operate differently. While there are still principles of play that they enforce, there are typically fewer and they’re not as strongly held. Tactical adaptation from a match-to-match basis is key. But the question is how we identify this group.
Ultimately, performance consistency is our operating principle. In a single season, one of the signs we’re looking for is a significant difference in performance metrics from one group, the top teams, to the other, the also-rans. But we’re not stopping there. Most of the coaches in the study had extensive statistical databases in Wyscout. That allows us to compare data across multiple seasons. This is where we start to see some of the differences in how managers approach the game.
Looking at our first image, Carlo Ancelotti is the star of the data visualization. During his season at Bayern Munich, there was very little difference in the percentage of possession from one group to the other. His Bayern Munich side always imposed through possession.
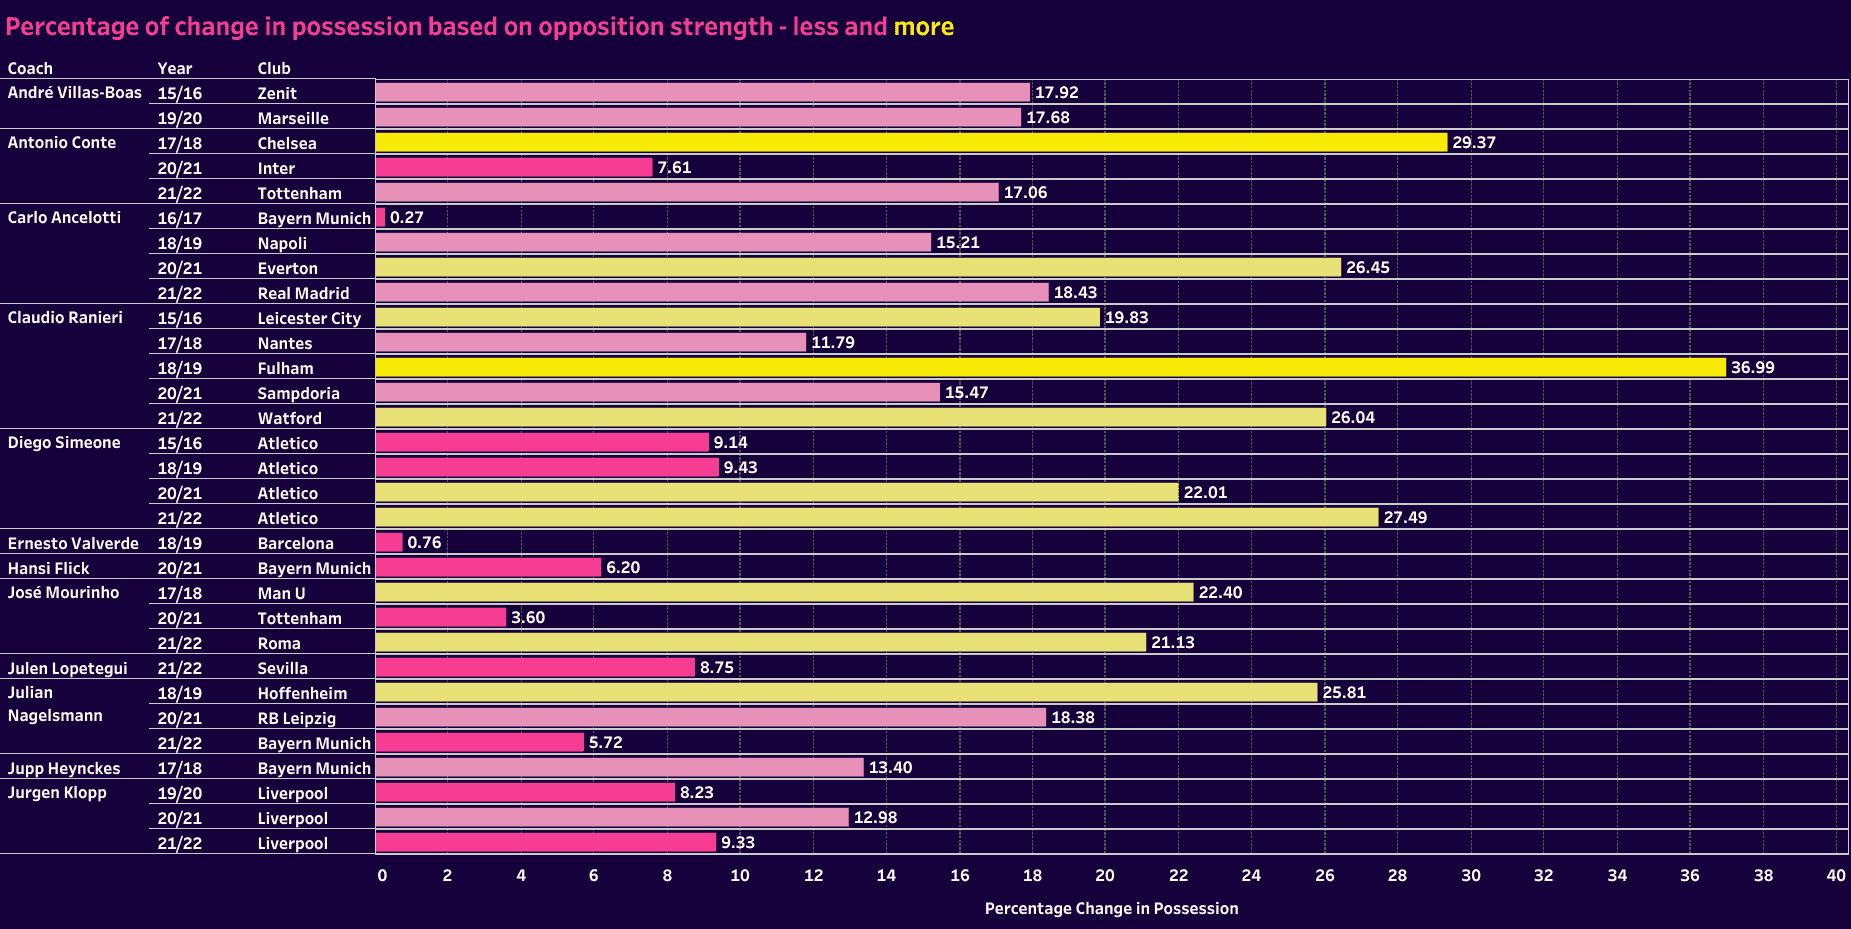
But look at his other seasons. His teams are all over the board. Compare that to Jürgen Klopp at the bottom of the visualization. His Liverpool sides were typically very consistent.
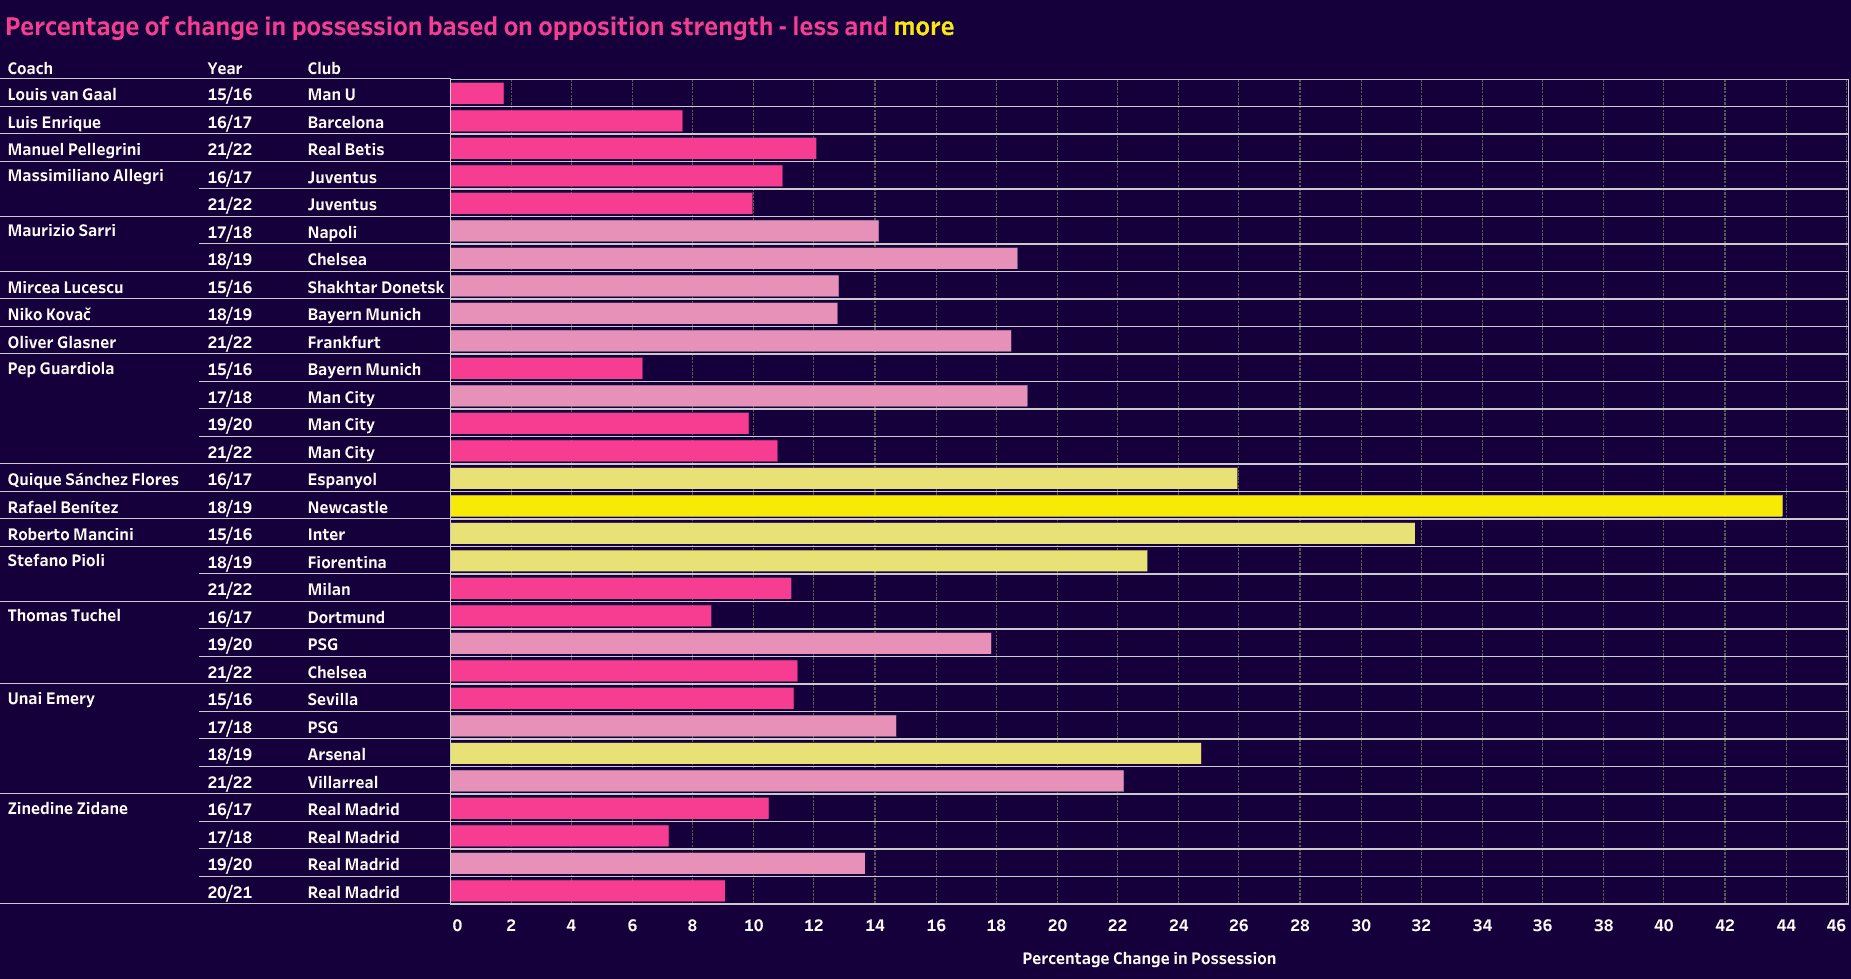
The second image contains the same information, only featuring the remaining coaches in the pool. Notice that there’s far more consistency in this group. The one manager with significant variation is Unai Emery.
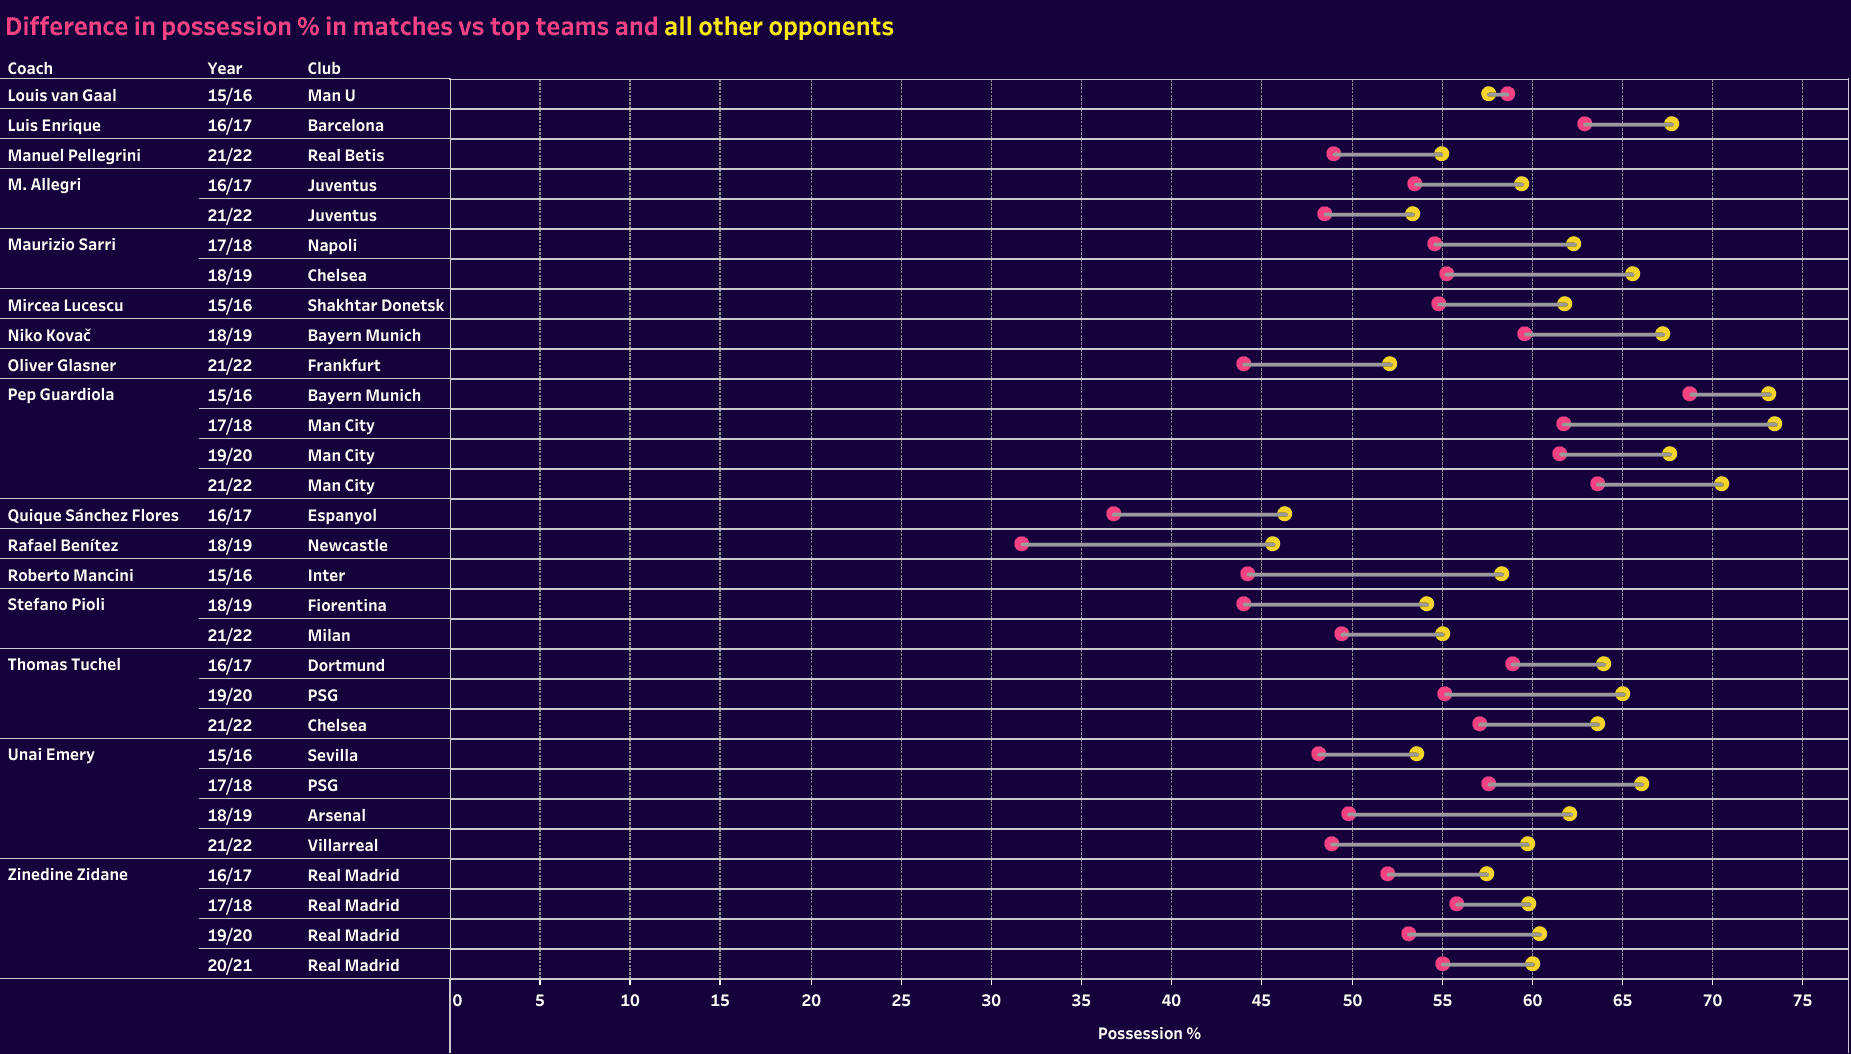
To give another visual of differences in possessions, the next two images in the analysis plot specific differences between possession versus top teams and the statistics against the rest. Greater distances between those pink and yellow points signify greater differences in the percentage of possession secured against our two groups.
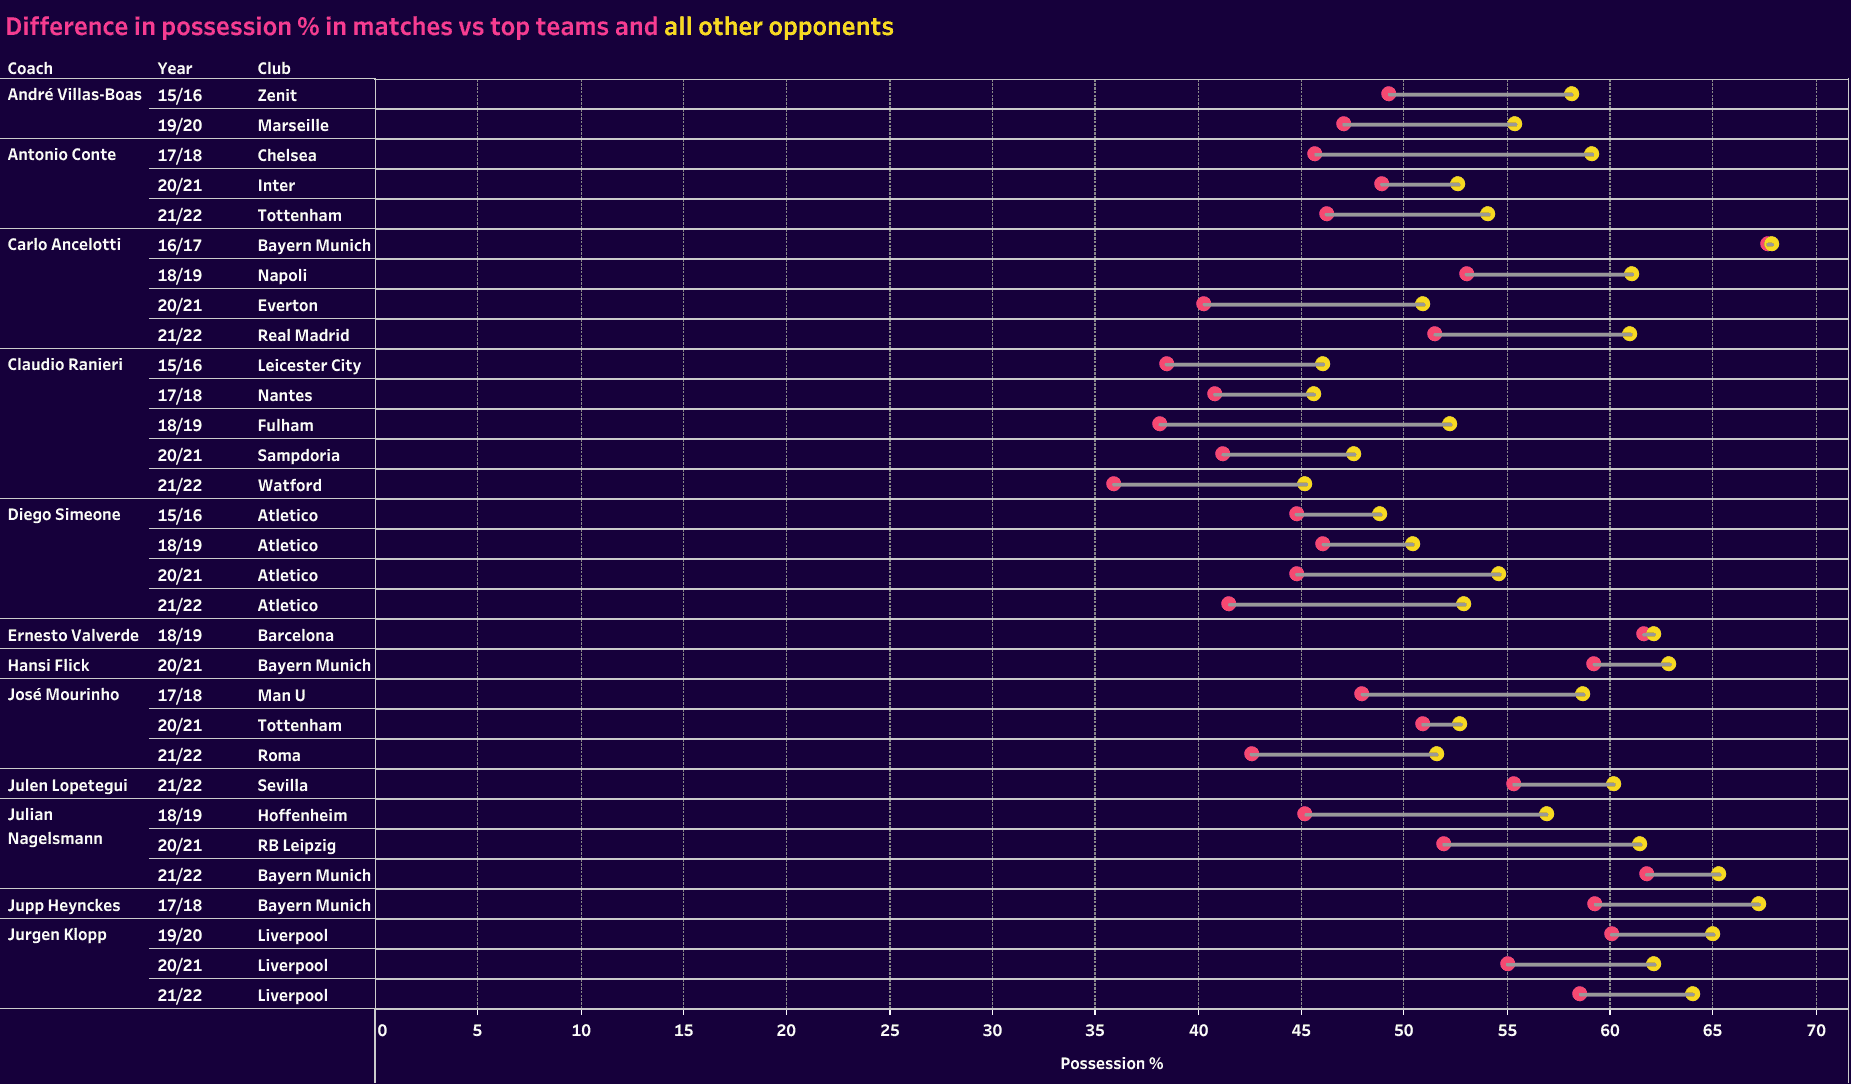
This is again where multiple seasons from specific managers can give us insights into how their teams play. There’s not much difference in possession percentages with Pep Guardiola’s teams. There is with Ancelotti and Mourinho.
Glancing now at scatterplots, we can pick up additional traits through groupings. The image representing positional attacks P90, again showing us the metrics versus top clubs and all other opponents, offers tremendous insight. The more rectangular the points, the greater the variance between the two groups. That’s one thing to look at.
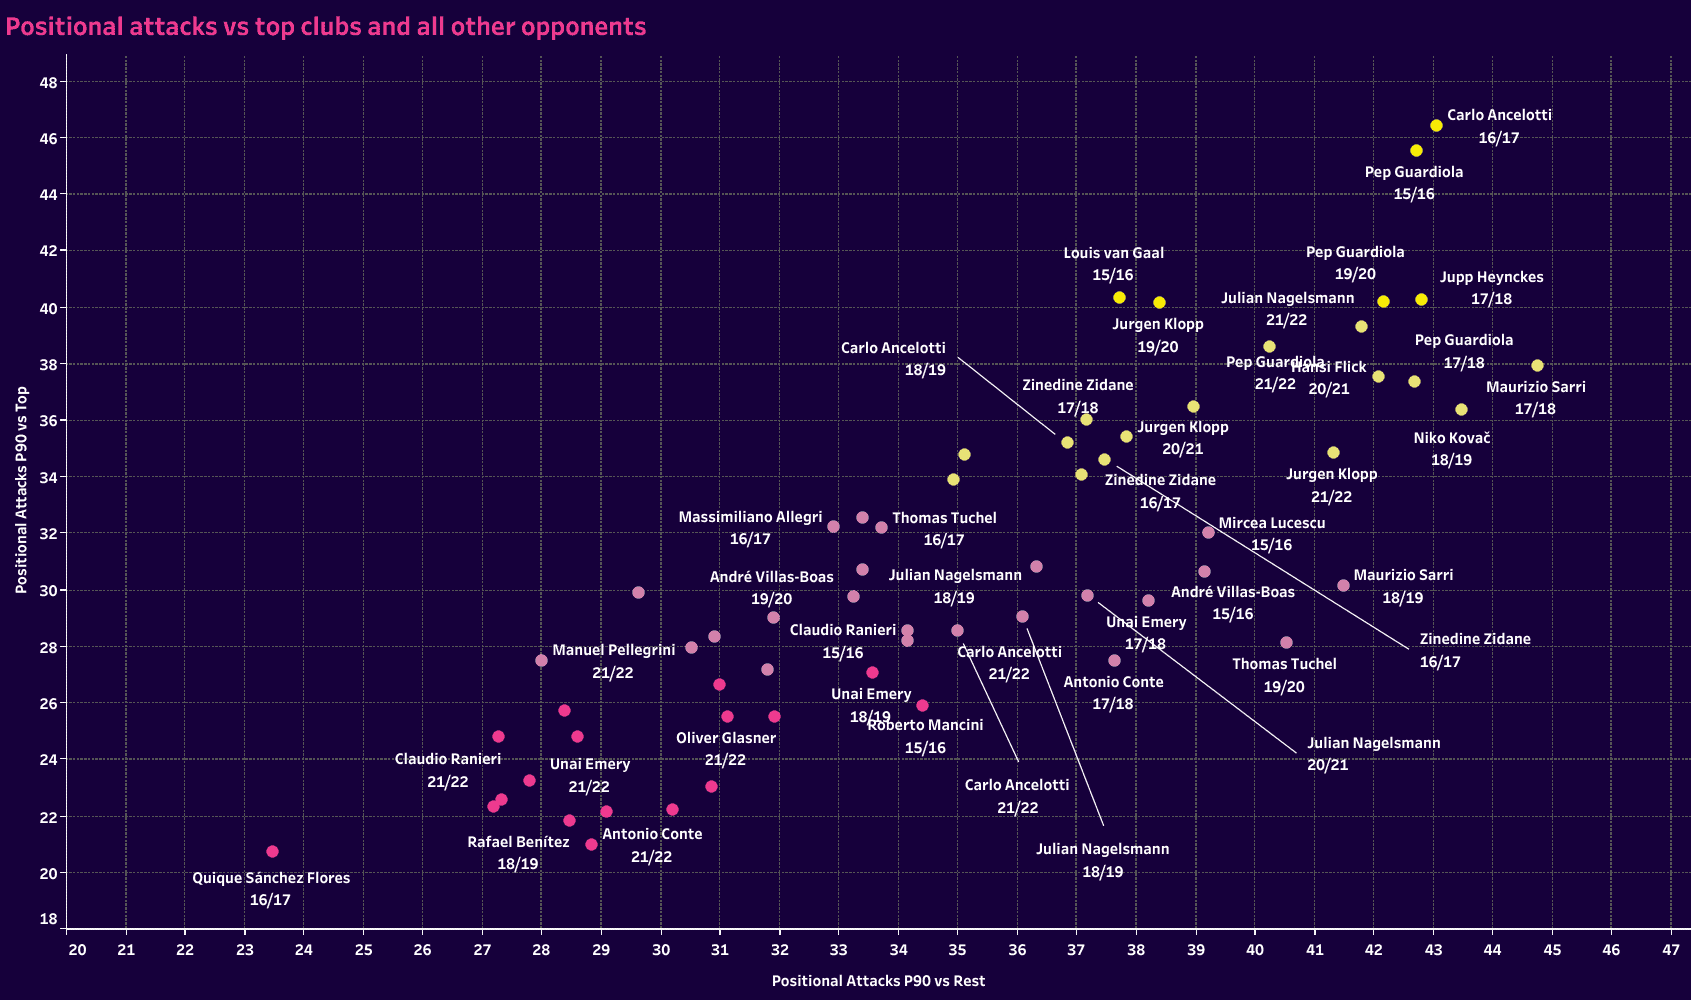
However, the second point, which is more productive, concerns the groupings of managers. Guardiola is always in that top right quadrant. Ancelotti and Emery are all over the board. The more consistent a manager’s statistical output, the more compact the groupings are. Greater distances for a specific manager are a sign of team-specific tactical adaptation. Flexibility is the key for those managers.
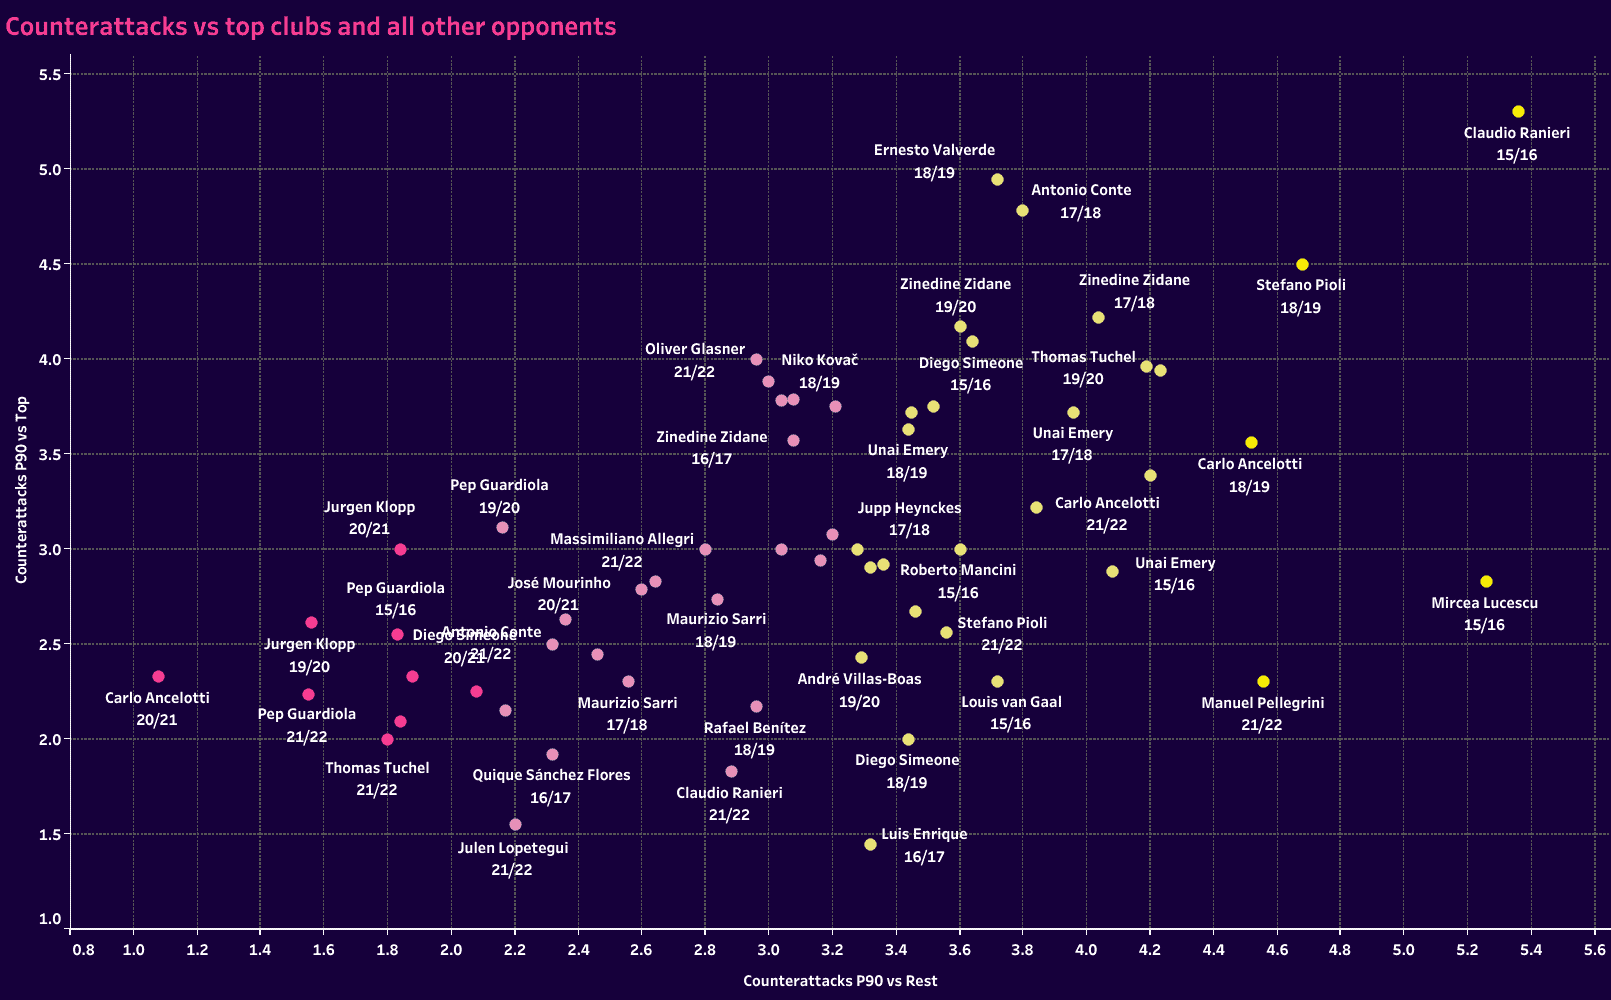
The first scatter plot showed positional attacks, which helped us identify the managers whose team is seemingly dominating each match through possession. The second scatter plot helps us find the other end of the scale, the counterattack dependent. The more frequently a manager pops up on one of the two ends of the scale, the more concrete the approach. Claudio Ranieri is a great example of a manager with a high reliance on deep defending and counterattacking. That is his vision of the game regardless of the club he coaches.
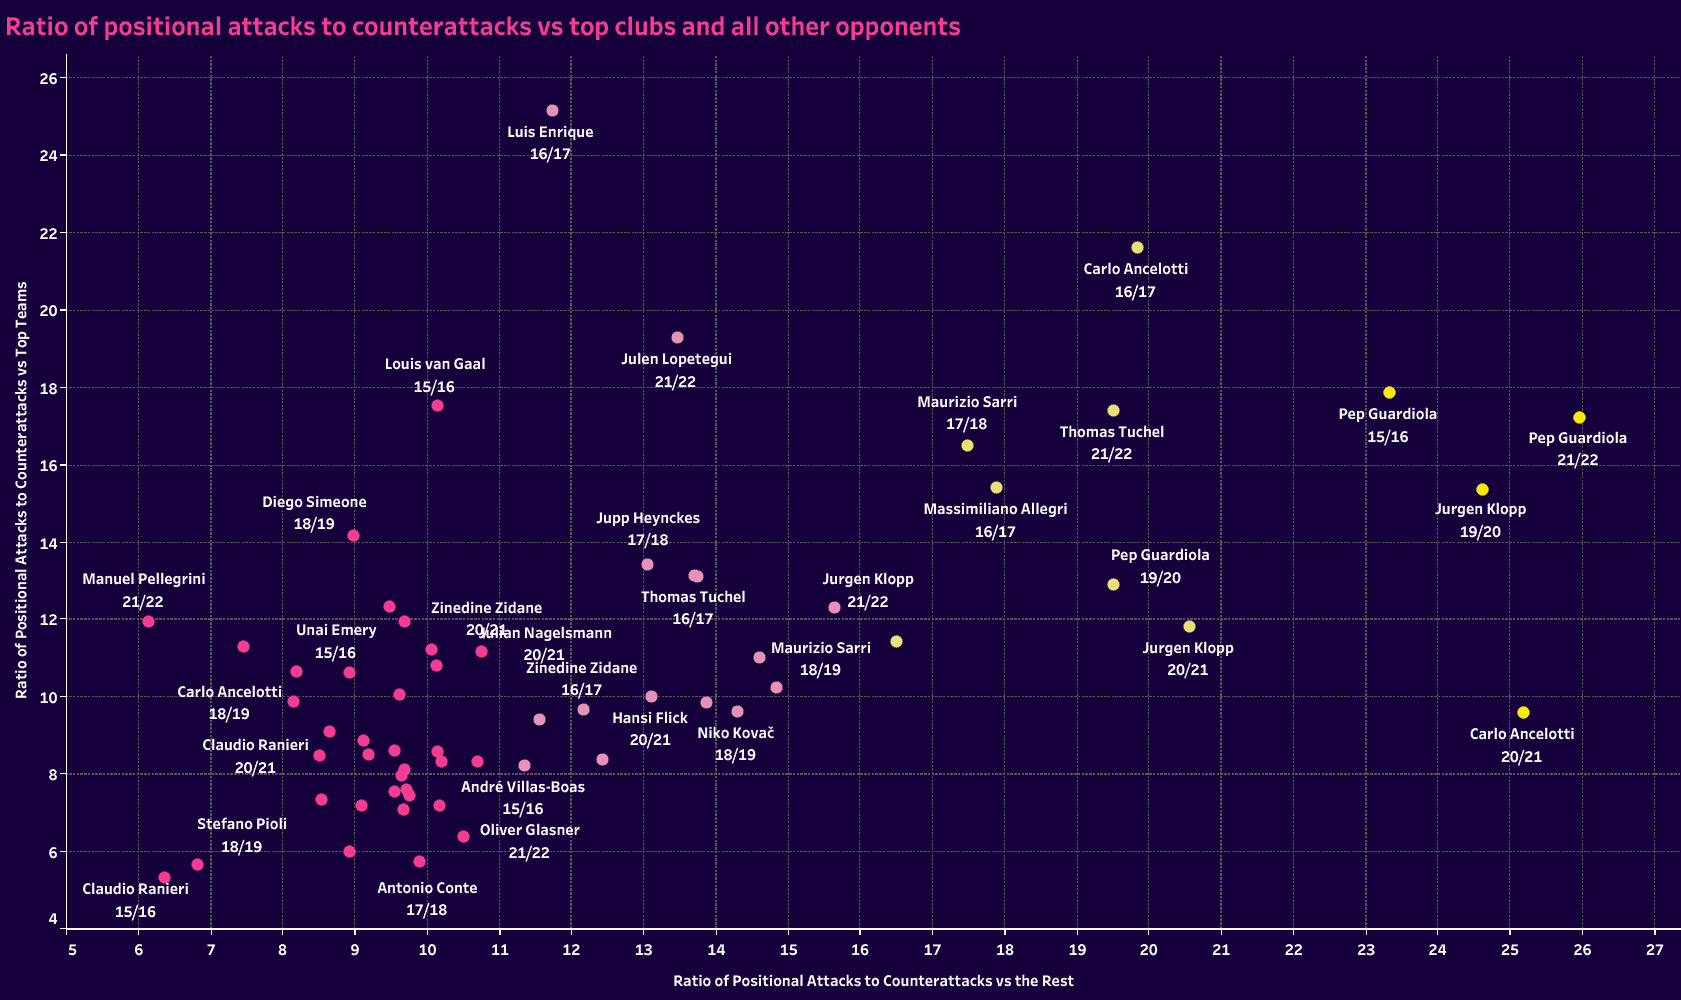
Those first two scatter plots are great, but we can go further. Setting up the ratio of positional attacks to counterattacks gives another clear indication of our groupings. Guardiola and Klopp dominate the right side of the data visualization. Meanwhile, Ranieri and Manuel Pellegrini are fixtures on the left. The tacticians are scattered throughout. In some seasons they’re further to the right, using more proactive play to break down opponents, whereas other seasons necessitated a different approach.
Those attacking patterns are very closely related to PPDA too. The more possession dominant a side, the fewer passes per defensive action recorded. The more reliant on counterattacks, the more likely the managers had higher PPDA totals.
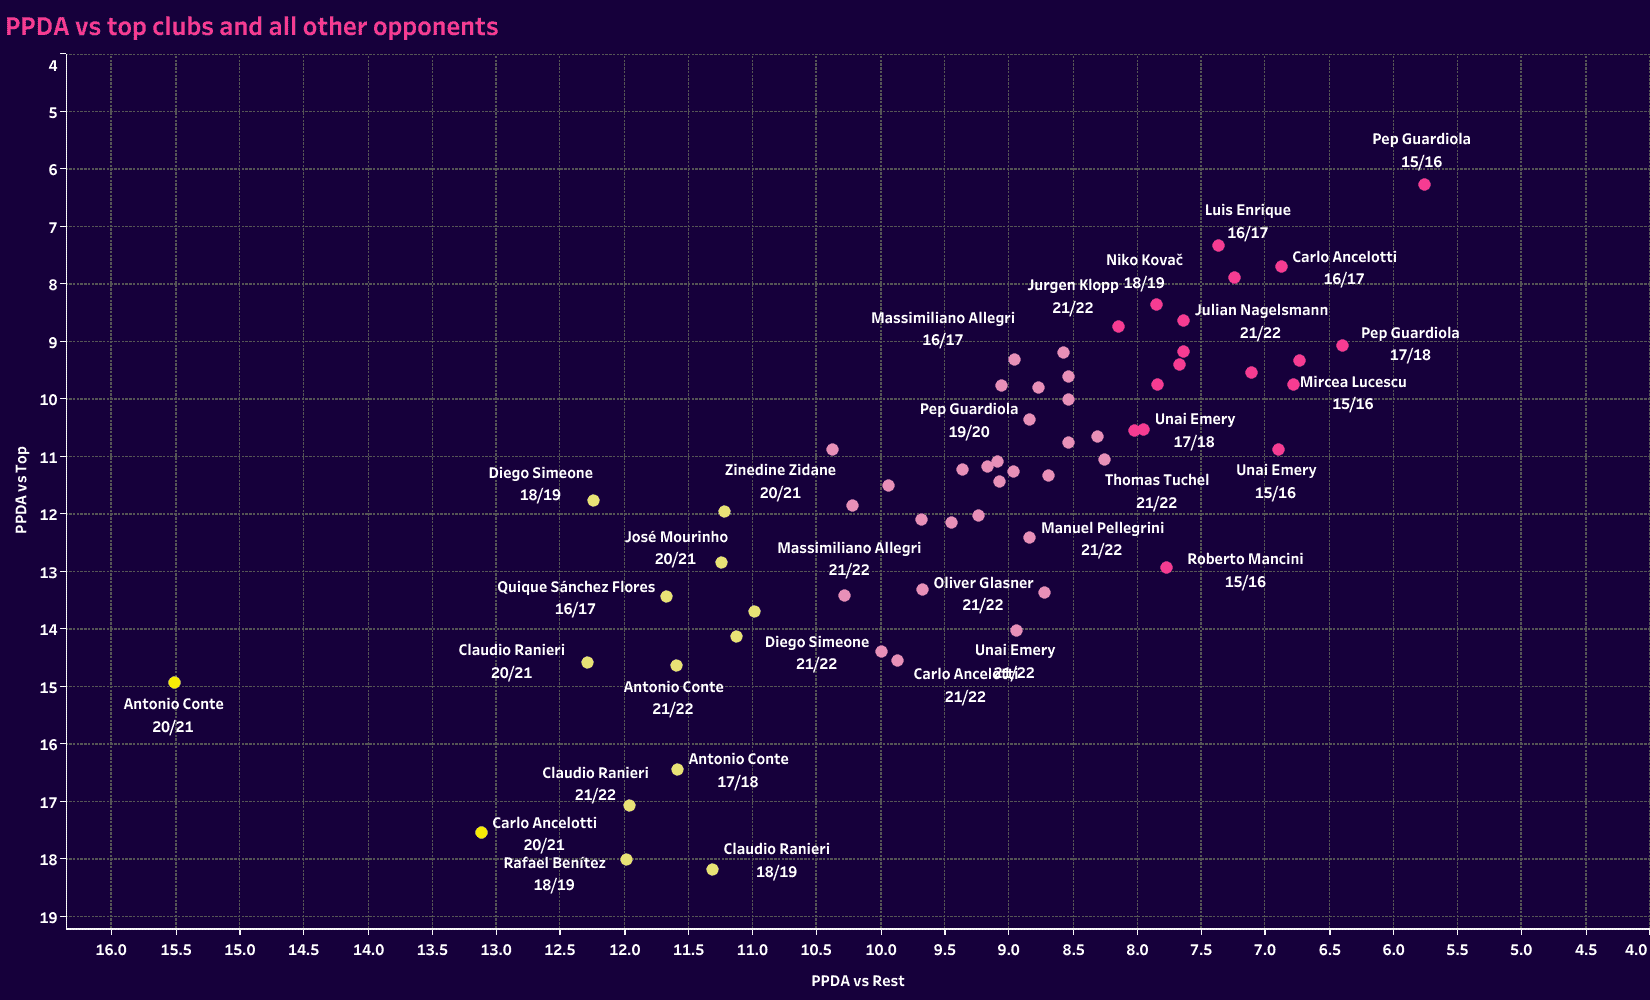
These KPIs have given us some excellent visuals on our respective groups, the ideologues and the tacticians. Consistency is key to forming the two groups. Across each of these statistics, groupings have emerged.
To make the analysis more manageable, we’re going to scale back the number of managers presented in the data visualizations but look more closely for patterns.
The patterns of the game’s best
One of the most common ways teams adapt their tactics is in where they press. Some teams, including most of the game’s best, prefer to engage the opponent through the high press. We won’t go into all the details here, but the general benefits are the possibility of winning the ball closer to goal, creating better counterattacking situations and testing the back line’s technical ability and tactical understanding to play out of pressure.
But those advantages aren’t always present. Watch the way Guardiola’s Manchester City build out of the back. Good luck taking the ball off of them. As the quality of the opponents increases the likelihood of high recoveries plummets. The rationale is simple; top players have better overall quality on the ball and simply make better decisions.
Knowing that the risk is increased and the rewards of the high press aren’t necessarily attainable, it is common to see teams drop deeper as they play top opponents. That’s especially the case when one has a clear qualitative advantage in terms of personnel. That disparity in quality is certainly seen in the high-pressing recoveries chart, but it also gives an idea of the manager’s mentality.
Each of the managers has multiple seasons listed. For some, that includes multiple coaching stops. For example, Nagelsmann has Hoffenheim, RB Leipzig and Bayern Munich listed. As the quality of his teams improved, the more likely his side was to high press.
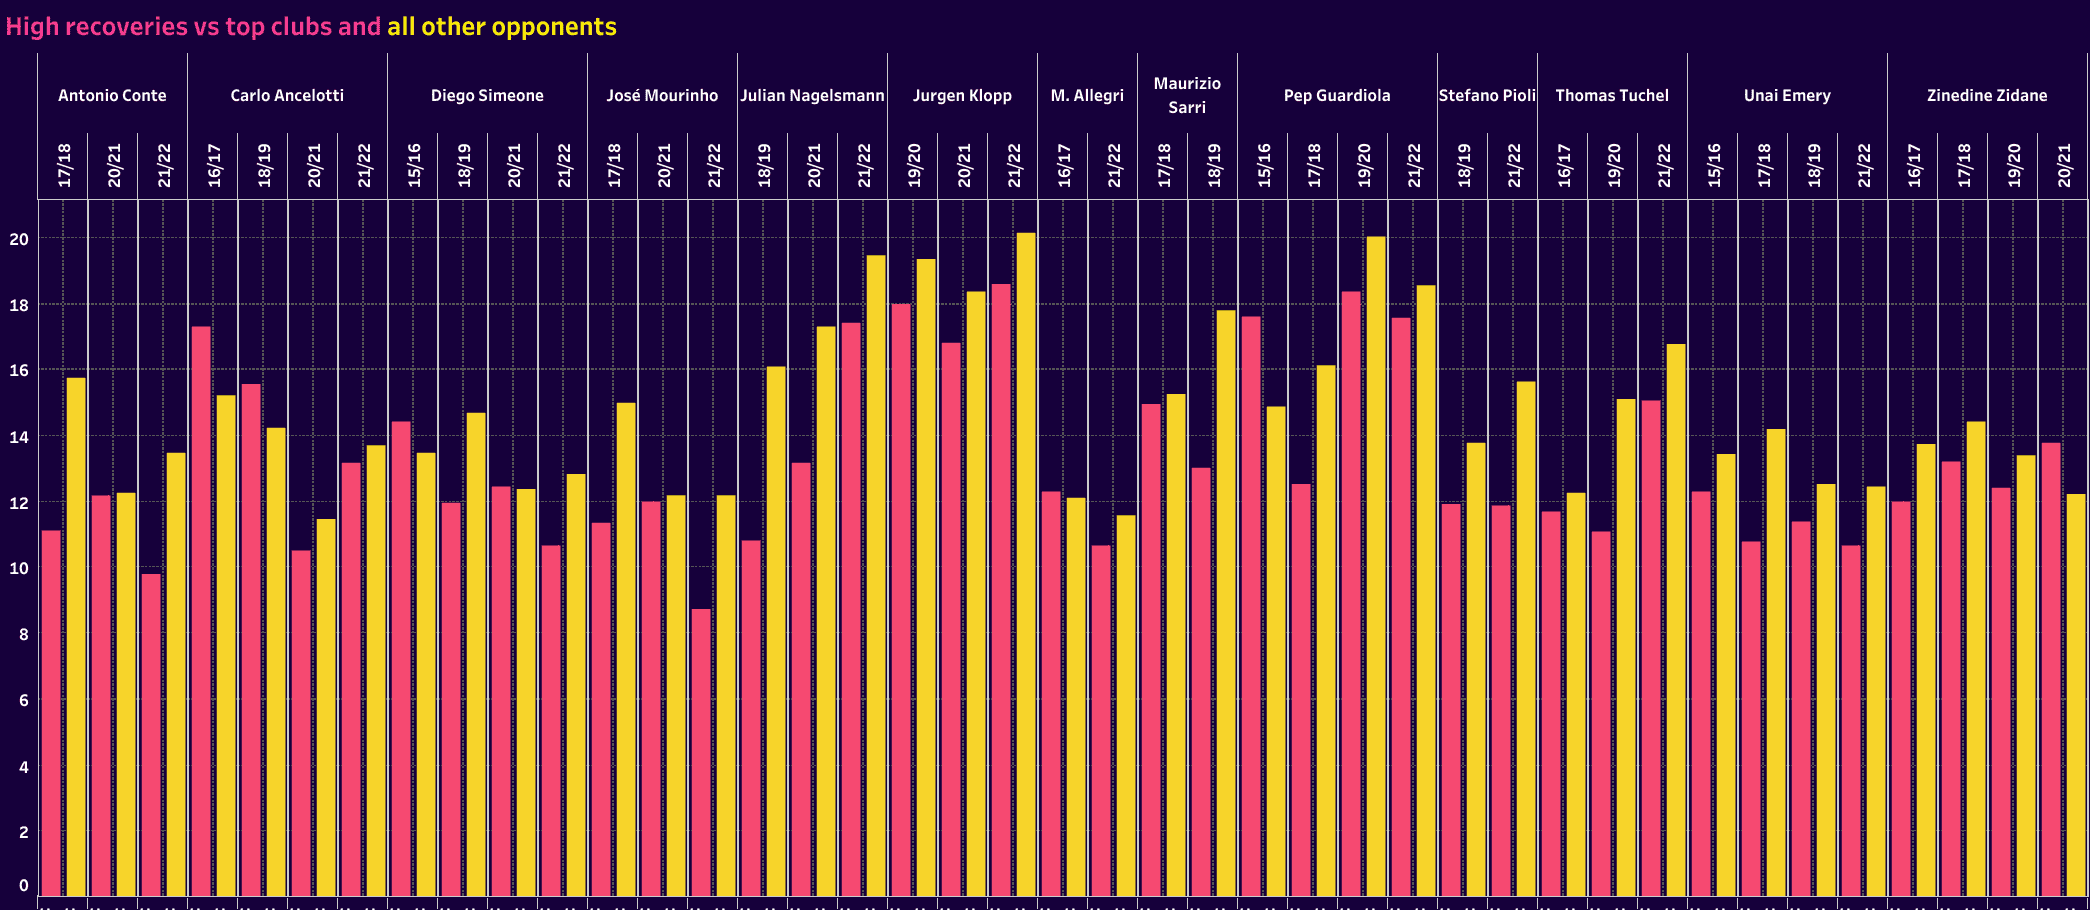
This is also where we find interesting details on club cultures. For example, look at any year featuring a Bayern Munich or Barcelona coaching assignment. Even if the manager has additional coaching roles listed, his stops at those clubs are inevitably going to produce more high recoveries. Ancelotti is a perfect example. His season at Bayern Munich represents his most effective season with high recoveries.
High recoveries offer tremendous insight into a team’s defending tactics. You can plainly see which coaches or clubs make it a top priority. They’re going to get after the ball regardless of the opponent.
The mid-block is a little tougher to decipher. Looking at Klopp’s Liverpool, they’re phenomenal in middle recoveries. If those mid-recoveries are coming in the opposition’s half of the pitch, then in all likelihood it was the work of the high press that generated the mid-recovery. If the recoveries came in the team’s defensive half, then it was likely one generated by the mid-block.
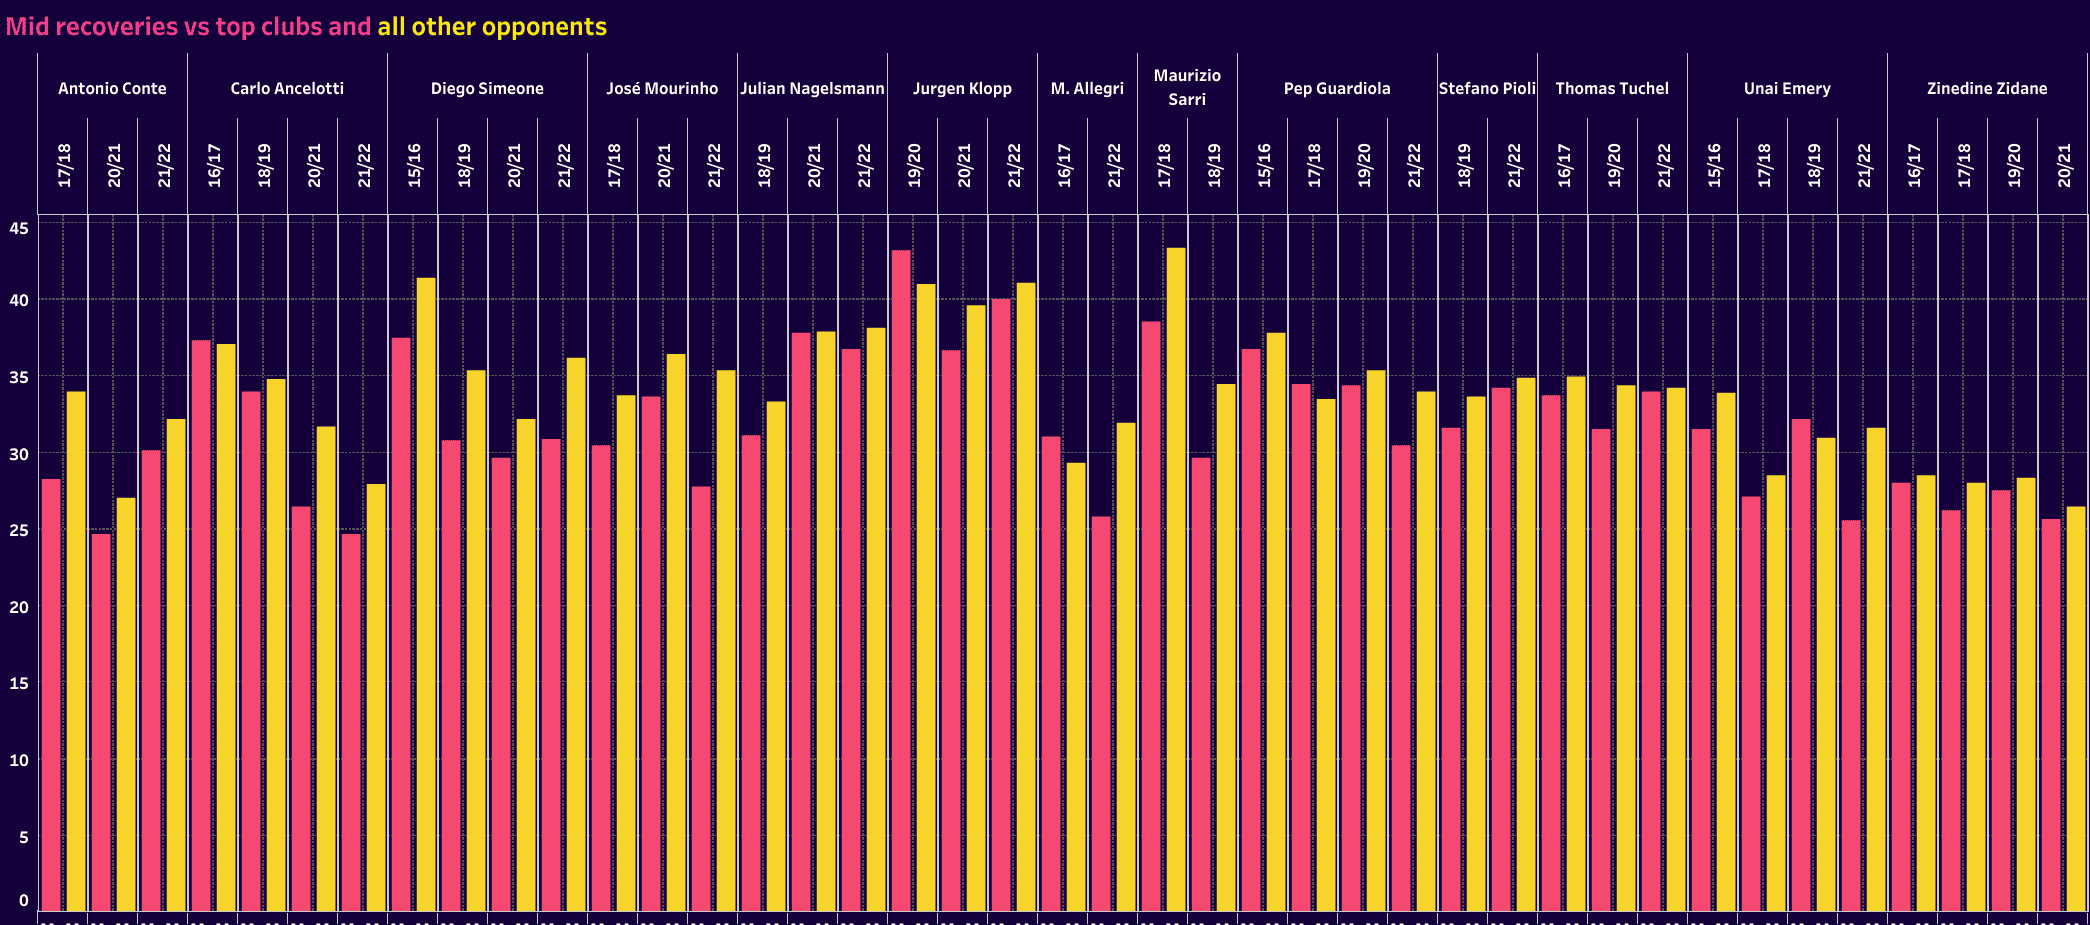
Notice that there’s less variance in the numbers as well. The median isn’t far off any team’s total. Plus, the recoveries against top teams versus all other opponents is typically closer than in high recoveries.
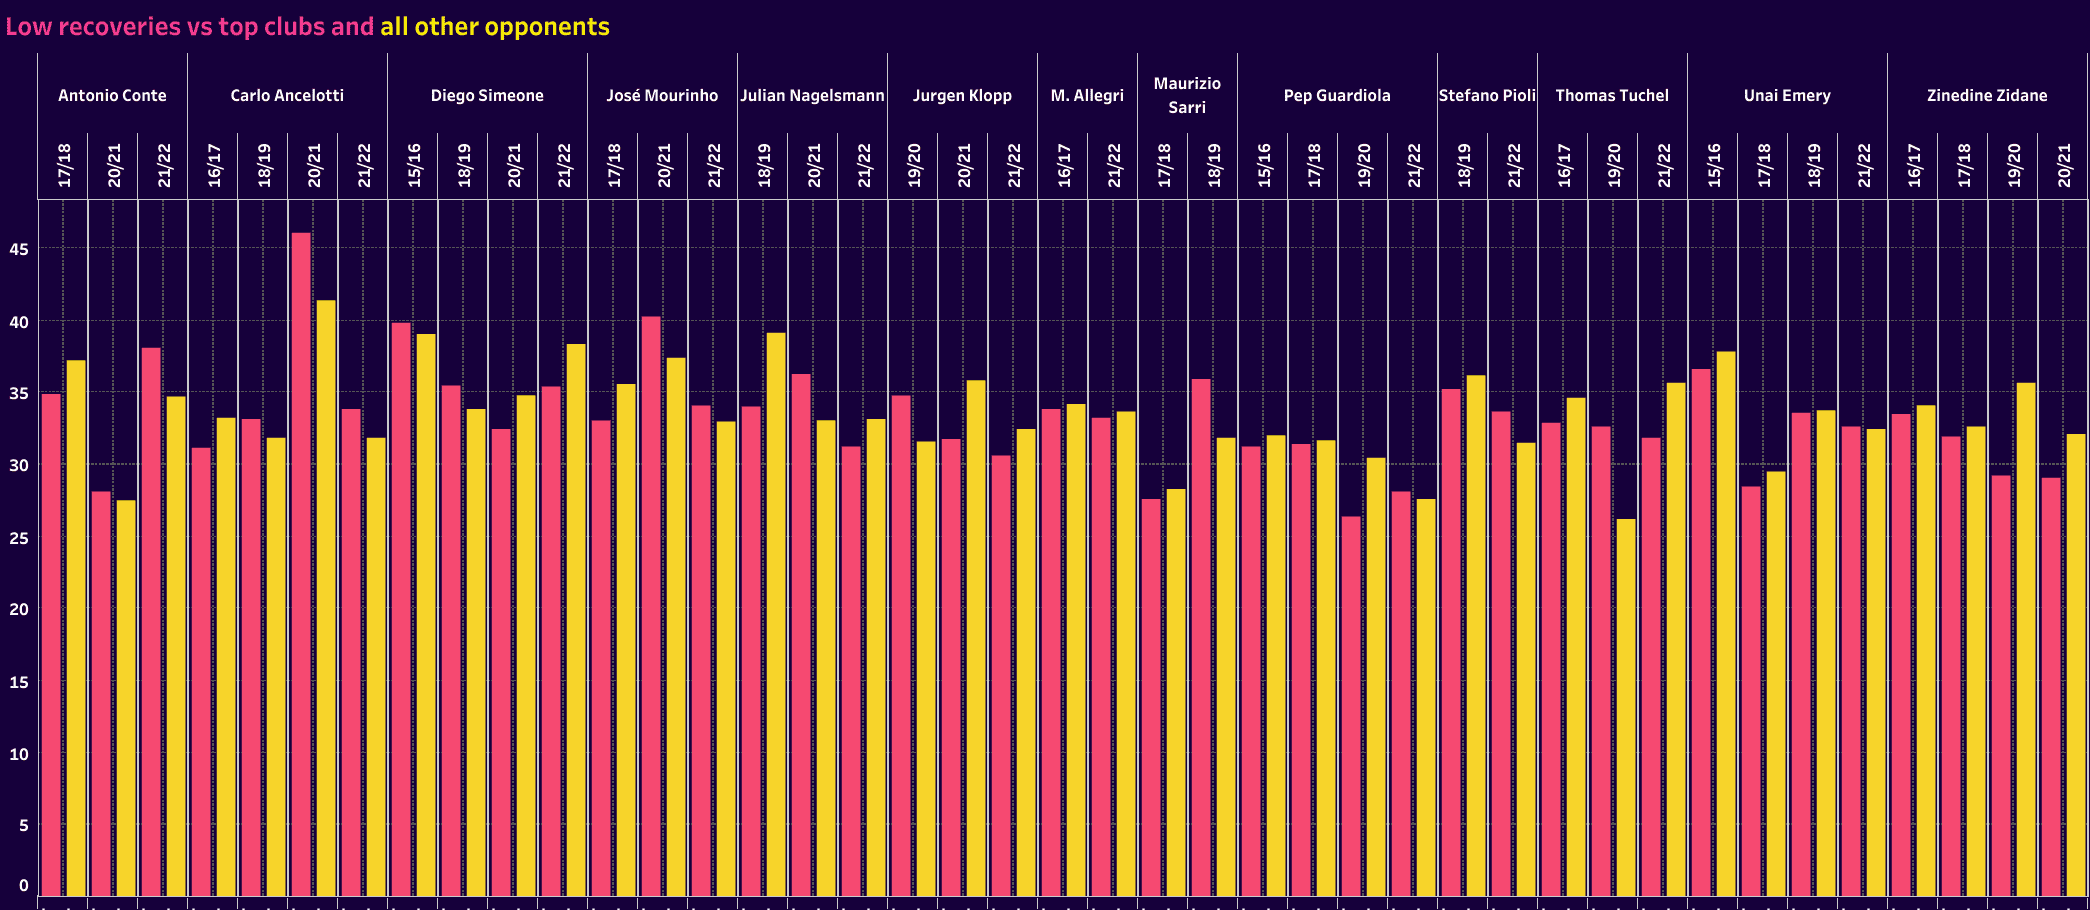
That trend continues into the low block. Ancelotti’s Everton is the clear outlier in this section, but that’s understandable given the disparity in squad quality. It is interesting to note that a few managers have more low recoveries against the second group (all other opponents) than against top clubs. Antonio Conte, Nagelsmann, Massimiliano Allegri, Guardiola, Stefano Pioli, Thomas Tuchel and Zinedine Zidane all accomplished that feat. We can only speculate as to why that’s the case, but there’s a possibility of more play in the middle third against top teams, a greater emphasis on building out of the back when the quality is there and the possibility that more attacks are ending in shots.
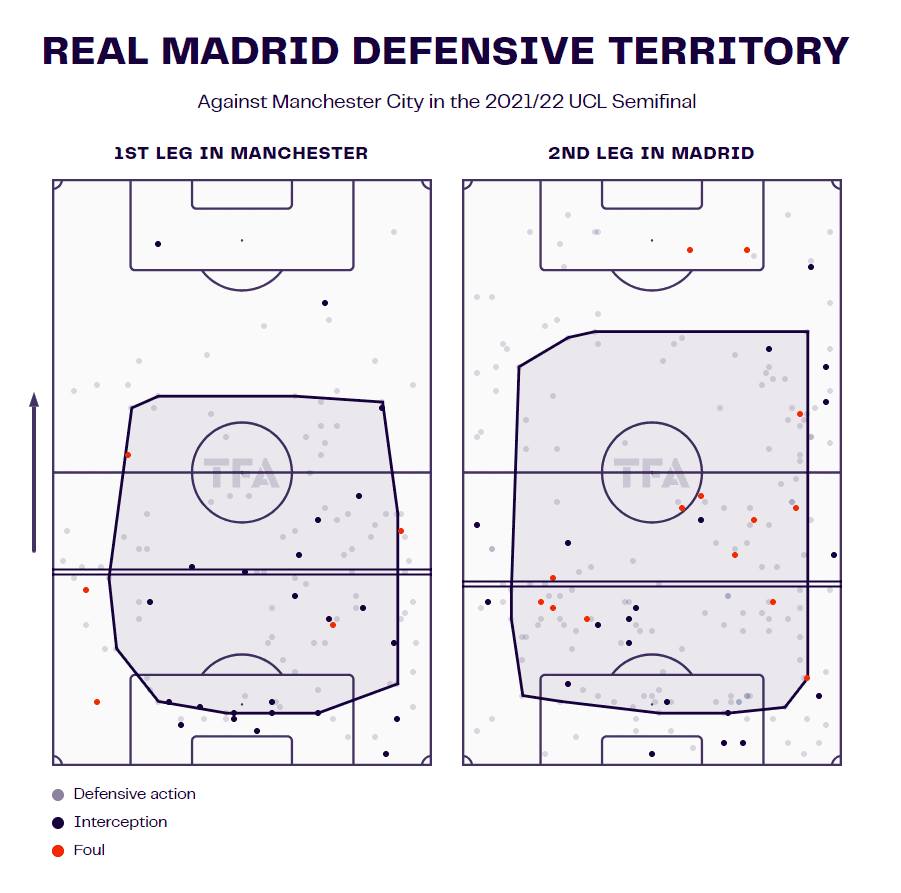
Let’s look deeper at a very specific set of games. It’s time for a quick analysis of Real Madrid versus Manchester City in the 2021/22 Champions League semifinal. Here we can look at the exact pressing areas of the two teams, as well as the pressing line and average recovery heights. Remember that Manchester City led 4-3 after the first leg and struck first in the second leg, pushing their advantage to two goals. Guardiola made the decision to drop deeper to protect the lead, a common sense call.
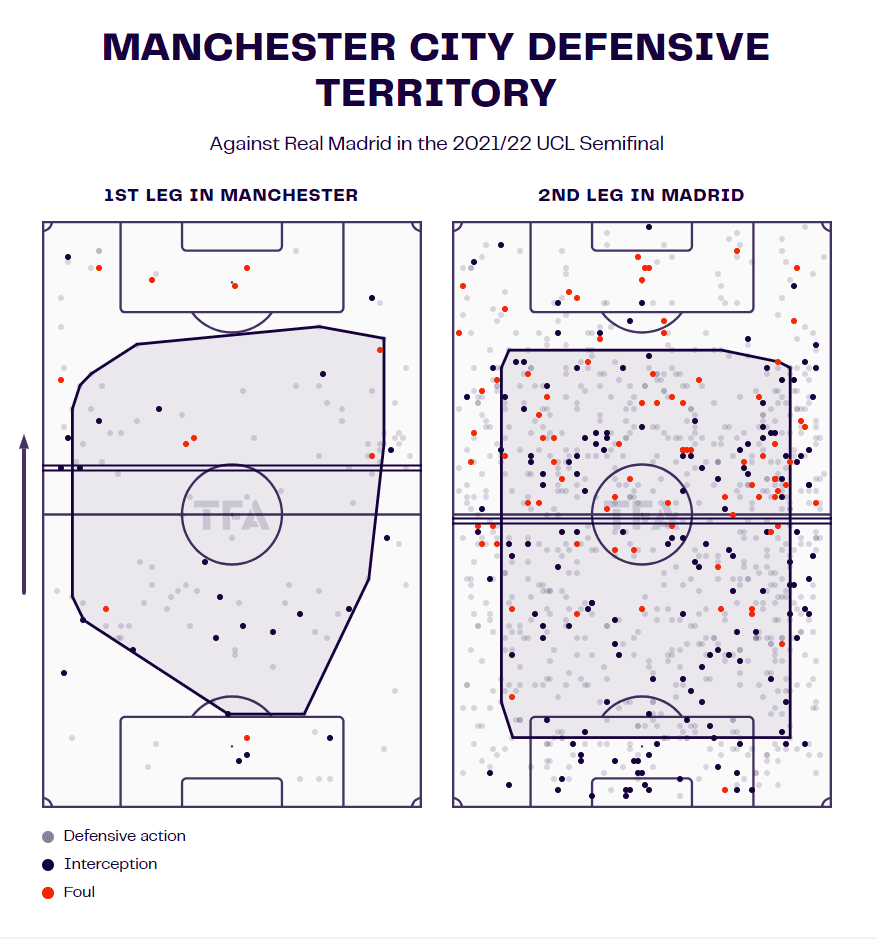
For Real Madrid, they were certainly more compact in the first leg. The game state forced them to defend higher up the pitch in the second leg. But one interesting note is that the average pressing and recovery heights are deeper in the second leg than the first. That comes despite City conceding ground as well.
Let’s take this analysis a step further. What did Real Madrid’s defensive territory look like against Espanyol in the weekend game between the Champions League matches? Oddly enough, it’s very similar to the second leg against City. Even though Ancelotti’s teams were highly adaptable when in possession, their defensive tactics seemed more concrete. The press was designed to concede space and prioritize numbers behind the ball. As opponents became more expansive, a Madrid recovery meant more room to counterattack.
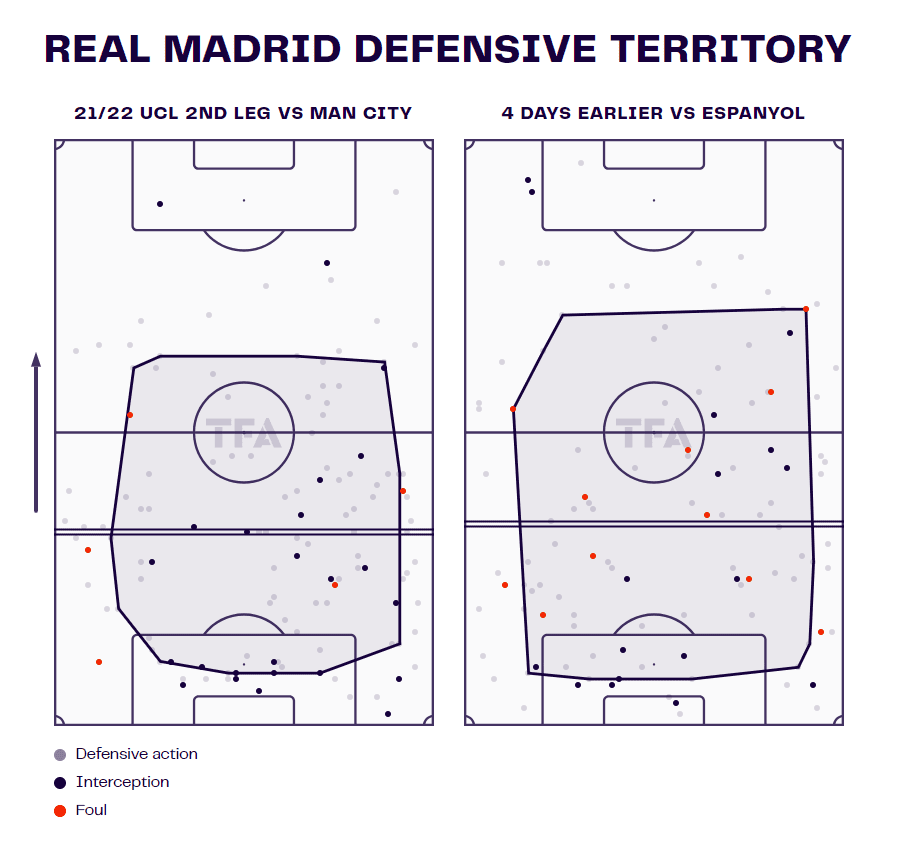
Ancelotti’s more adaptable tactics offer a more conservative defensive approach that offers more room for interpretation in the attacking phases. Tempo and directness of attack are highly conditional on the team’s structure in defence, as well as in the accessibility of high outlets.
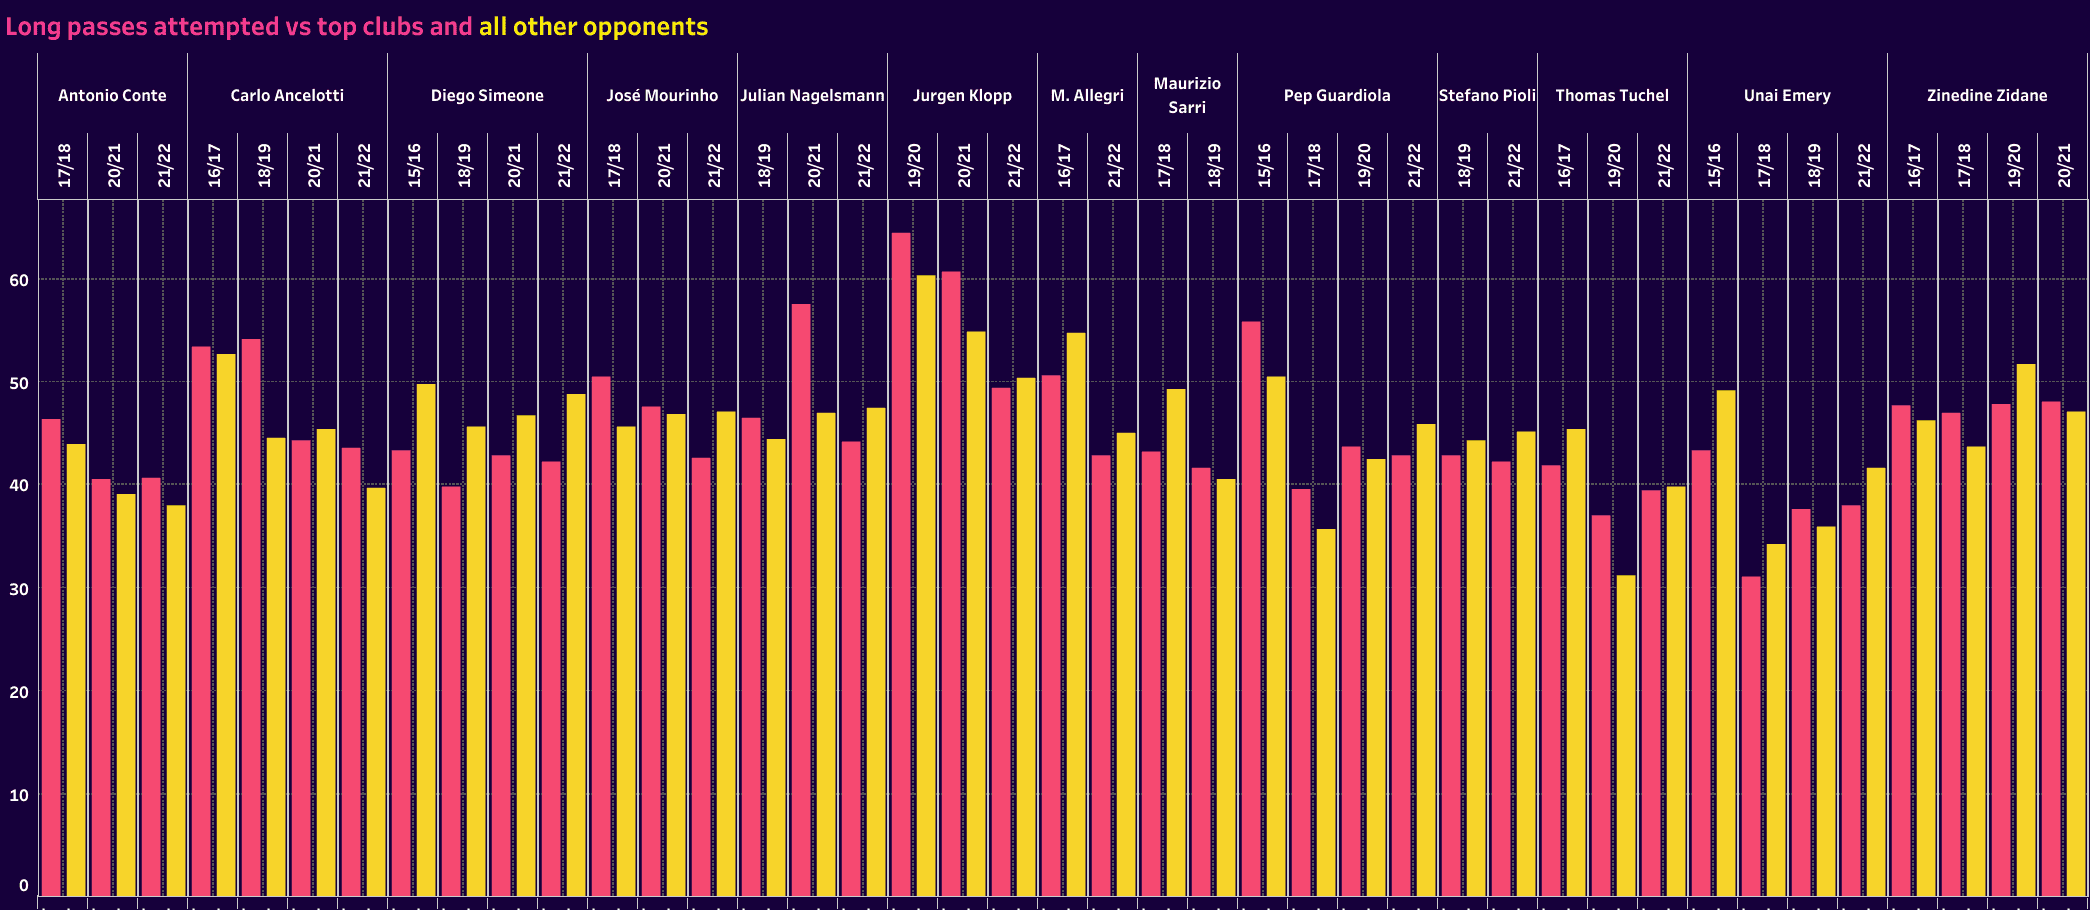
Now, it does make sense that the deeper a team drops the more challenging it can be to hit those outlets higher up the pitch. That’s where we can look at the number of long passes in a game. Long passes are a complex statistic. Wyscout gives three types of long passes. The first is a launch, which is a pass that doesn’t appear to have a specific target, the second is a high pass which is above shoulder height and longer than 25 m and the third is a long ground pass which exceeds 45 m. Technically, switches of play will typically be recorded as long passes. The locations of these long passes can skew the statistic slightly, so perhaps the greatest value we can glean from the visual is a level of consistency for each coach. Surprisingly, Klopp, Guardiola and Nagelsmann have three of the highest long-ball totals.
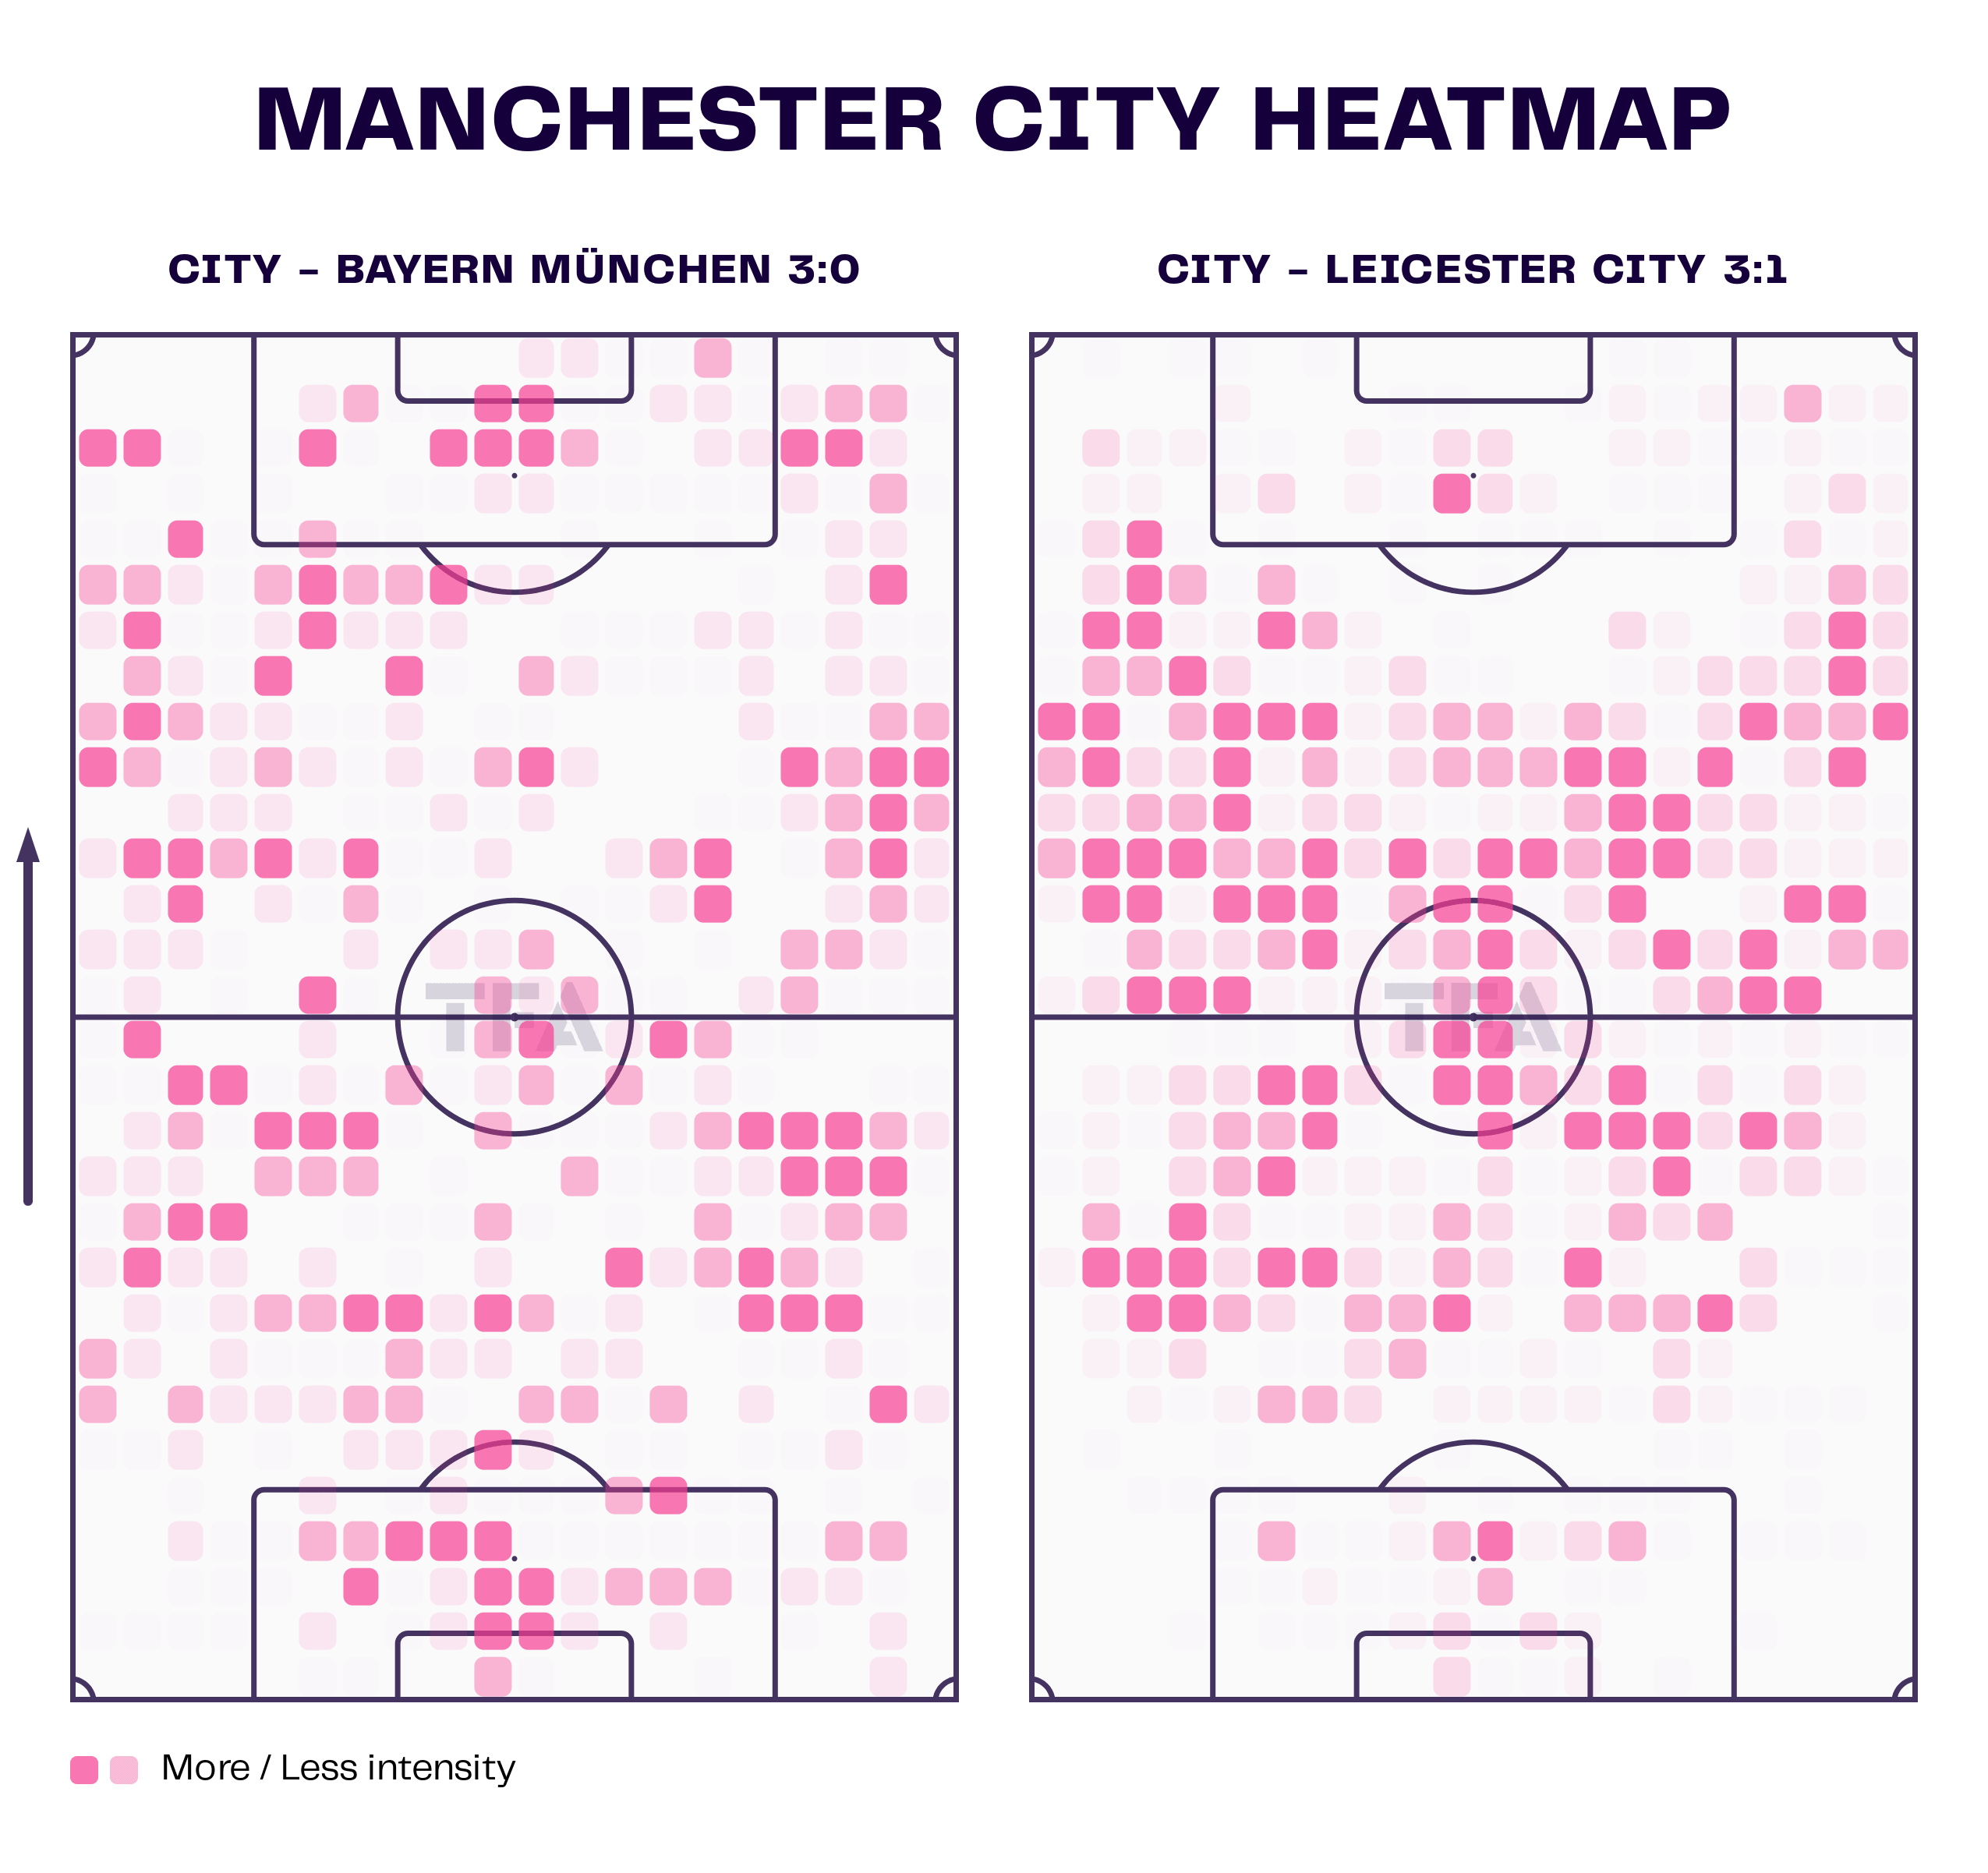
Let’s dig into this metric. There are so many uses for the long pass that we simply can’t put it down to the backline knocking it 50 m into the front line or going Route 1. Looking at Manchester City’s heat map against Bayern Munich and Leicester City, we do see that the Cityzens had a greater central presence against their fellow EPL associates. Against Bayern, the wings shine much brighter.
In all likelihood, this is a result of the opponent’s pressing schemes. Bayern was very well organized in their tie, despite losing 3-0. Their organized defending made it difficult for City to play through the middle of the pitch. In contrast, City picked Leicester apart centrally. You can almost pick out the approximate positions of each player.
This is very similar to Real Madrid’s attacking heat maps against Liverpool and Espanyol. Against a top team, Real Madrid was forced to play around the press. Given the heavy workload of Vinícius Júnior and the result, it’s fair to say they didn’t mind using the wings. Espanyol was a different matchup. Like the City versus Leicester game, there is more space high up the pitch in and near the central channel. Whereas City was very central, Real Madrid tended to play high into the half-spaces.
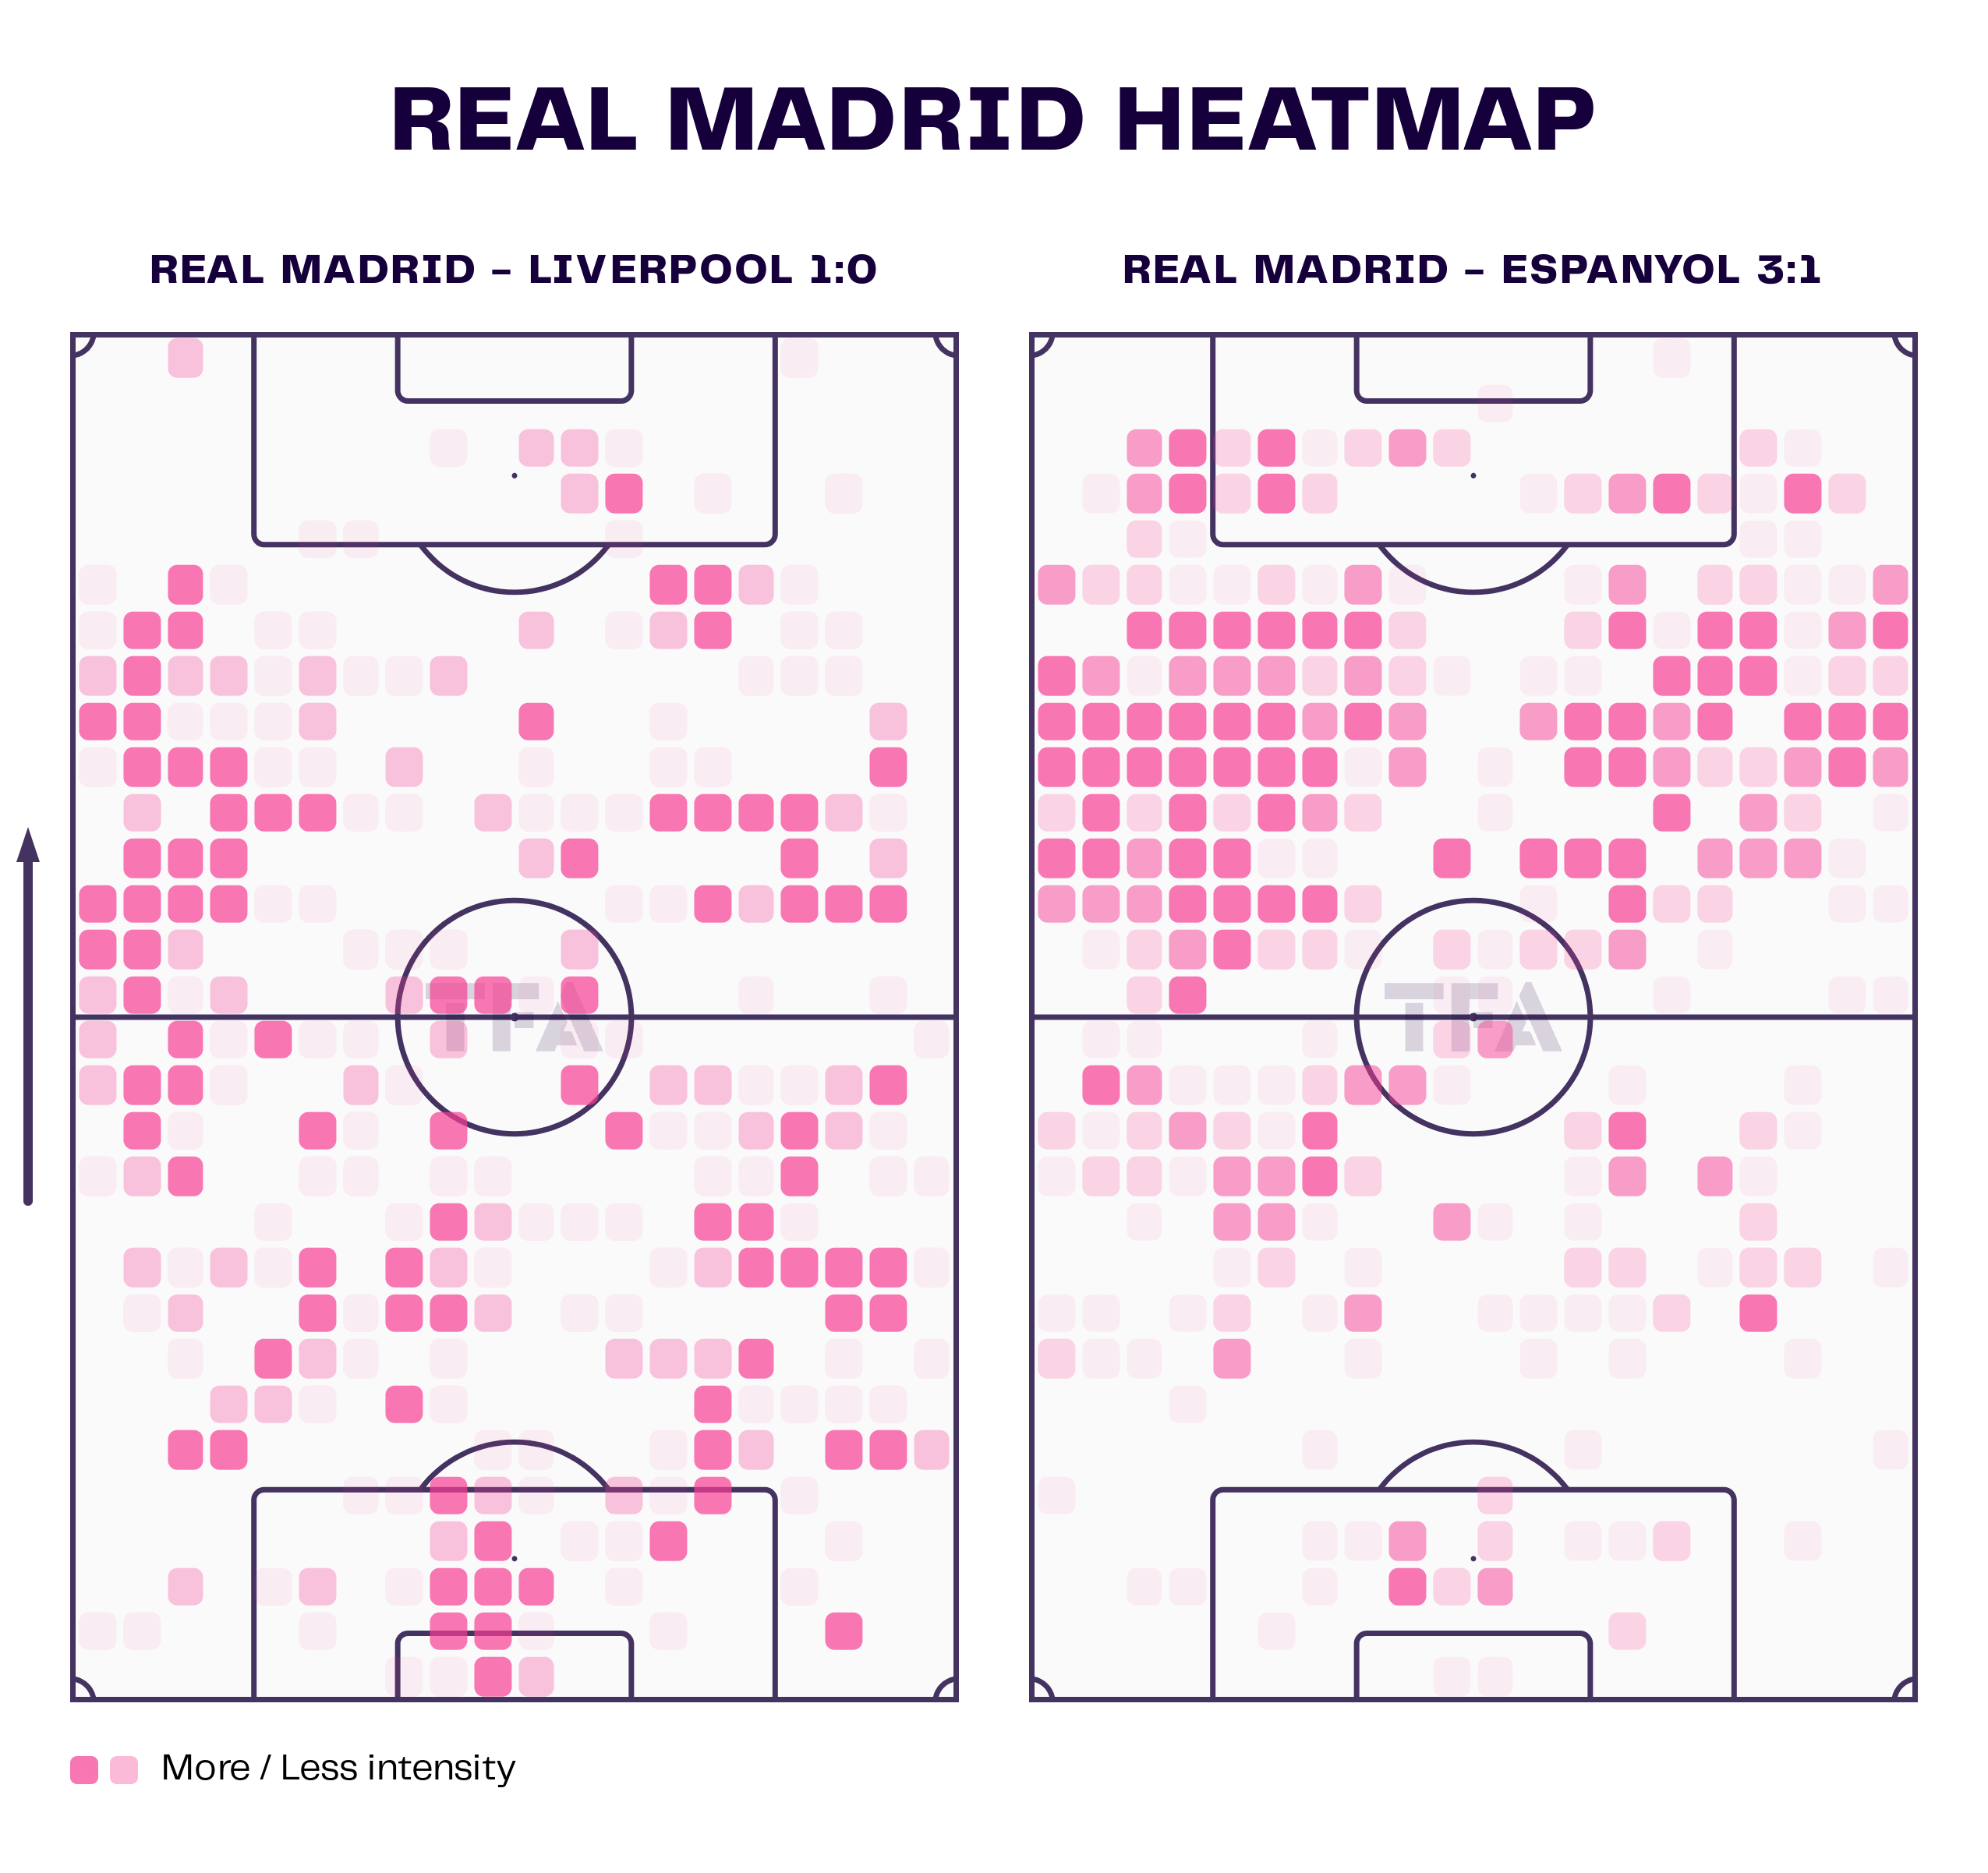
Each set of heat maps shows to likeliest path into the final third. Now let’s see what they did once they got there.
Crossing statistics give us an excellent glimpse of how teams look to attack the box. As you scan this data visualization note that the more possession-dominant managers tended to have a greater reliance on crosses while the coaches who have a reputation for playing more direct or showed a greater reliance on counterattacks tended to send fewer crosses per game. One obvious answer is that possession-dominant teams have more of the ball, so they have more opportunities to attack the box. A second is that each team is attacking the box with different restrictions.
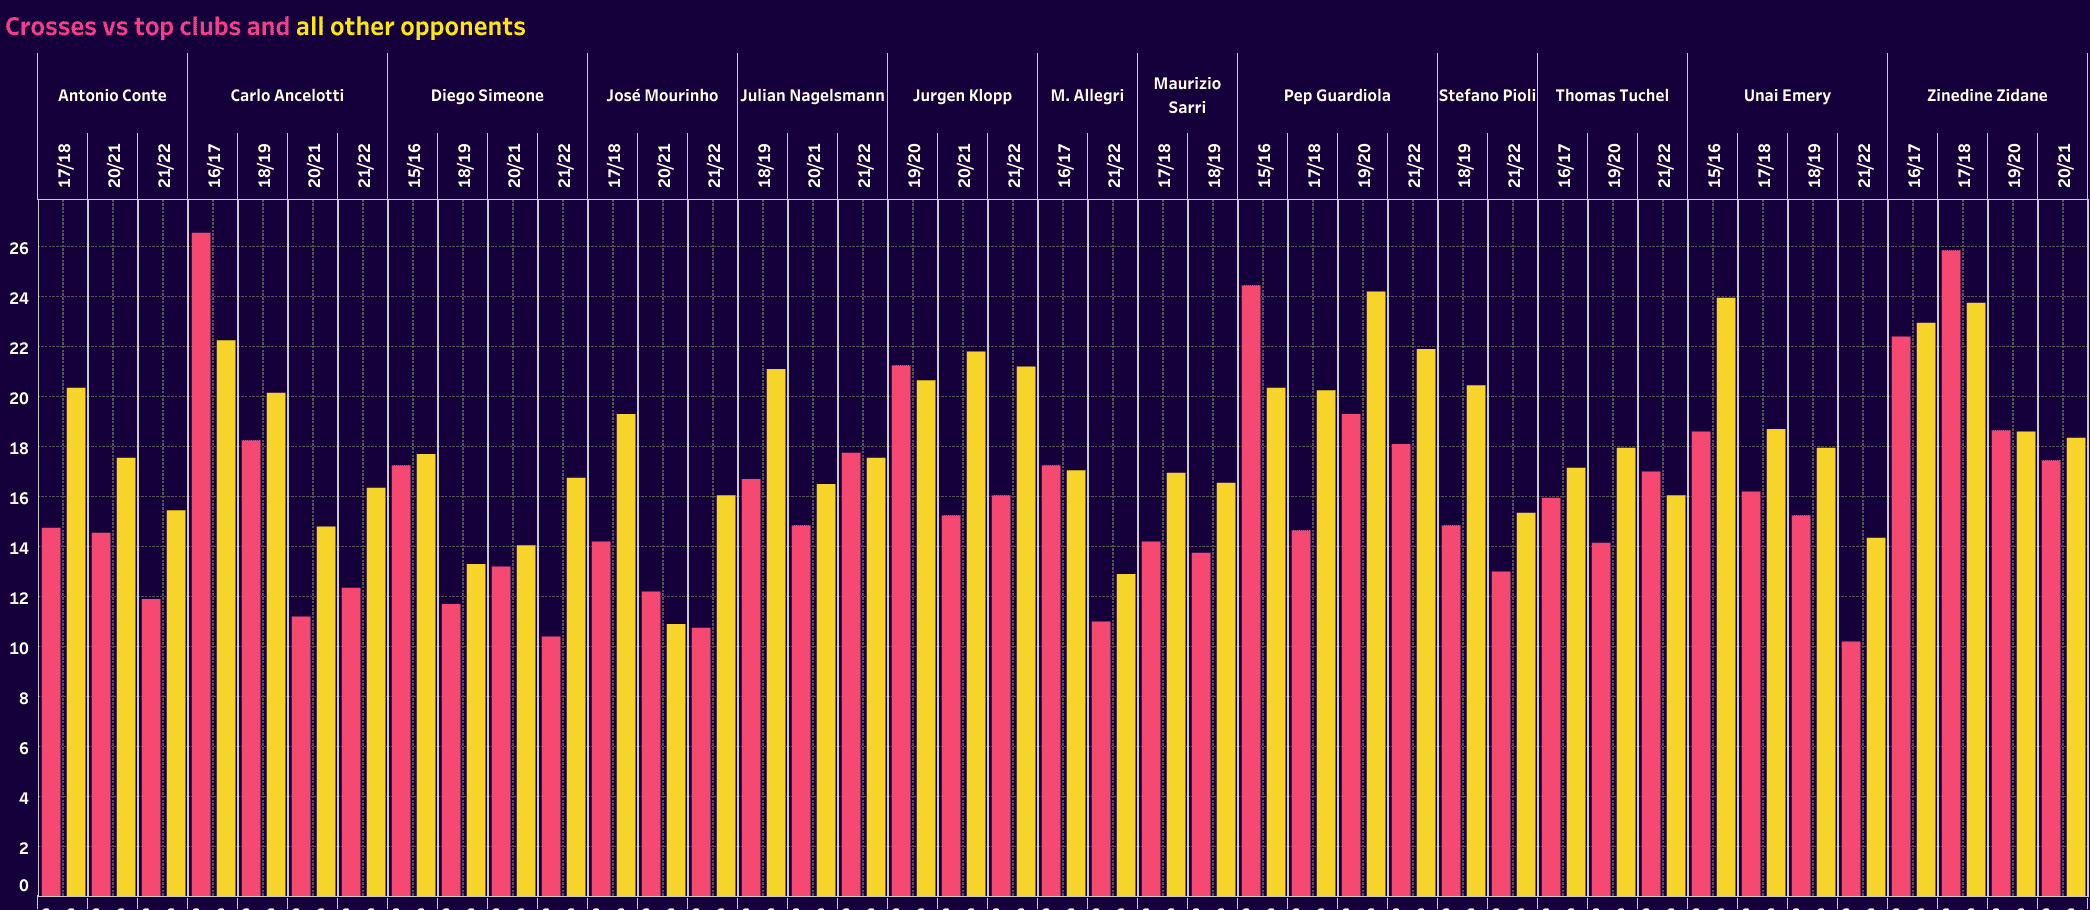
Diego Simeone’s Atlético Madrid teams do not cross the ball very often. Instead, they use very direct moves to goal to enter the box on the ground. Don’t take ‘direct’ to mean Route 1. In this case, it’s well-structured counterattacks with the ball largely played on the ground that leads to very precise box entries from the Madrid-based side.
Meanwhile, the possession-dominant managers are facing a different set of problems. Having more of the ball in the opposition’s half typically means that the opponent is well-positioned to block central access to the box. Sending those crosses becomes the more reasonable solution to the conundrum.
Another thing to note is the quality of the players at the manager’s disposal. Trent Alexander-Arnold and Andy Robertson offered incredible services. You want them playing those final passes into the box. With those early Zidane Real Madrid teams, it was Cristiano Ronaldo that was typically on the receiving end of crosses. With his quality in the air, taking a chance on a cross is a great way to generate a goal-scoring opportunity. Let a player of that calibre go up and attack the ball.
Now relate that crossing information to our final image from the section on penalty area entries. Sending crosses certainly didn’t hurt Real Madrid, Liverpool and Manchester City. In fact, sending crosses was likely a tool for greater overall balance in final third attacking. Attacking the box in a variety of ways can keep opponents off balance, helping to manipulate them higher in the press.
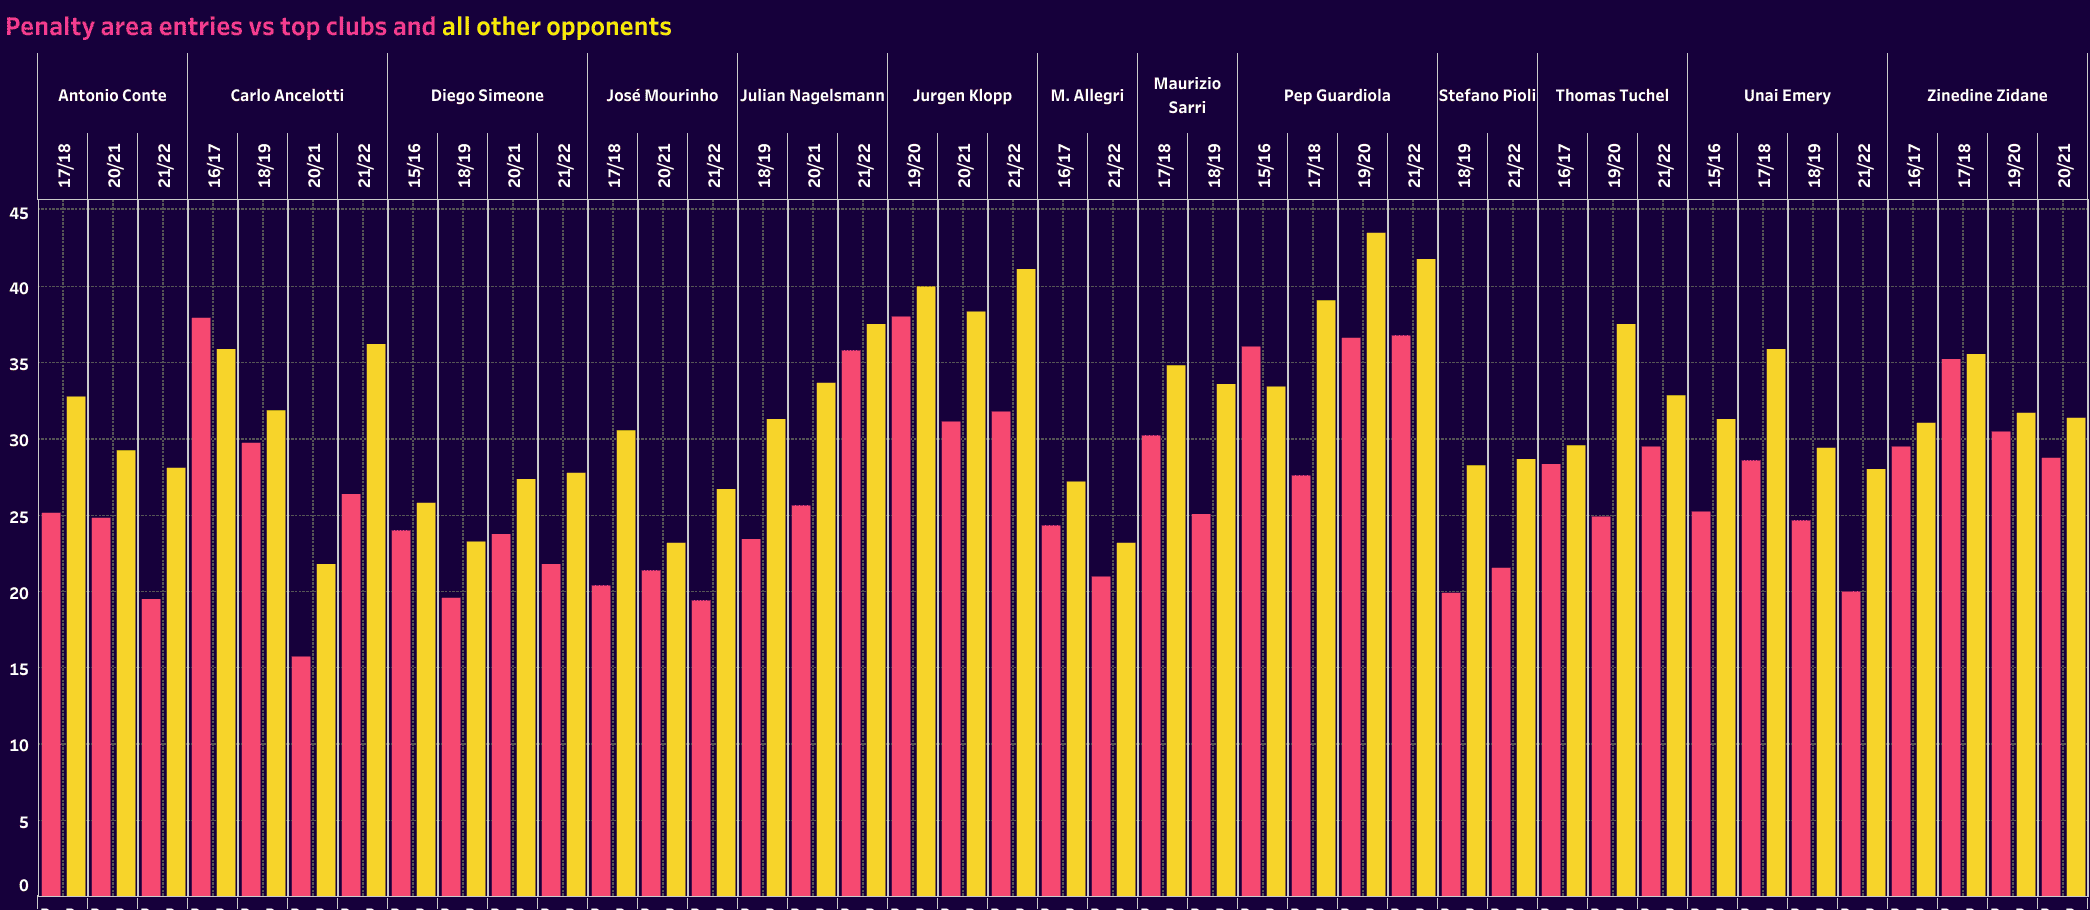
When looking at the data in this section, it’s really the consistency of the metrics, both in a single year relative to matches against the top teams and the rest, as well as a manager’s approach through the years, that stand out. The more tactically rigid managers have very similar data points from year to year. Meanwhile, the highly adaptable managers are more likely to adapt their tactics to the quality of the players at their disposal, especially relative to the opponents from week to week.
As we saw in the attacking heat maps, even the most rigid managers can show some level of adaptability. Guardiola’s side did well to adapt to the different challenges presented by Liverpool and Leicester City. Some level of adaptation is always needed, even for the best in the business.
Which group wins the most trophies and which ones?
So where does that leave us?
Looking at the past 15 years, which managers are more likely to claim trophies and is there a disparity between continental play and domestic?
Using the data from the previous two sections, we split the managers into two groups, the Ideologues and the Tacticians. With those two parties in place, all that was left was to add up the trophy count. Here’s what we discovered.
In continental play, the Tacticians claimed a 21 to 16 victory, a 57% share. That accounts for Champions League, Europa, and Conference titles.
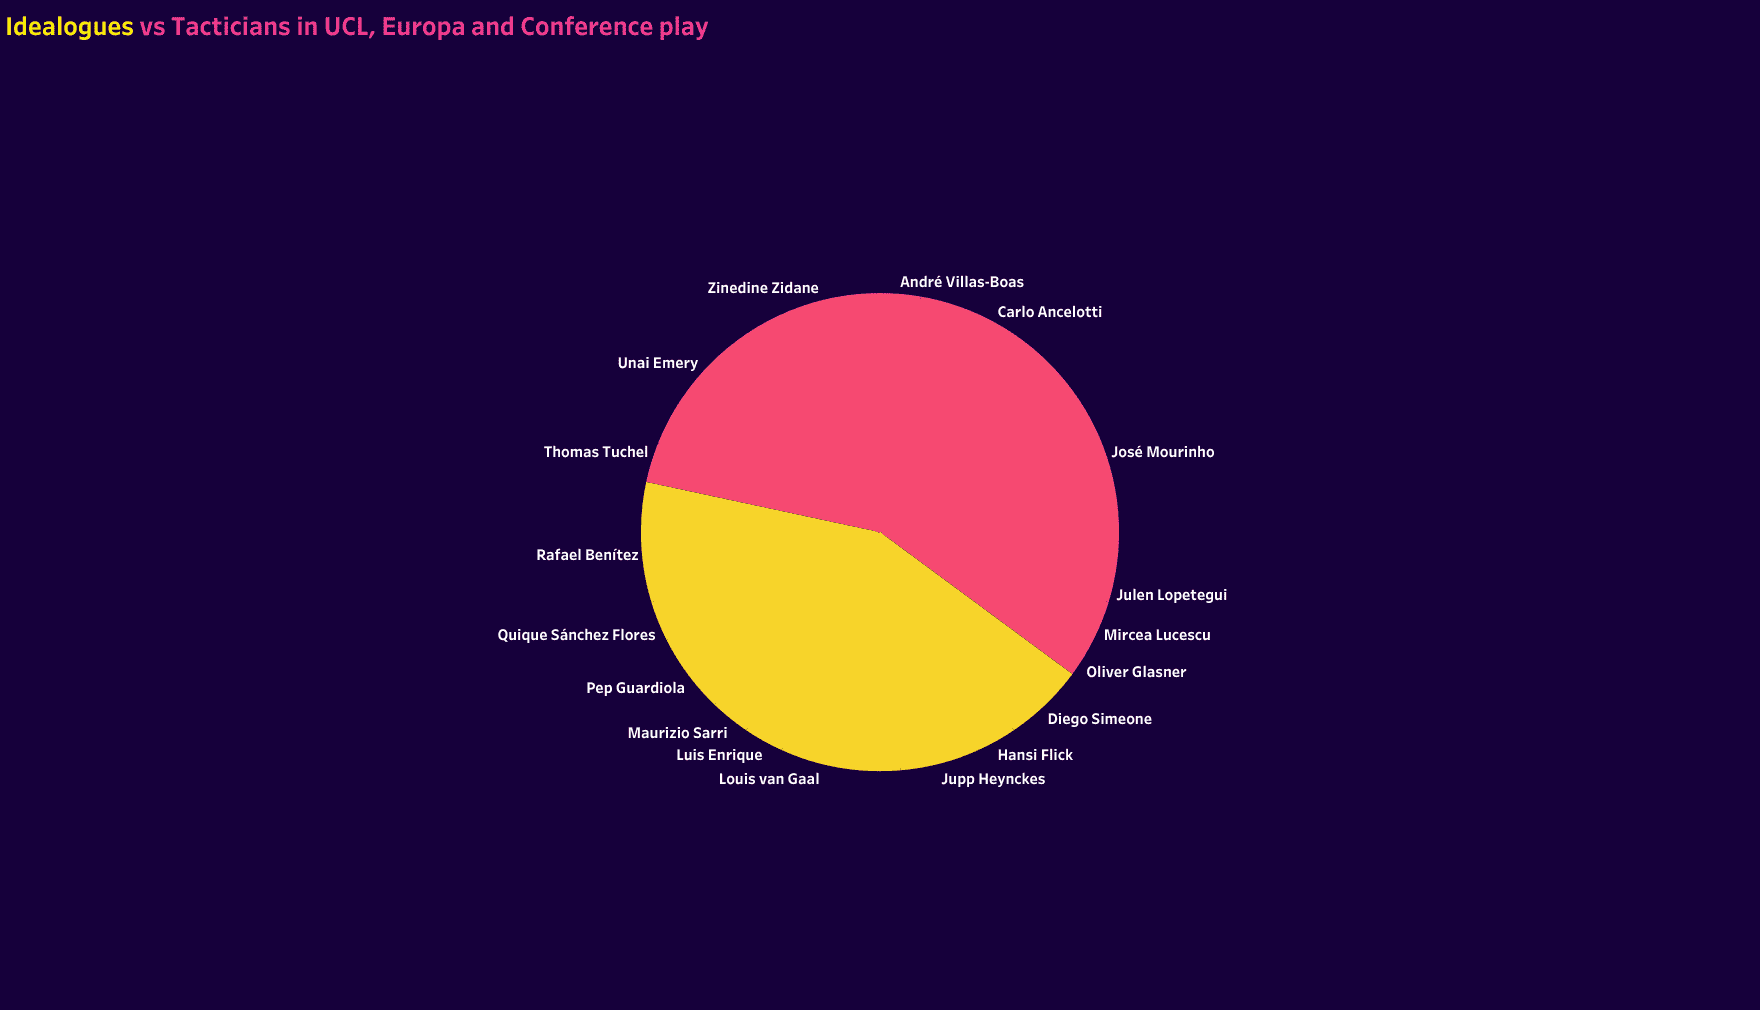
Before starting this project, it was an assumption that the Tacticians would win, but perhaps by a greater margin.
It’s the domestic honours that was more of a surprise. Given the success of Guardiola and Klopp in England, as well as the dominance of Bayern in Germany and Barcelona’s performances in Spain, pre-analysis assumptions were that the Ideologues would claim the domestic crown. However, the data tells another story.
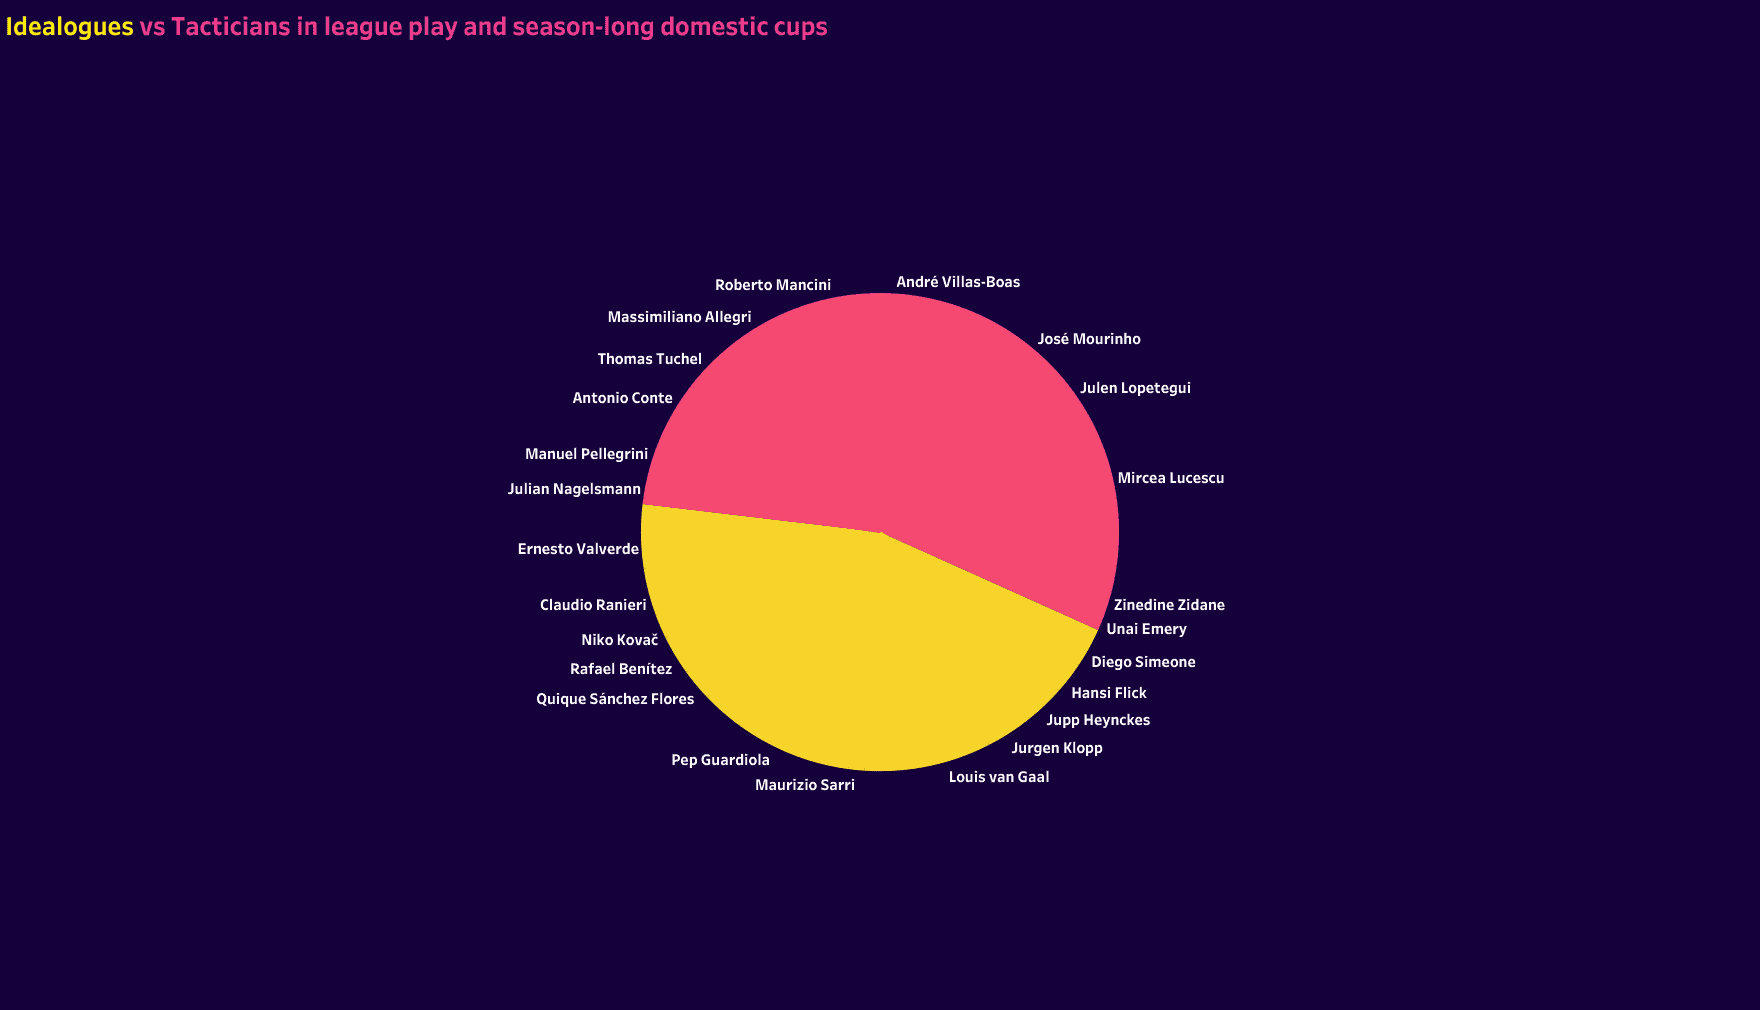
The Tacticians claimed a 102 to 84 victory, a 55% share for the winning pool of coaches.
Why was it assumed that the Ideologues would claim the domestic crown?
Perhaps part of it is recency bias. The managers and clubs just mentioned have dominated the domestic scene. The blessing and the curse of the Ideologues is that their game model is executed in a very specific manner. It can be more difficult to bring players up to speed, but once they are, the teams seem to become unstoppable forces. As the execution of the game model develops week in and week out, improved performances would seem the norm, especially against domestic competition since they’re operating with a set football culture.
While the Tacticians are certainly developing their squads over the course of the season, the prevalence of matchup-specific tactics seems to take priority over the game model. Perhaps that’s the wrong way to put it. The game model simply requires less of the players, allowing for greater adaptability to each opponent. One of the reasons we anticipated greater continental success for the Tacticians is the ability to pivot from game to game. That adaptability should lead to greater fluency in exploiting an opponent’s weaknesses and countering their strengths. That relationship to the opponent, which is nearly as important to the game model, is the means to success in one-off games and two-match ties.
Conclusion
Johan Cruyff famously said, “Germany may have won the cup, but it was the Dutch who created the spectacle.” Coaches like Arson Wenger and Guardiola have built a legacy on the spectacle of their teams and their domestic success. There’s a great sense of joy in watching a vision of the game so beautifully executed. No one can ever take that away from them.
But likewise, no one can take away the four Champions League trophies one by Ancelotti at four different clubs (all in different countries) or the three consecutive UCL victories of Zidane. It’s that balance of beauty and ruthlessness that secured these two their titles. That’s part of why Sir Alex Ferguson is so admired and holds his place in football lore. There’s a balanced blend of a vision of the game and its weekly execution.
The same can be said for Mourinho. The critics will always slam him for parking the bus, but this is a naive take. He’s a manager with extraordinary tactical range, which is easily seen in the statistics. Plus, there is still something beautiful about perfectly executed defensive tactics and the devastating precision of well-orchestrated counterattacks. Football is not a one size fits all sport. There is beauty everywhere.
Ultimately, the Tacticians are slightly better positioned to earn continental success, but the gap is manageable for the Ideologues. If there’s one bit of encouragement for them, it comes from Cruyff, perhaps the greatest Ideologue of them all: “It’s better to go down with your own vision than with someone else’s.”



Comments