When Real Madrid sealed a reported £88 million deal for midfielder Jude Bellingham, the Galácticos were the envy of many.
Regarded as one of the best young talents in football, the acquisition of the England midfielder was a coup.
In addition to the overall quality that Bellingham possesses, his goal tally this season has been conceived as an added bonus.
Although the youngster always had a goal in his locker, he wasn’t as prolific in the Bundesliga as he has proven to be in La Liga this campaign.
At the time of writing, Bellingham tops the goalscoring charts in Spain’s top division with 16 goals to his name.
Moreover, the Englishman has dispatched 29% of his efforts on goal, placing him second in the division for efficiency in front of goal.
But how is Bellingham scoring all these goals? Is there a greater probability that he scores from set pieces or in open play? Do location and angle play a part in determining the likelihood of his goal?
This Bellingham xG data analysis will use statistical models to answer these questions.
Furthermore, we will provide an expected goals analysis of the results to determine how Bellingham fits into Real Madrid’s tactics and, with this knowledge, how teams could go about preventing Bellingham’s attacking threat.
Jude Bellingham Style Of Play & Data Analysis
To assess Bellingham’s goalscoring probability we have used the midfielder’s non-penalty shot data from La Liga this season.
We have sifted through the data and identified particular variables of interest for our analysis:
- Shot outcome: determines whether the shot resulted in a goal
- Situation: determines whether the shot was within open play or a result of a set piece
- Shot type: describes how the goal was scored, such as left foot, right foot, or header
- XG: the expected goal value of each shot
- Distance: how far was Bellingham from the goal when the shot was taken
- X and Y coordinates: used to pinpoint the location where Bellingham took each shot
- Angle: calculated from the coordinates to determine the angle of the shot to the goal.
We have filtered through the data in an exploratory manner as well as derived various logistic regression models.
From here, we could then determine the odds ratio and the probability that Bellingham scores given a certain scenario.
To showcase why we have chosen logistic regression, consider the graph below, which plots the distance of each of Bellingham’s La Liga shots with the corresponding shot outcome.

The shot outcome—the response variable—is binary, so either takes the value one if the shot resulted in a goal or zero otherwise.
Logistic regression facilitates investigating the relationship between variables and such a response variable and is an ideal choice for this analysis.
Jude Bellingham Shots Map – The art of positioning
Before we constructed any models, we delved into the data by plotting each of Bellingham’s La Liga non-penalty shots.
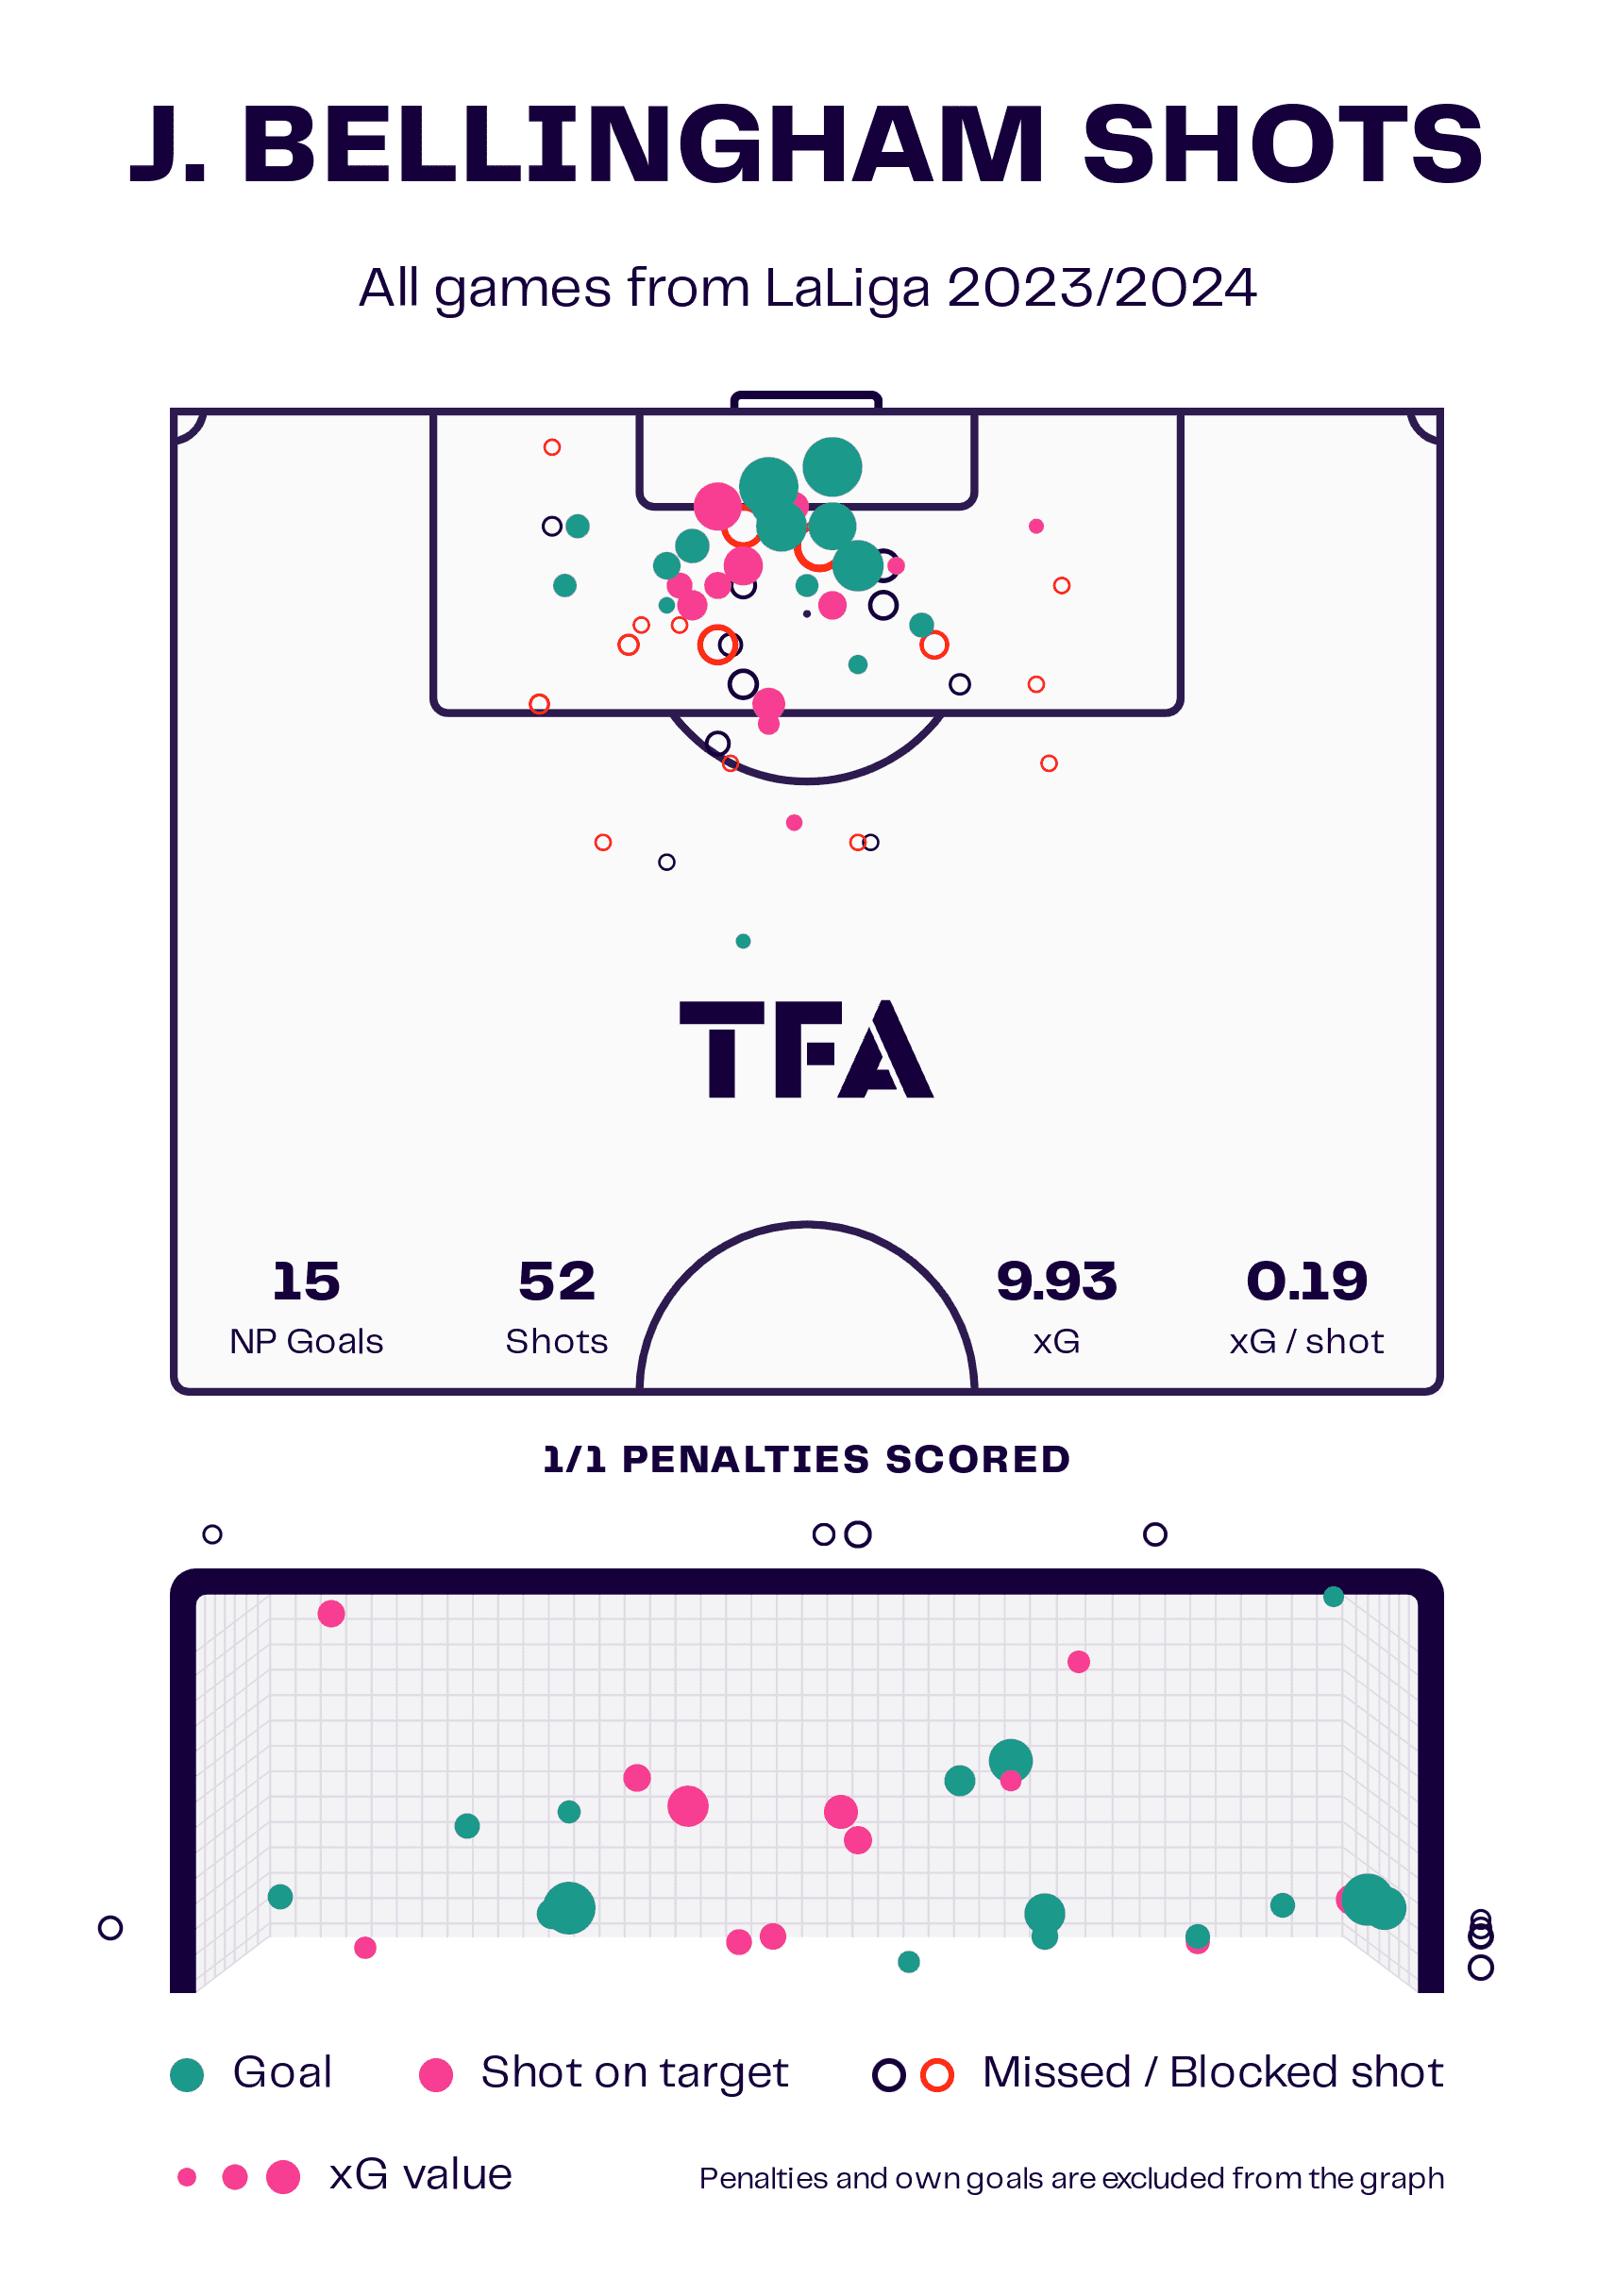
It is noticeable from the above that Bellingham isn’t taking too many shots from long range, where the goal expectancy value is generally lower.
The England midfielder has often found himself in strong shooting positions as he is often central to the goal from close range when trying his luck at goal.
Moreover, the graphic shows that Bellingham has been quite potent from within the left side of the penalty area as opposed to the right.
Our initial models focused on investigating the midfielder’s goal probability based solely on the expected goal value and then only the distance to the goal the shot was taken.
The results showed that the higher the goal value, the more likely Bellingham would score.
When it comes to distance, the closer Bellingham is to goal, the more likely he is to score.
However, these findings weren’t particularly insightful – the findings were merely logical and what would be expected regardless of the quality of the player.
We, therefore, decided to consider the angle to goal and found that the larger the angle, the greater the probability that Bellingham scores.
Take, for example, Bellingham’s effort against Atlético Madrid, where the angle to goal was 18 degrees.
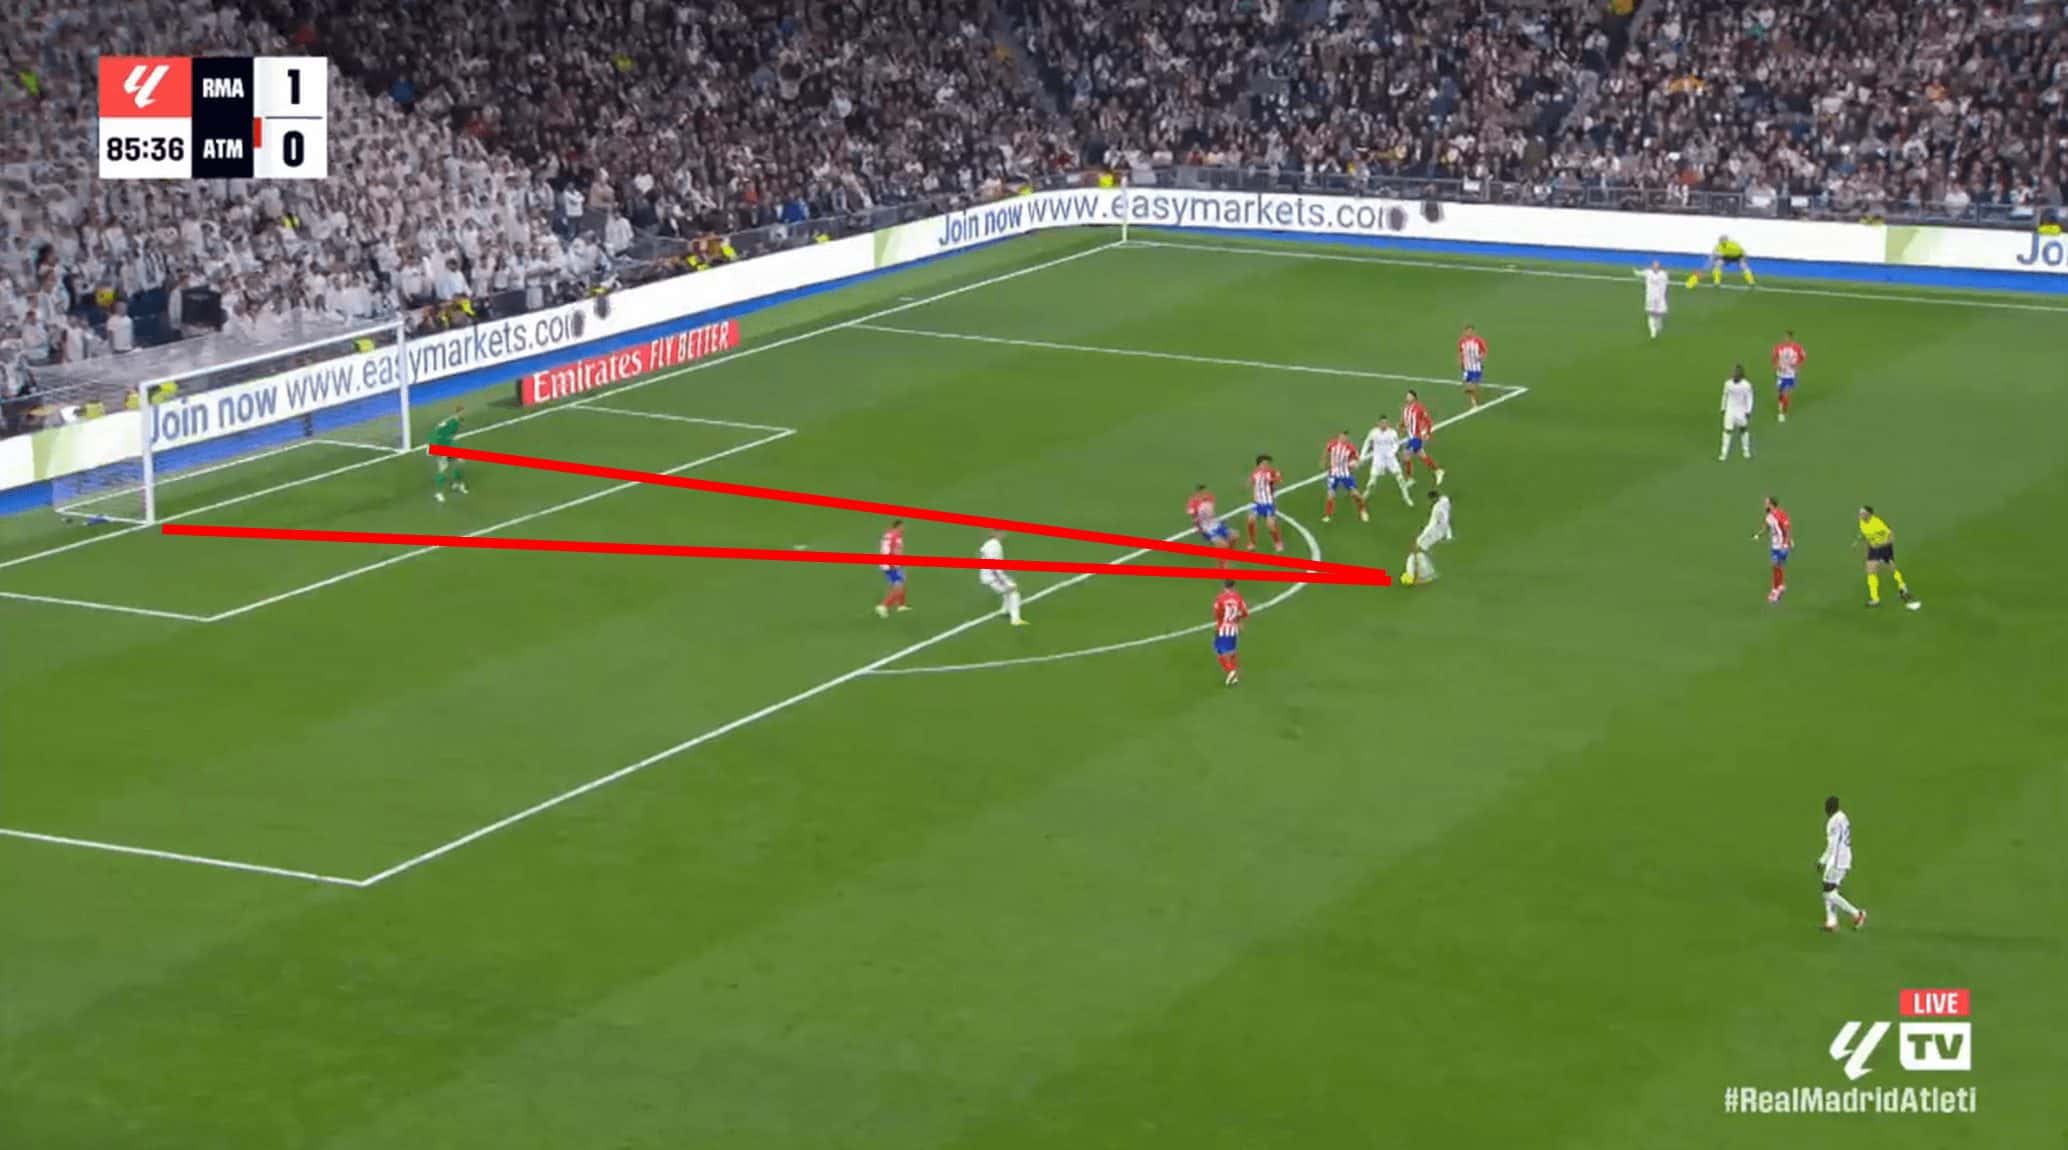
This particular effort was blocked by the opposition but based on our model investigating angle and goal probability, Bellingham had a 20% chance of dispatching this opportunity.
In contrast, consider Bellingham’s goal shown below against Celta Vigo where the angle was 80 degrees.
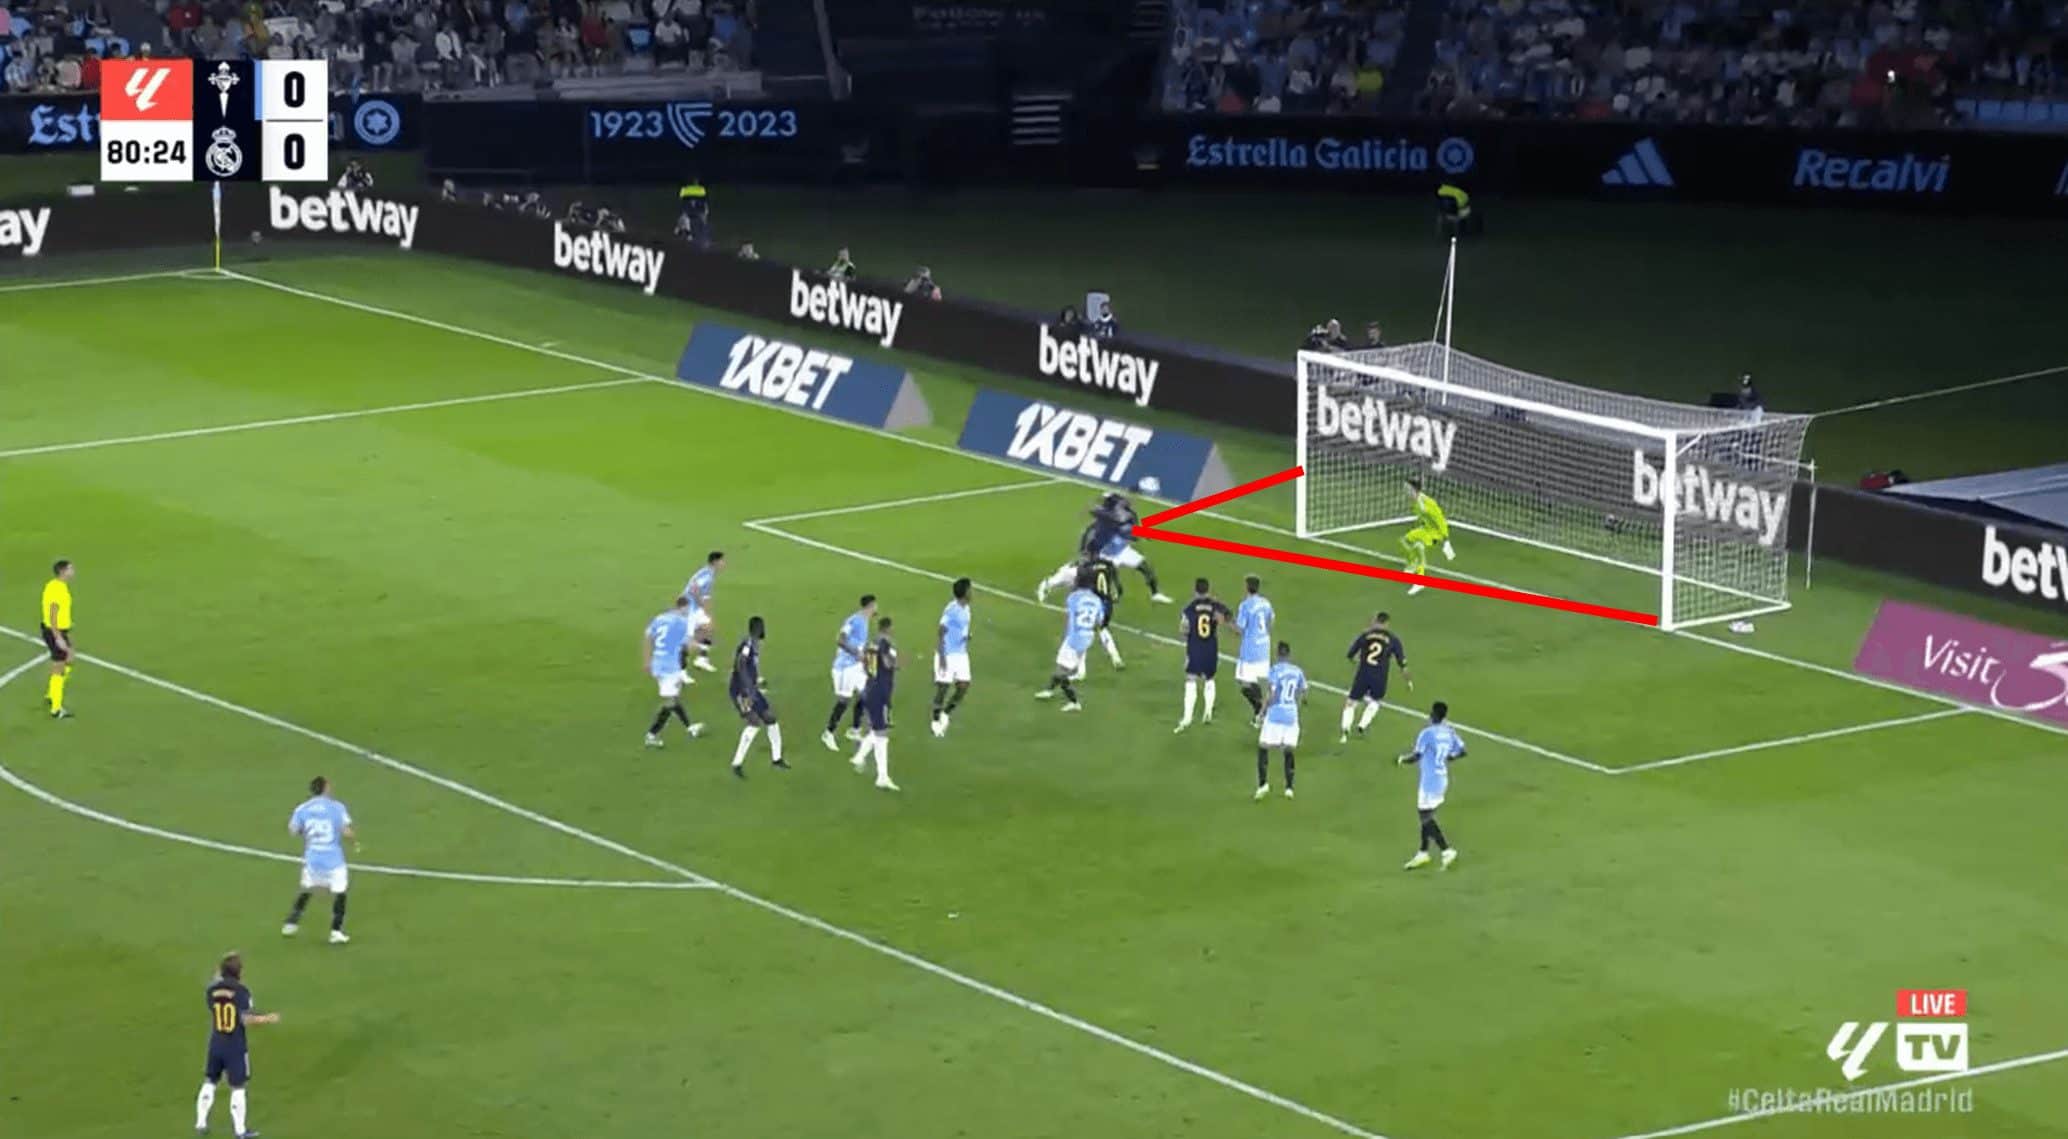
With an 80-degree angle at the goal, Bellingham has a 72% chance of scoring.
This shows that the greater the angle, the greater the goal probability which again is logical because it highlights the more the goal a player can see, the more likely they are to find the back of the net.
Something that stands out between these two shots though is that the first was attempted with the left foot, whereas the second was a header.
But could Bellingham’s shot type, in addition to shot goal angle, be significant?
The following graph shows the frequency of Bellingham’s shot types with respect to shot outcome.
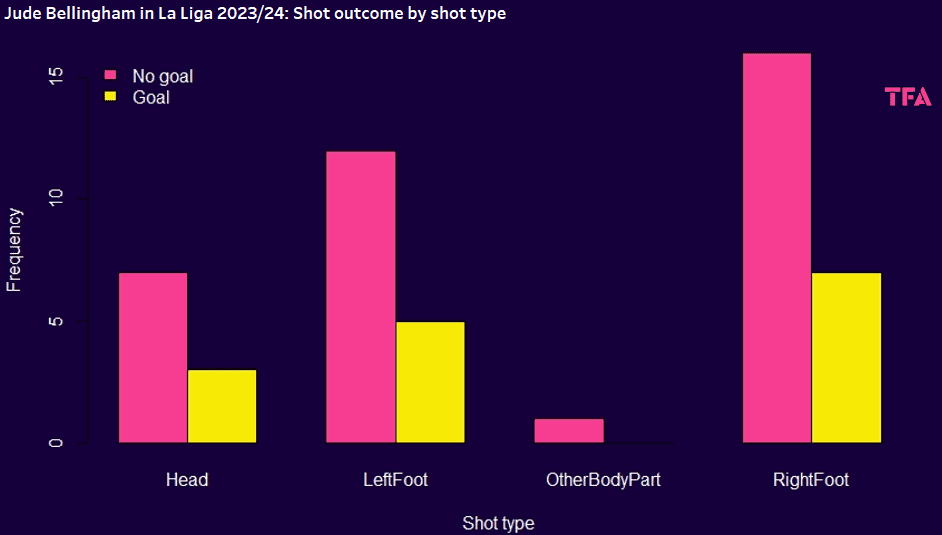
The plot shows that Bellingham tends to make more efforts with his right foot; our exploratory analysis determined that with each shot type, the Englishman dispatched 30% of his efforts.
Given this finding, it wasn’t surprising to find that shot type alone was not significant in determining goal probability.
However, including angle to goal with shot type did provide some insight.
The table below demonstrates different shot-type scenarios based on an angle of 25 degrees compared to 75 degrees.
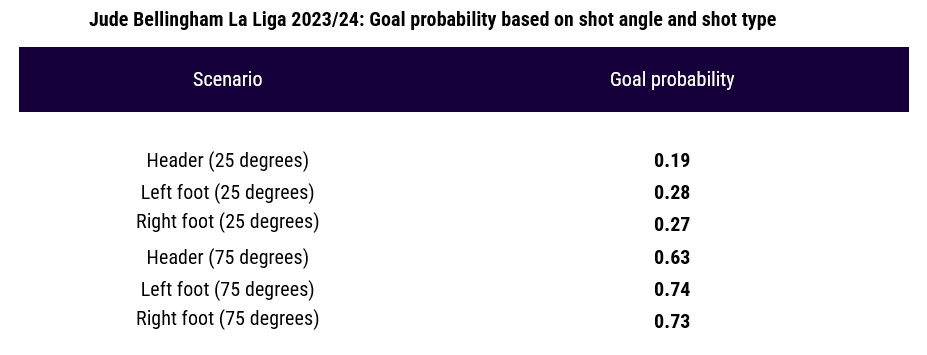
The table shows that whilst not much separates the goal probability depending on whether a shot was taken with the left or right foot, it is shown that the goal probability is smaller when Bellingham heads his efforts toward the goal when also factoring in the angle to the goal.
To extend this analysis, we also considered the situation in which Bellingham is shooting.
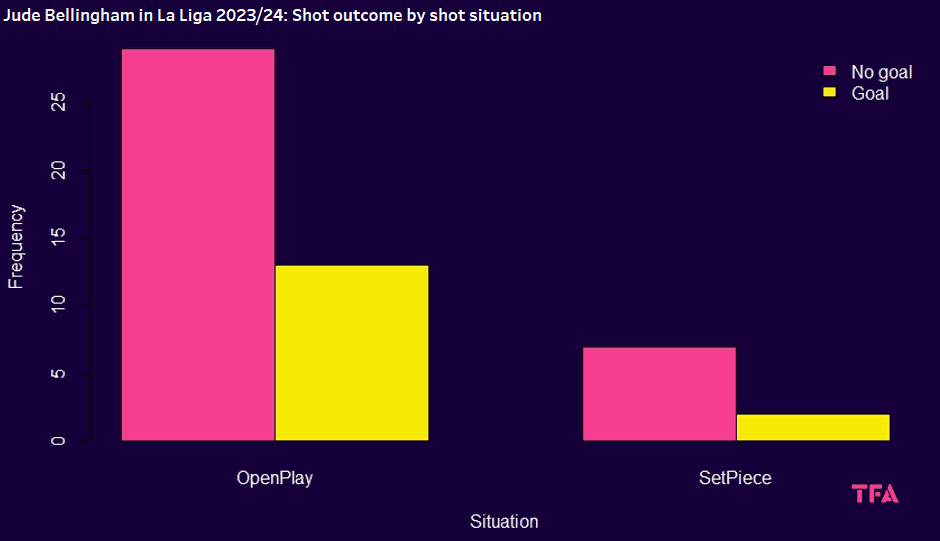
The bar plot shows that most of Bellingham’s shots in Spain’s first tier have come in open play, implying he is less dangerous from set pieces.
When considering a model that only investigates the shot situation with respect to the shot outcome, open-play situations were deemed significant.
Bellingham’s shots from open play have a 31% probability of resulting in a goal, compared to a 22% probability when his efforts come from set pieces.
We added the shot situation to our previous model to investigate this in addition to the shot angle and shot type.
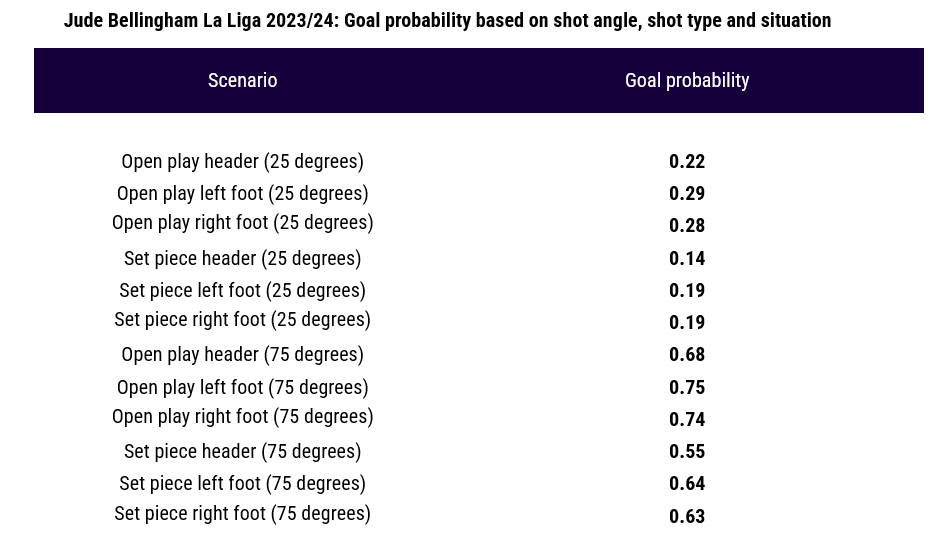
The table once again shows how a wider angle increases goal probability, and Bellingham is likely to be more dangerous during open play.
He is also likely to be less potent with his head.
We also included the pitch x and y coordinates to expand our model further.
From this model, we were able to use Bellingham’s shot coordinates to investigate specific shot locations.
The graphic below takes a random sample of coordinates to show the different probabilities of Bellingham scoring given a situation in open play and shooting with his left foot.
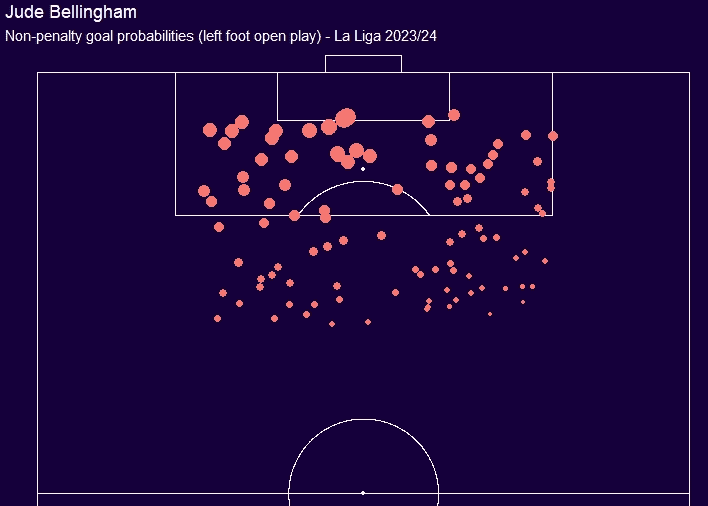
The larger the circle on the plot above, the larger Bellingham’s goal probability.
It shows that Bellingham is more potent with his left foot in open play to the left of the six-yard box compared to outside the area and, in some cases, the more central areas of the box.
We also used the model and random sample to determine the probability of Bellingham scores in the same scenario but with his right foot, as shown below.
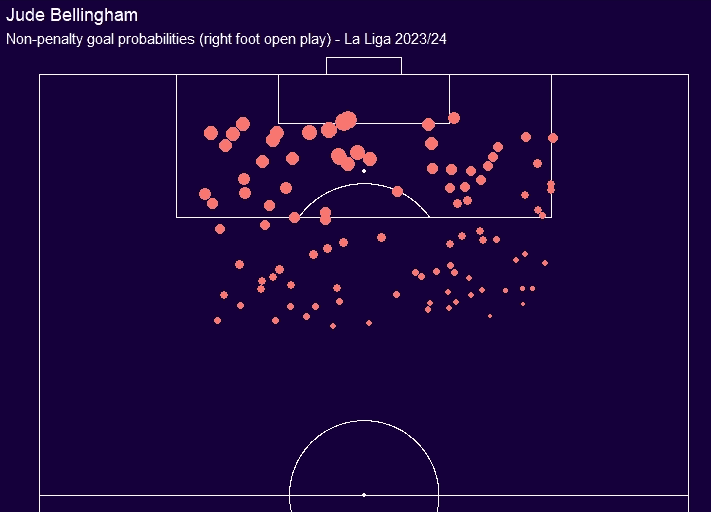
As we can see from the above, the difference between whether Bellingham scores with his left or right foot is minuscule.
What the two plots do show, though, is that Bellingham is more likely to score on the left side of the penalty area or centrally as opposed to the right side of the box.
He also has a higher probability of scoring within the area as opposed to outside the area.
But considering the midfielder’s role in the Real Madrid line-up, how can this information be used by opponents?
Jude Bellingham Heatmap – Insights gained
With an abundance of talent in the Real Madrid midfield, there were initial question marks on how Carlo Ancelotti would be able to accommodate the quality he had at his disposal.
At the beginning of the campaign, Ancelotti utilised a midfield diamond with Bellingham at the tip in support of the strikers.
However, the Galácticos have not been rigid in sticking with this philosophy throughout the season and have fluctuated between different formations, opting for the 4-4-2 mostly.
There is a great deal of flexibility with how Madrid operates, and freedom is often given to the players, given their collective technical ability.
Jude Bellingham Heat Map 2023/2024
In the case of Bellingham, he tends to occupy the left of the midfield, as shown in this Jude Bellingham heatmap below.
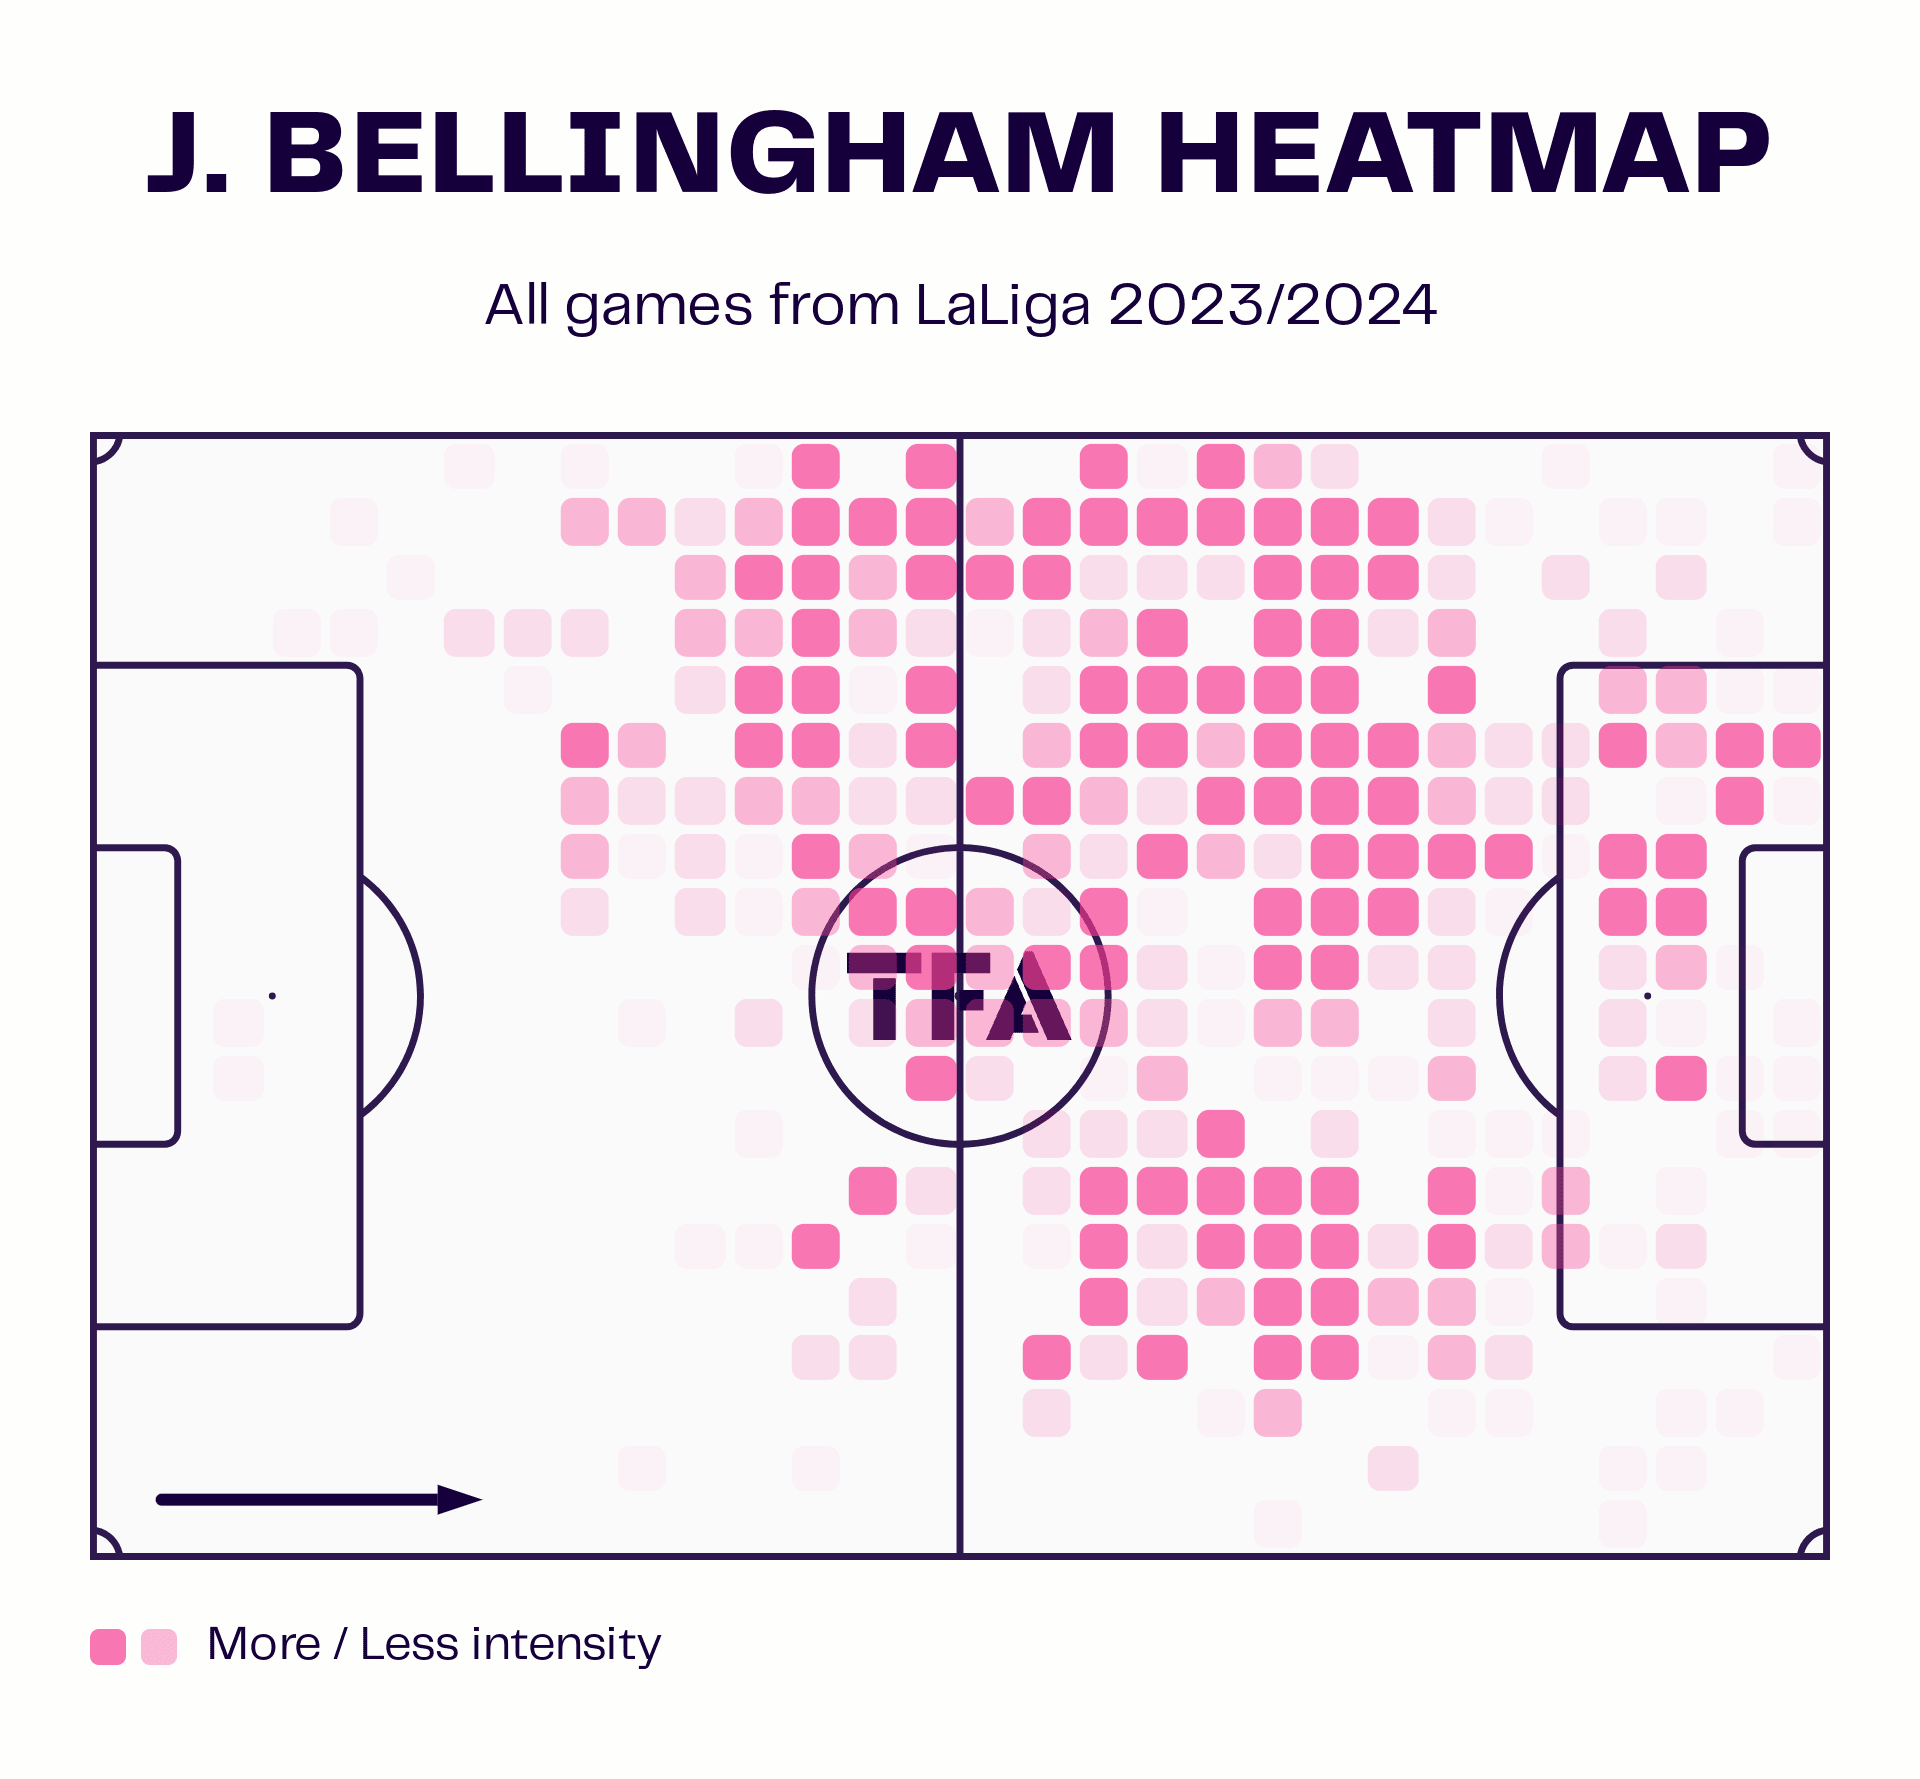
Bellingham often looks to exploit spaces in the left half-spaces and as indicated in the graphic, looks to make entries into the left side of the penalty area.
This analysis has shown that when he can get into such areas, he is more potent.
Take the example below where Madrid is counterattacking, and Bellingham eventually scores.
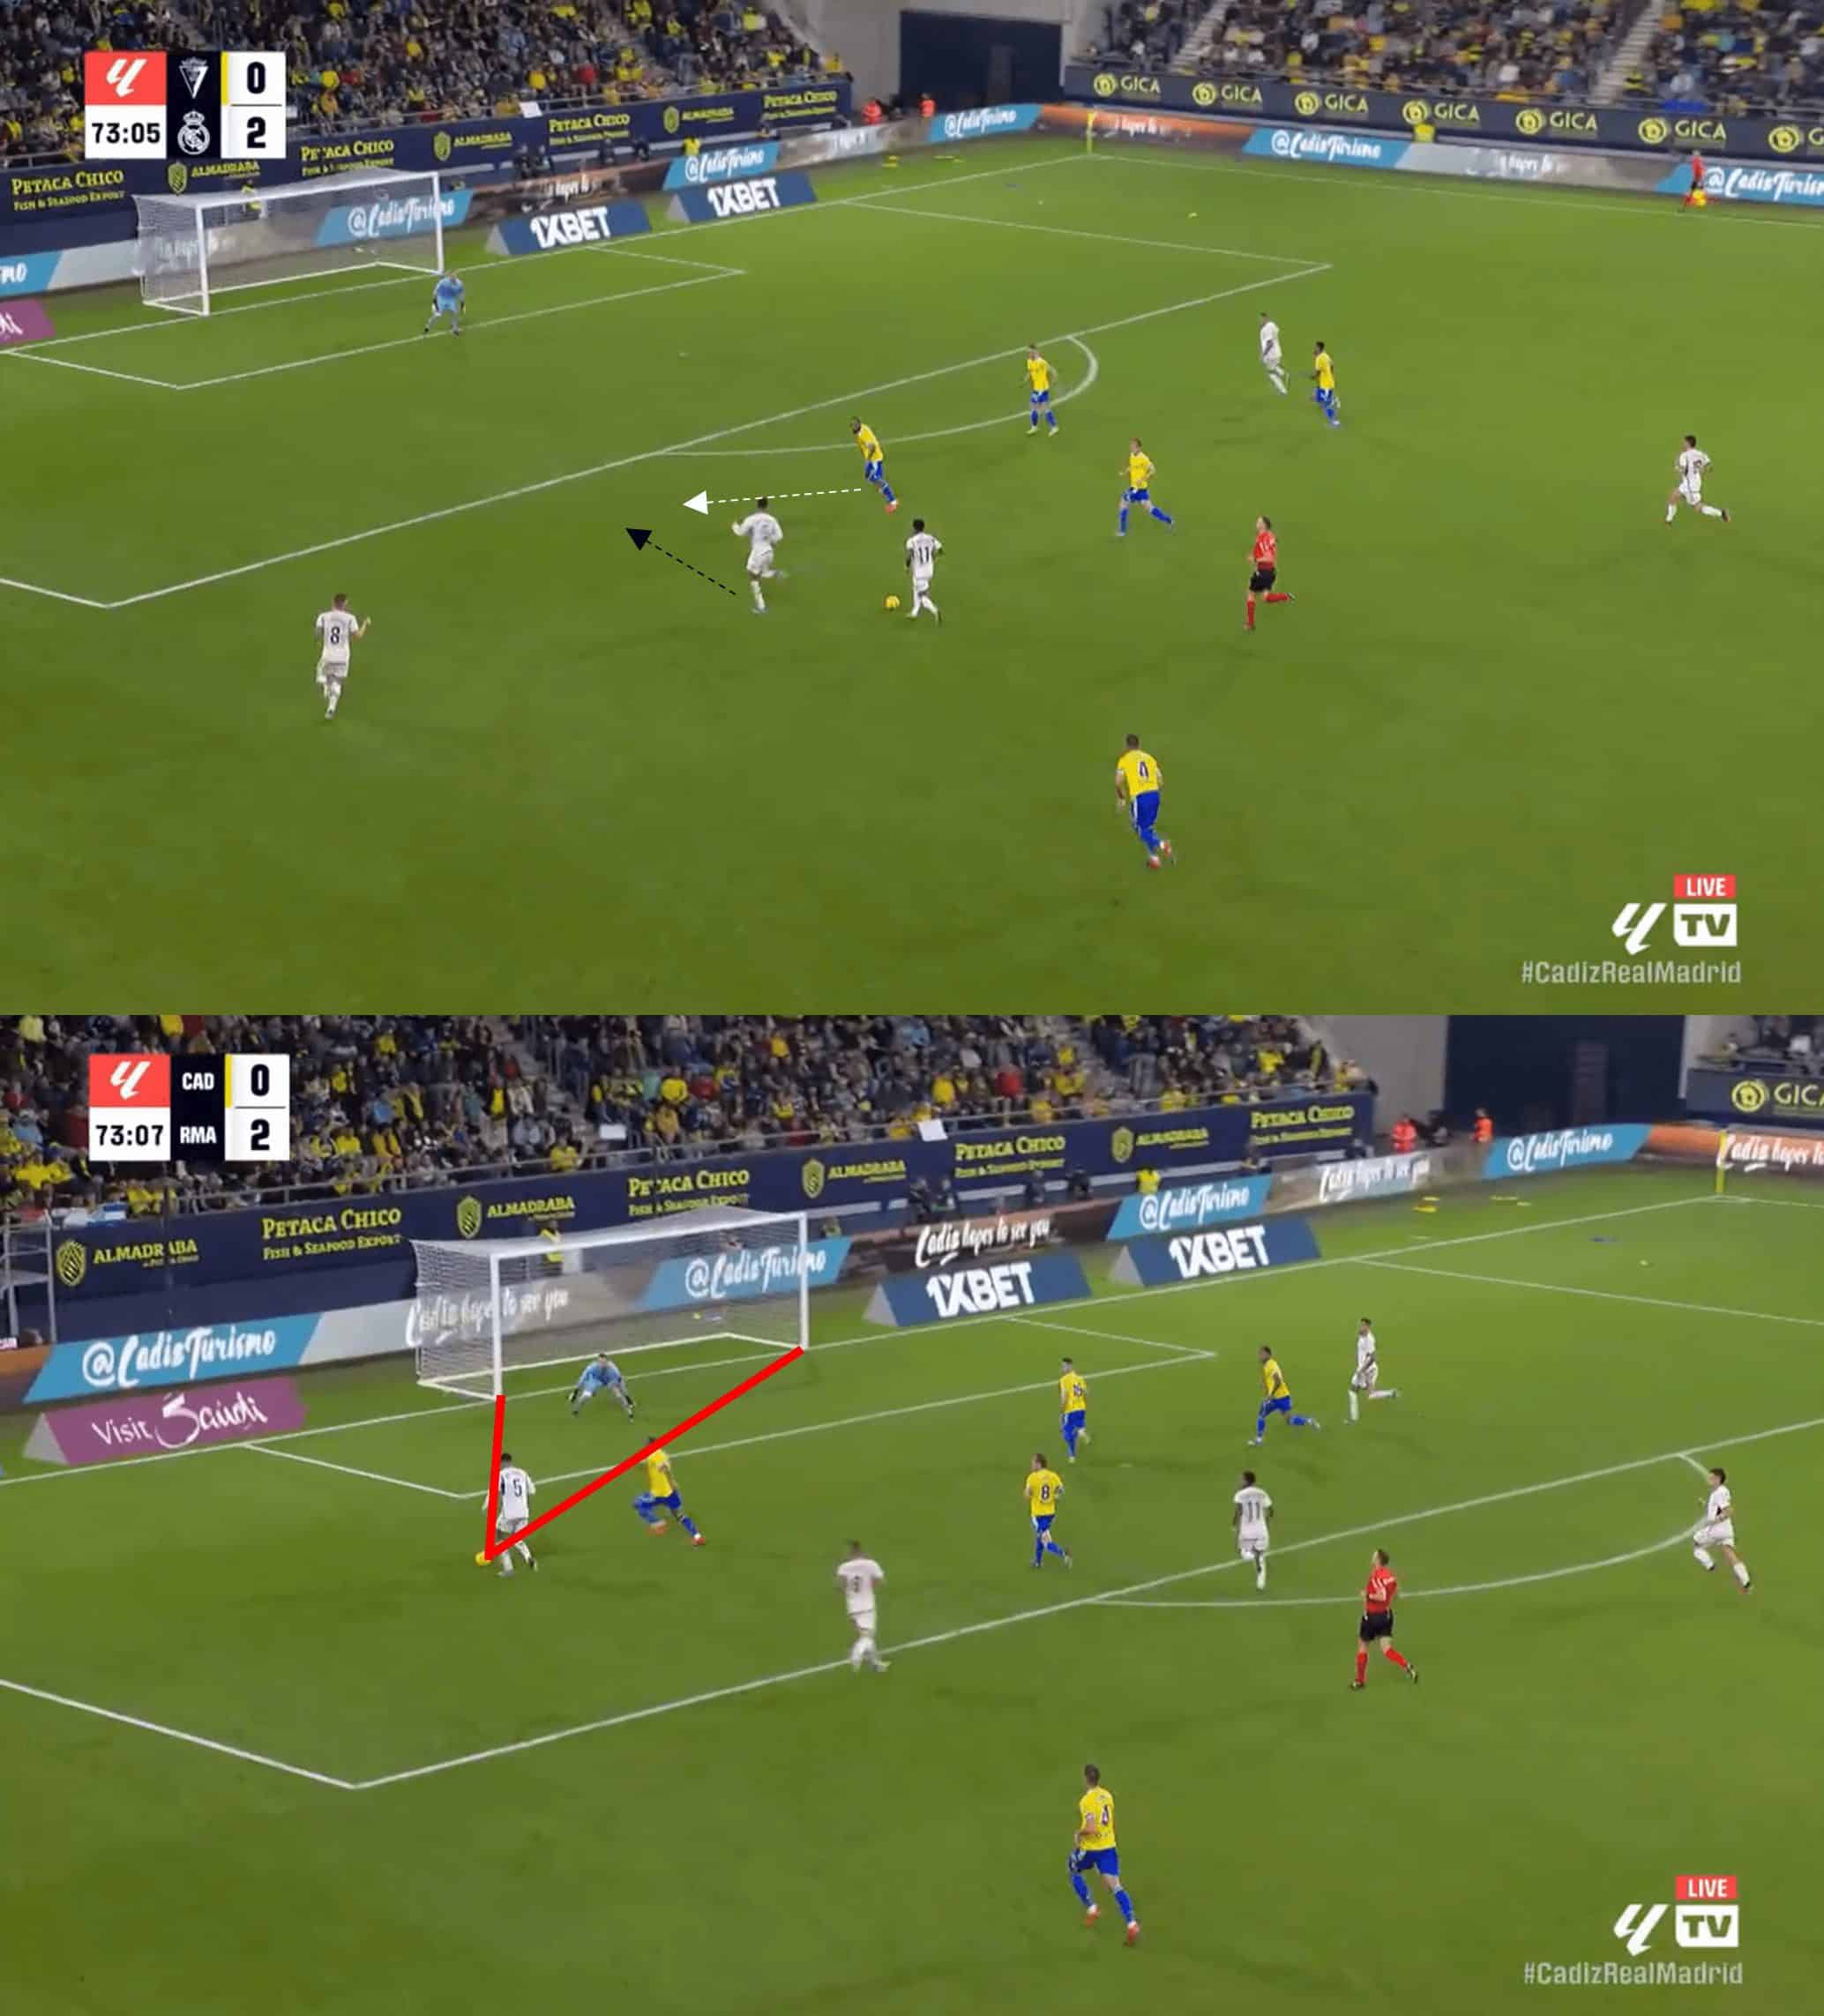
With the knowledge that Bellingham would look to make a run on the left side, Cadiz needed to be quicker in closing down both Bellingham’s run and Rodrygo, who had possession.
The lack of closing down ensured that by the time Bellingham had seen the goal, he only had the keeper to beat, which was a more favourable angle.
Had the defender been quicker in closing the midfielder down, the Englishman would have had a reduced angle to goal and, as we’ve seen from this analysis, a reduced goal probability.
Bellingham is a crucial figure in attacking transitions due to his intelligence in being able to read the game and astute tactical awareness.
He always looks to play on the front foot and is ready to make attacking runs, as he often sees opportunities quicker than the opposition notice such danger.
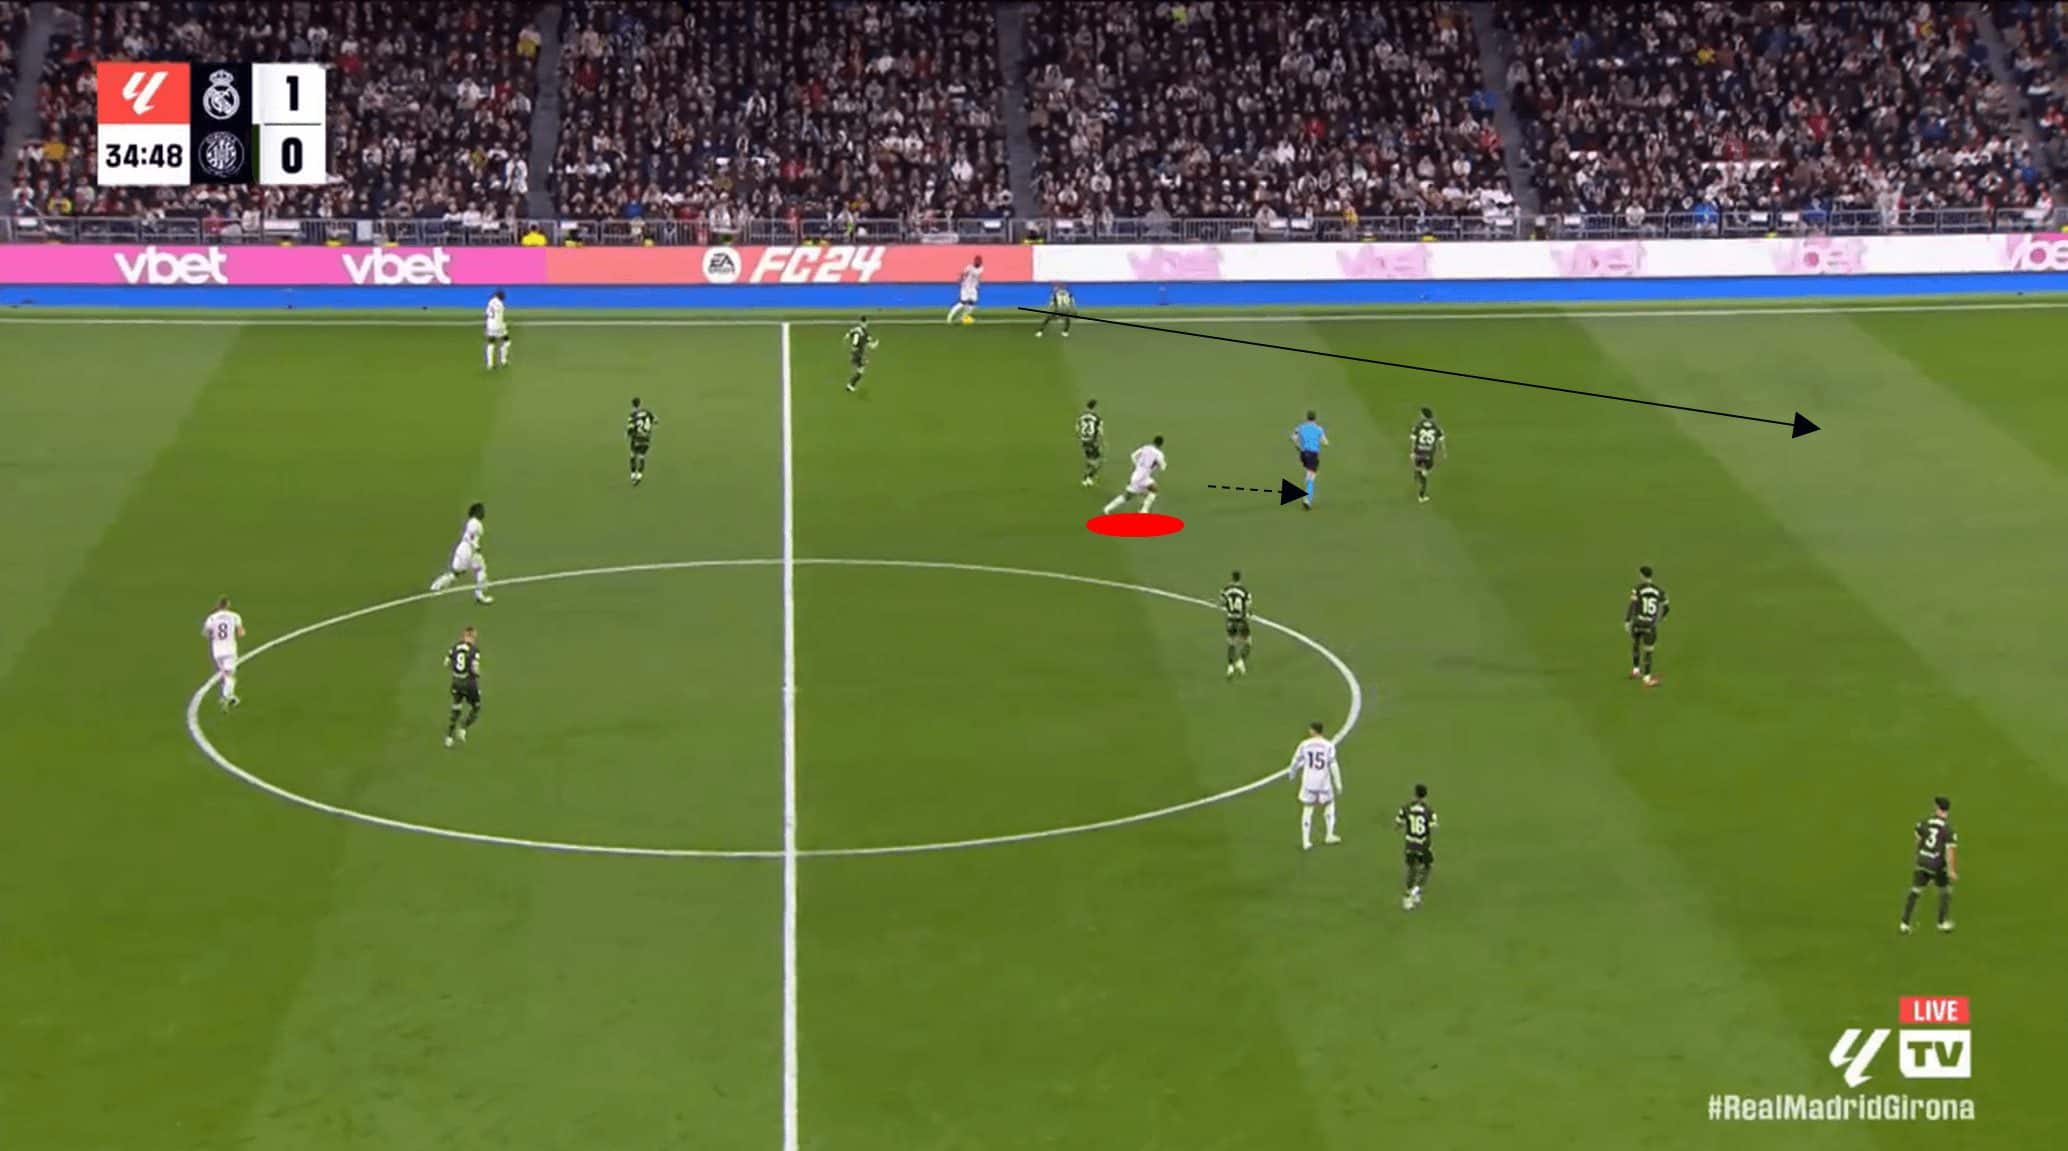
As Madrid has possession on the left flank, seemingly posing little attacking threat, Bellingham has other ideas and has already started a run to expose the gap in the Girona backline.
His closest marker at this point doesn’t even have sight of the Englishman.
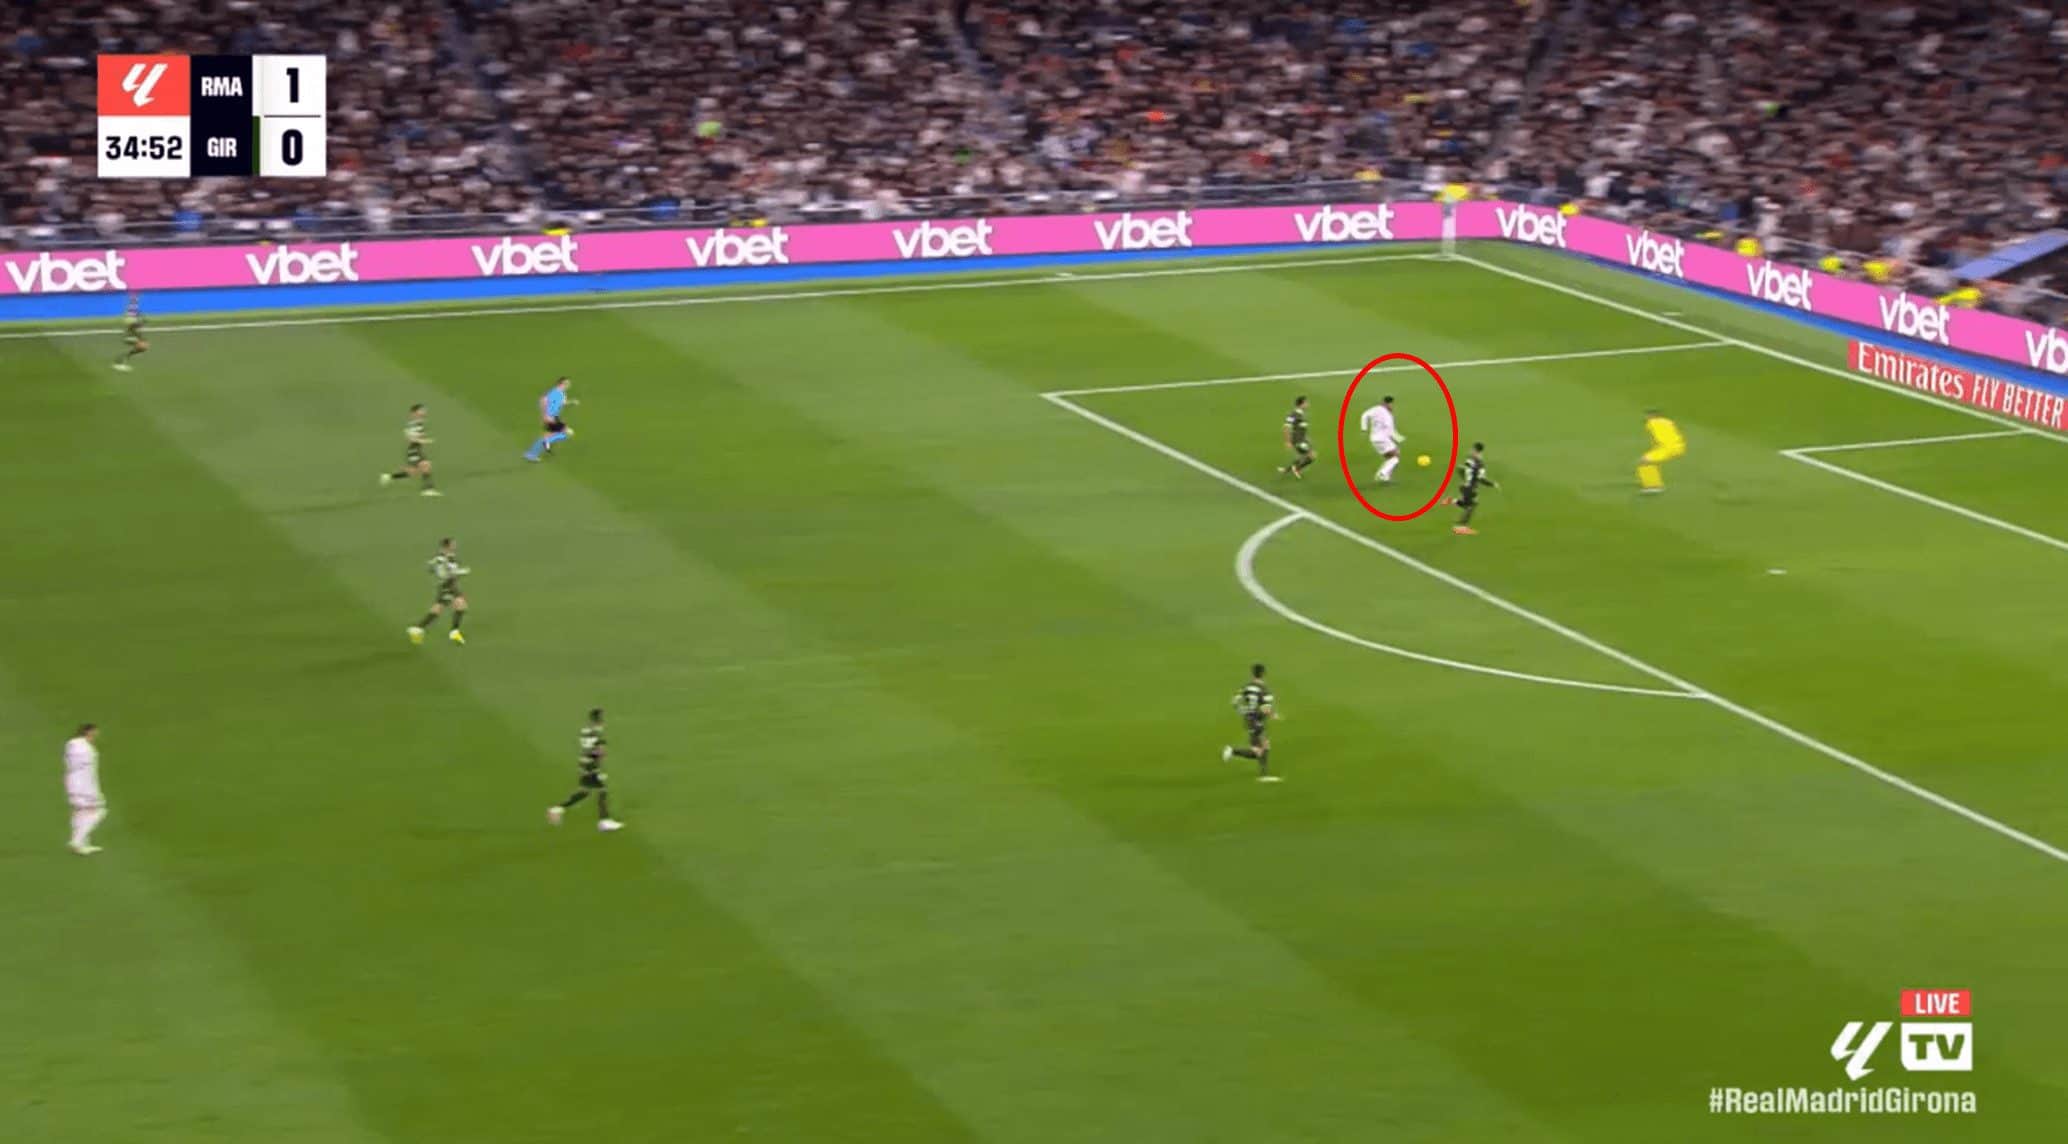
The pass itself from Vinicius Júnior is quality, but the goal itself is more a product of Bellingham’s initial off-the-ball movement.
He already had the advantage of a head start in the attack compared to the defenders, but this, coupled with his athleticism, ensured he was first to the pass and subsequently rounded the keeper to score.
Bellingham has an ability to find pockets of space, and with this in mind, it poses the question of whether man marking him may be the solution to decrease his attacking threat.
If an opponent has eyes on the midfielder at all times, he may be less likely to be able to expose gaps going forward.
Moreover, if an opponent was to frustrate Bellingham, he may be tempted to take up spaces on the right side of the final third.
As this analysis has shown, Bellingham has a lower goal probability from such areas — so a potentially rewarding tactic for the opposition.
Even if the opposition does not go down the man-marking route, a critical consideration that the statistical models showed is the importance of closing Bellingham’s angle to goal, particularly on his favoured left side.
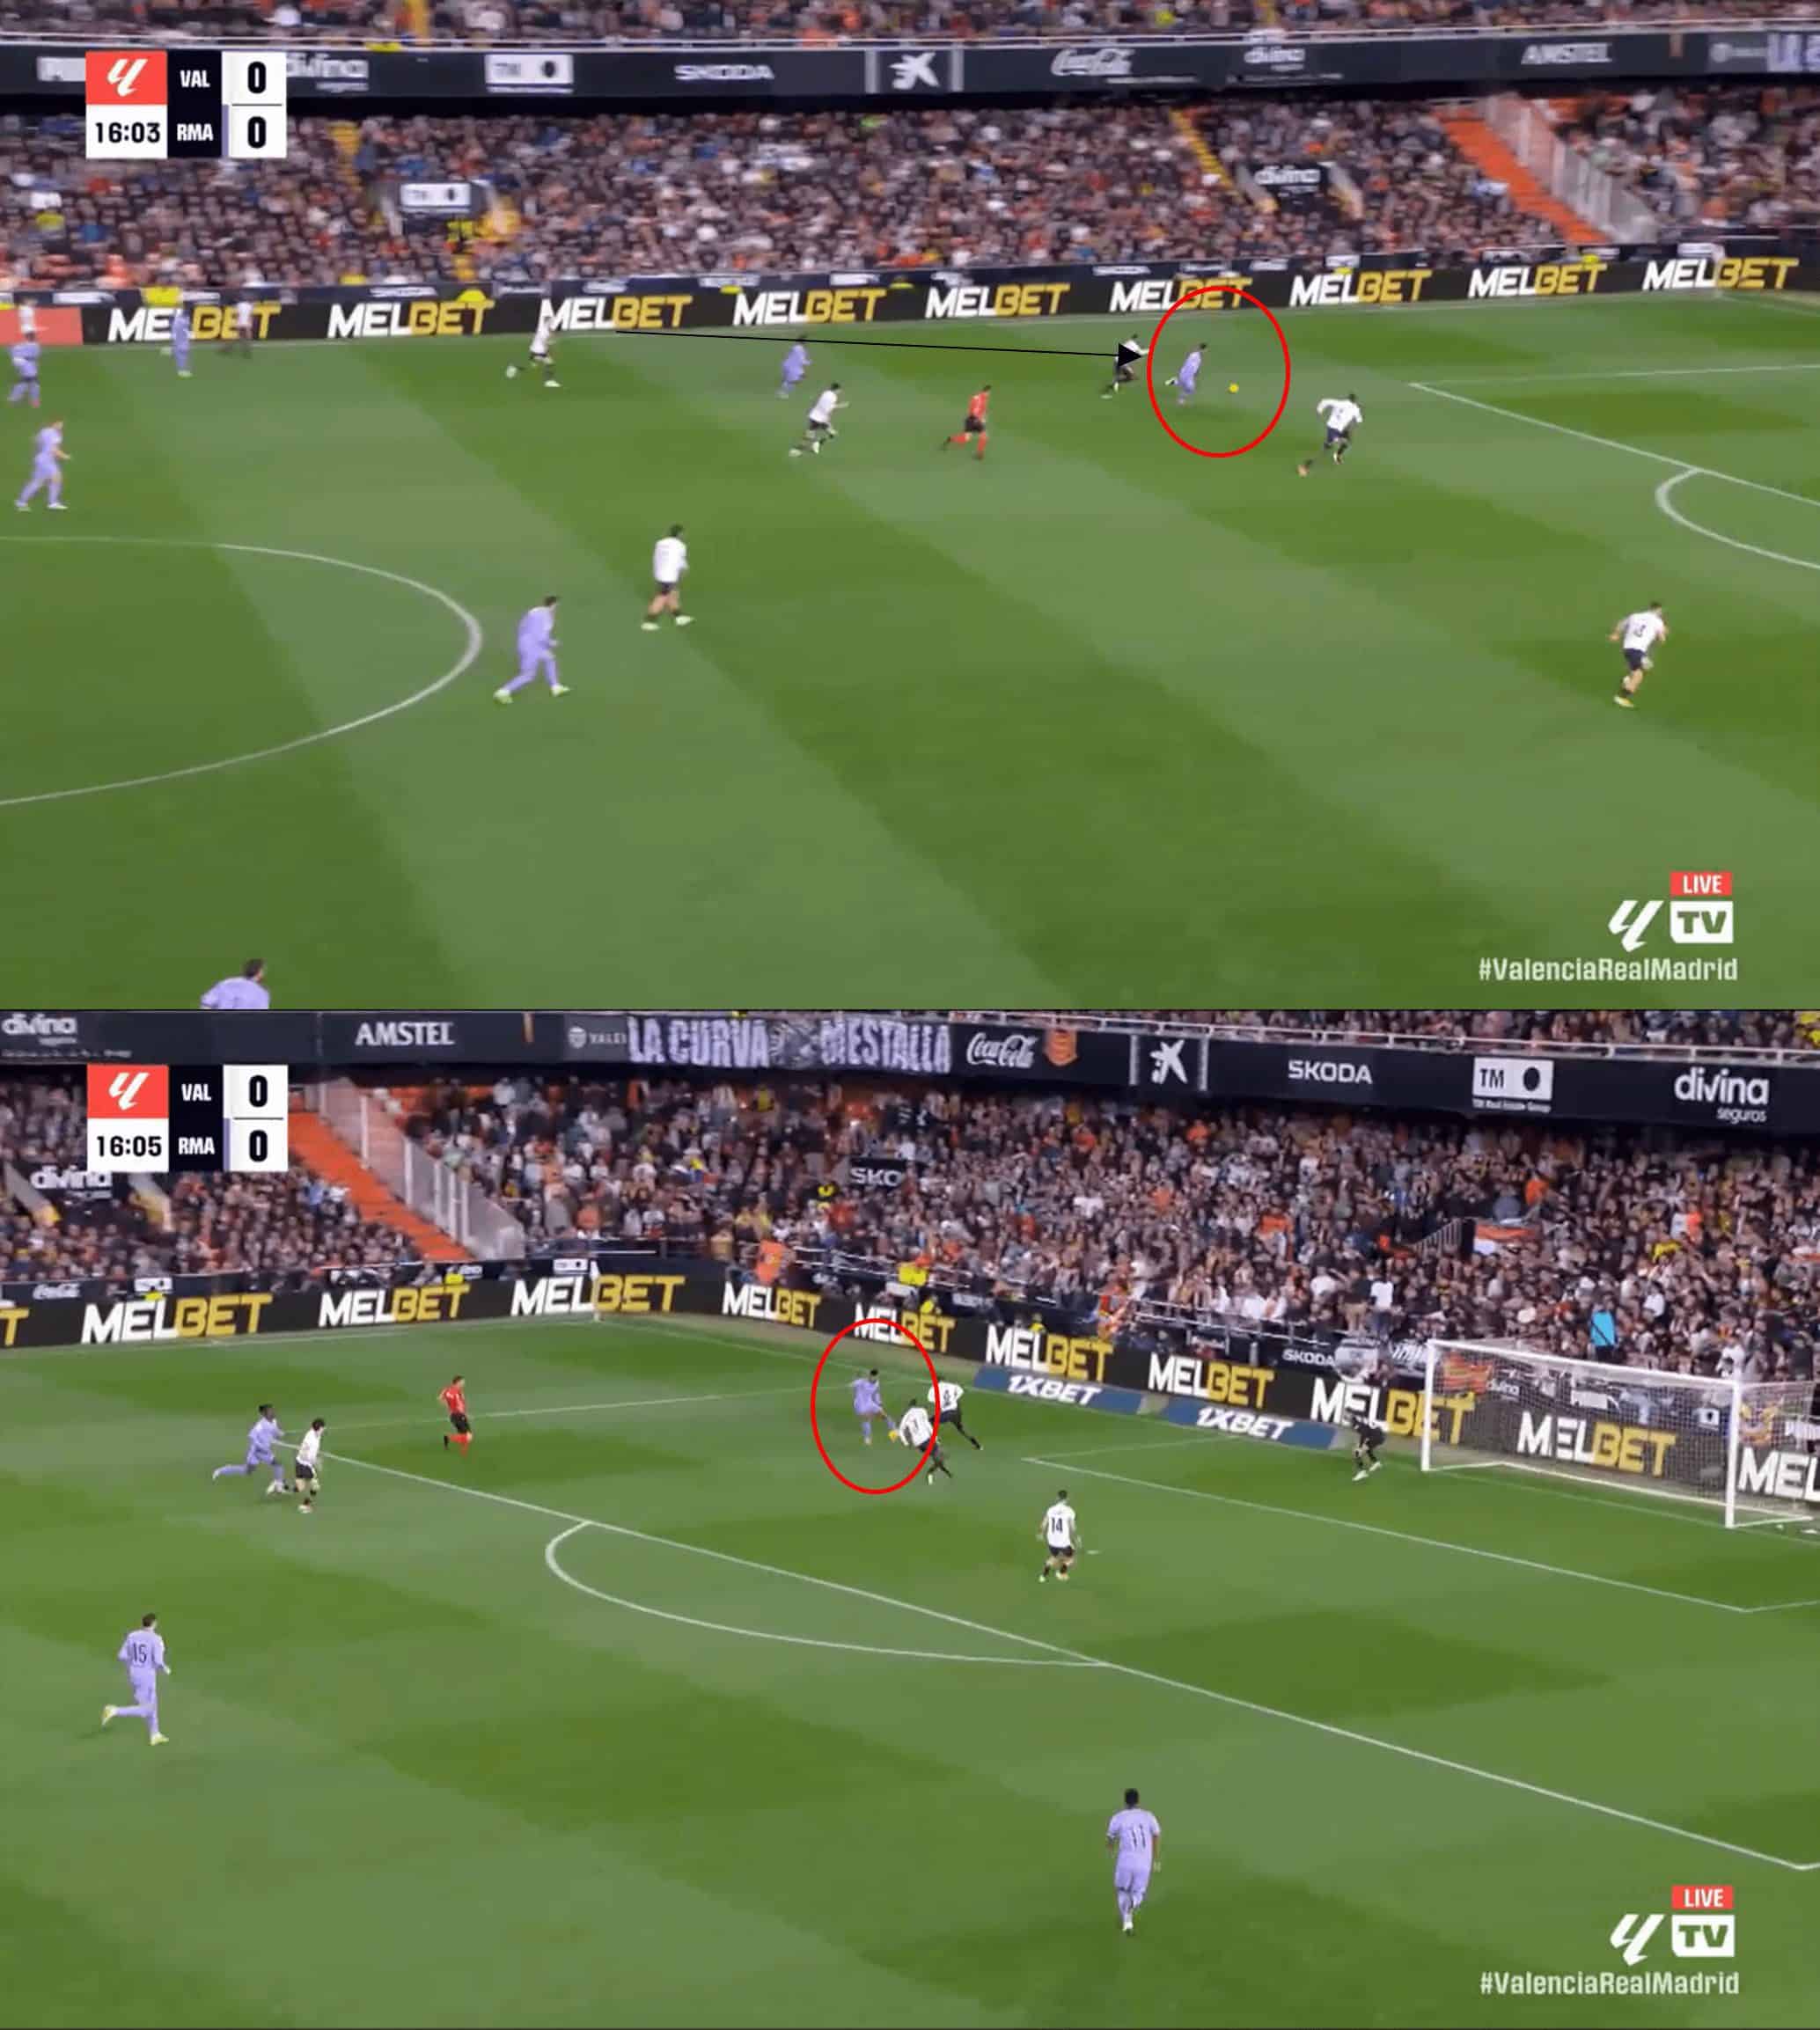
In almost identical circumstances to the Girona goal, Bellingham is played through having run through the half-space of the Valencia defensive line.
However, Valencia is quicker to close down, and as a consequence, Bellingham is forced onto his right in a less advantageous shooting position.
The midfielder opts to play a cross into the area instead, which is cleared.
It goes to show the importance of the angle when shooting and the impact it can have on goal probabilities.
Conclusion
If we refer back to our initial questions at the start of this piece, we can conclude that Bellingham is more of a threat from open play than set pieces.
Furthermore, the angle of the shot plays particular importance, especially coupled with how he strikes the ball as he is less dangerous with his headers from smaller angles.
This xG data analysis has further shown that the positioning of Bellingham’s shots is key.
Opponents would be wise to watch out for his movements in the left half-spaces as well as entries into the more central areas of the box.
We have shown how useful logistic regression can be in the context of goal probabilities.
Whilst it is recognised that further considerations such as the positioning of the goalkeeper could also be taken into account, we have demonstrated that such a statistical model can serve as a good starting point to provide valuable insight not just for the player but also for the opposition.






Comments