On the opening day of the 2024/25 Scottish Premiership season, Hearts were still basking in the praise that had followed them from their excellent 2023/24 campaign.
The Edinburgh club finished third, qualifying once again for Europe and impressed with strong performances against Scotland’s traditional top two, Rangers and Celtic.
One man who had been tipped for a big summer move was Hearts captain and star centre-forward Lawrence Shankland.
Shankland contributed extensively to the Jambos’ excellent campaign, with his strikes accounting for 44% of their total league goals.
Shankland earned many accolades at the end of last season.
He was voted Scottish PFA player of the year, and his red-hot form earned him a place in Steve Clarke’s Scotland squad for Euro 2024.
Rangers and English clubs were rumoured to be on the hunt for the Glasgow-born striker.
Three months later, Hearts and Shankland find themselves in a very different place.
Currently lying in 11th with only nine points, Hearts sacked their manager, Steven Naismith, in September after losing eight matches in a row.
Hearts brought in Neil Critchley to right the ship however many point to Shankland’s poor start as a critical reason why Hearts have been well below their best.
This begs the question, why has Shankland failed to perform this term?
This analysis aims to discover why Shankland has failed to reach the heights of last season and what he must do to start finding the net regularly again.
Lawrence Shankland’s Player Performance
Shankland’s numbers from last season prove why he deserved the praise and accolades he received throughout the season.
In 37 league games, he scored 24 goals, which averages 0.6 goals per 90.
In comparison, this season, he has only scored 1 goal in 12 league appearances, averaging a goal every 0.08 games.
Lawrence Shankland Radar Map
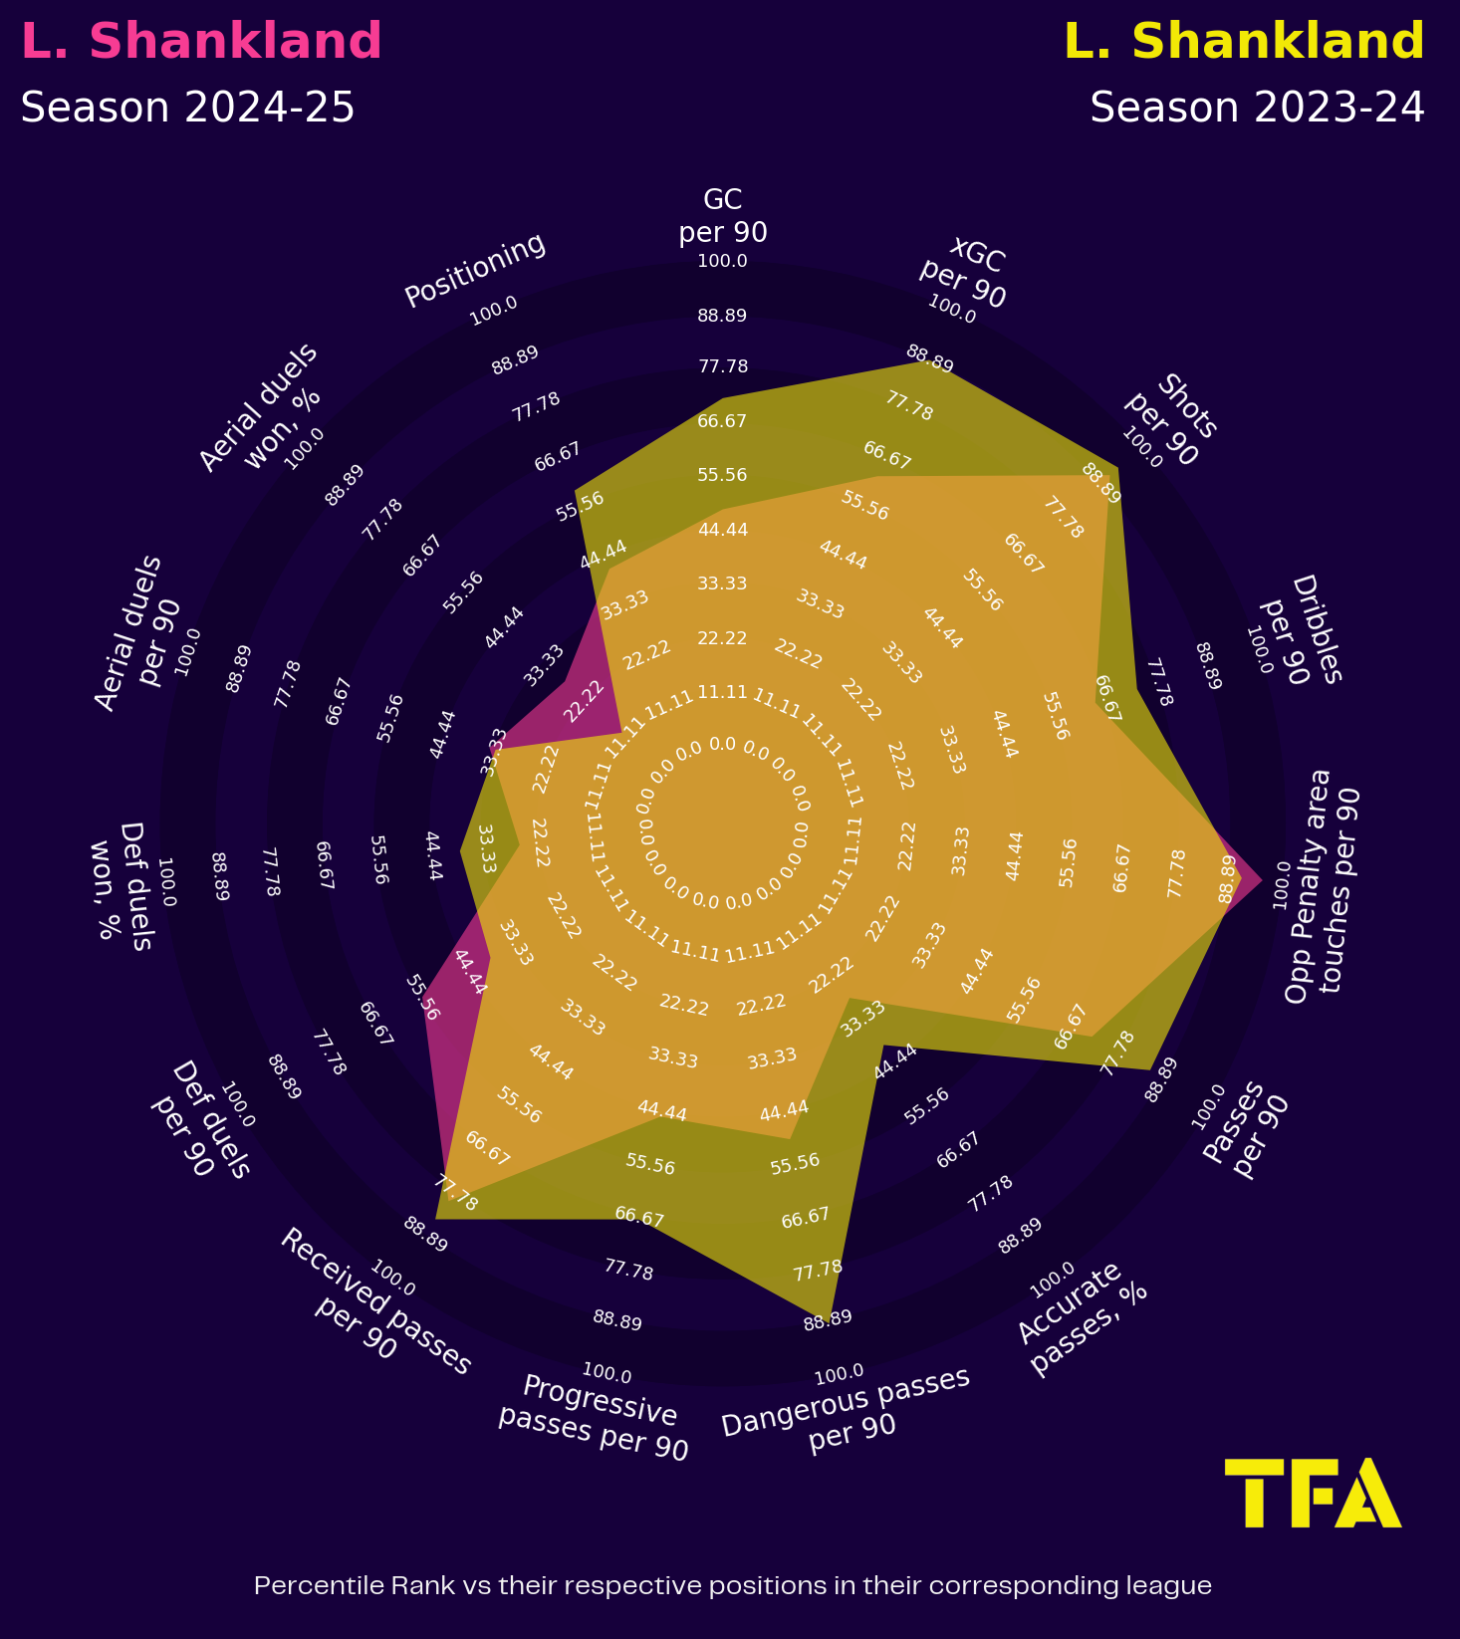
From the radar chart above, it’s clear that Shankland is underperforming in nearly every attacking metric when you compare his percentile ranks from this season to the previous.
He is exceeding touches in the opposition’s penalty area compared with last season, yet the only other area that he’s close to matching from last campaign is the number of shots he’s taking.
Delving deeper into the statistics reveals clear signs that he’s not performing at the same level as last term.
His percentage of shots on target has decreased from 34.8% to 31.6%.
Evidently, his conversion rate has also drastically dropped, from 17.77% last season to 2.63% this season.
Could Shankland’s poor form be down to a drop-off in his overall quality as a finisher?
The answer is in the details.
Was Lawrence Shankland’s Form A Fluke?
Shankland’s incredible form has been sustained over two seasons.
After joining Hearts at the start of the 2022/23 season, the 29-year-old has scored 24 league goals in both seasons.
However, there’s clear evidence to suggest why Shankland failed to reach the same heights this season.
Lawrence Shankland’s Shots Map
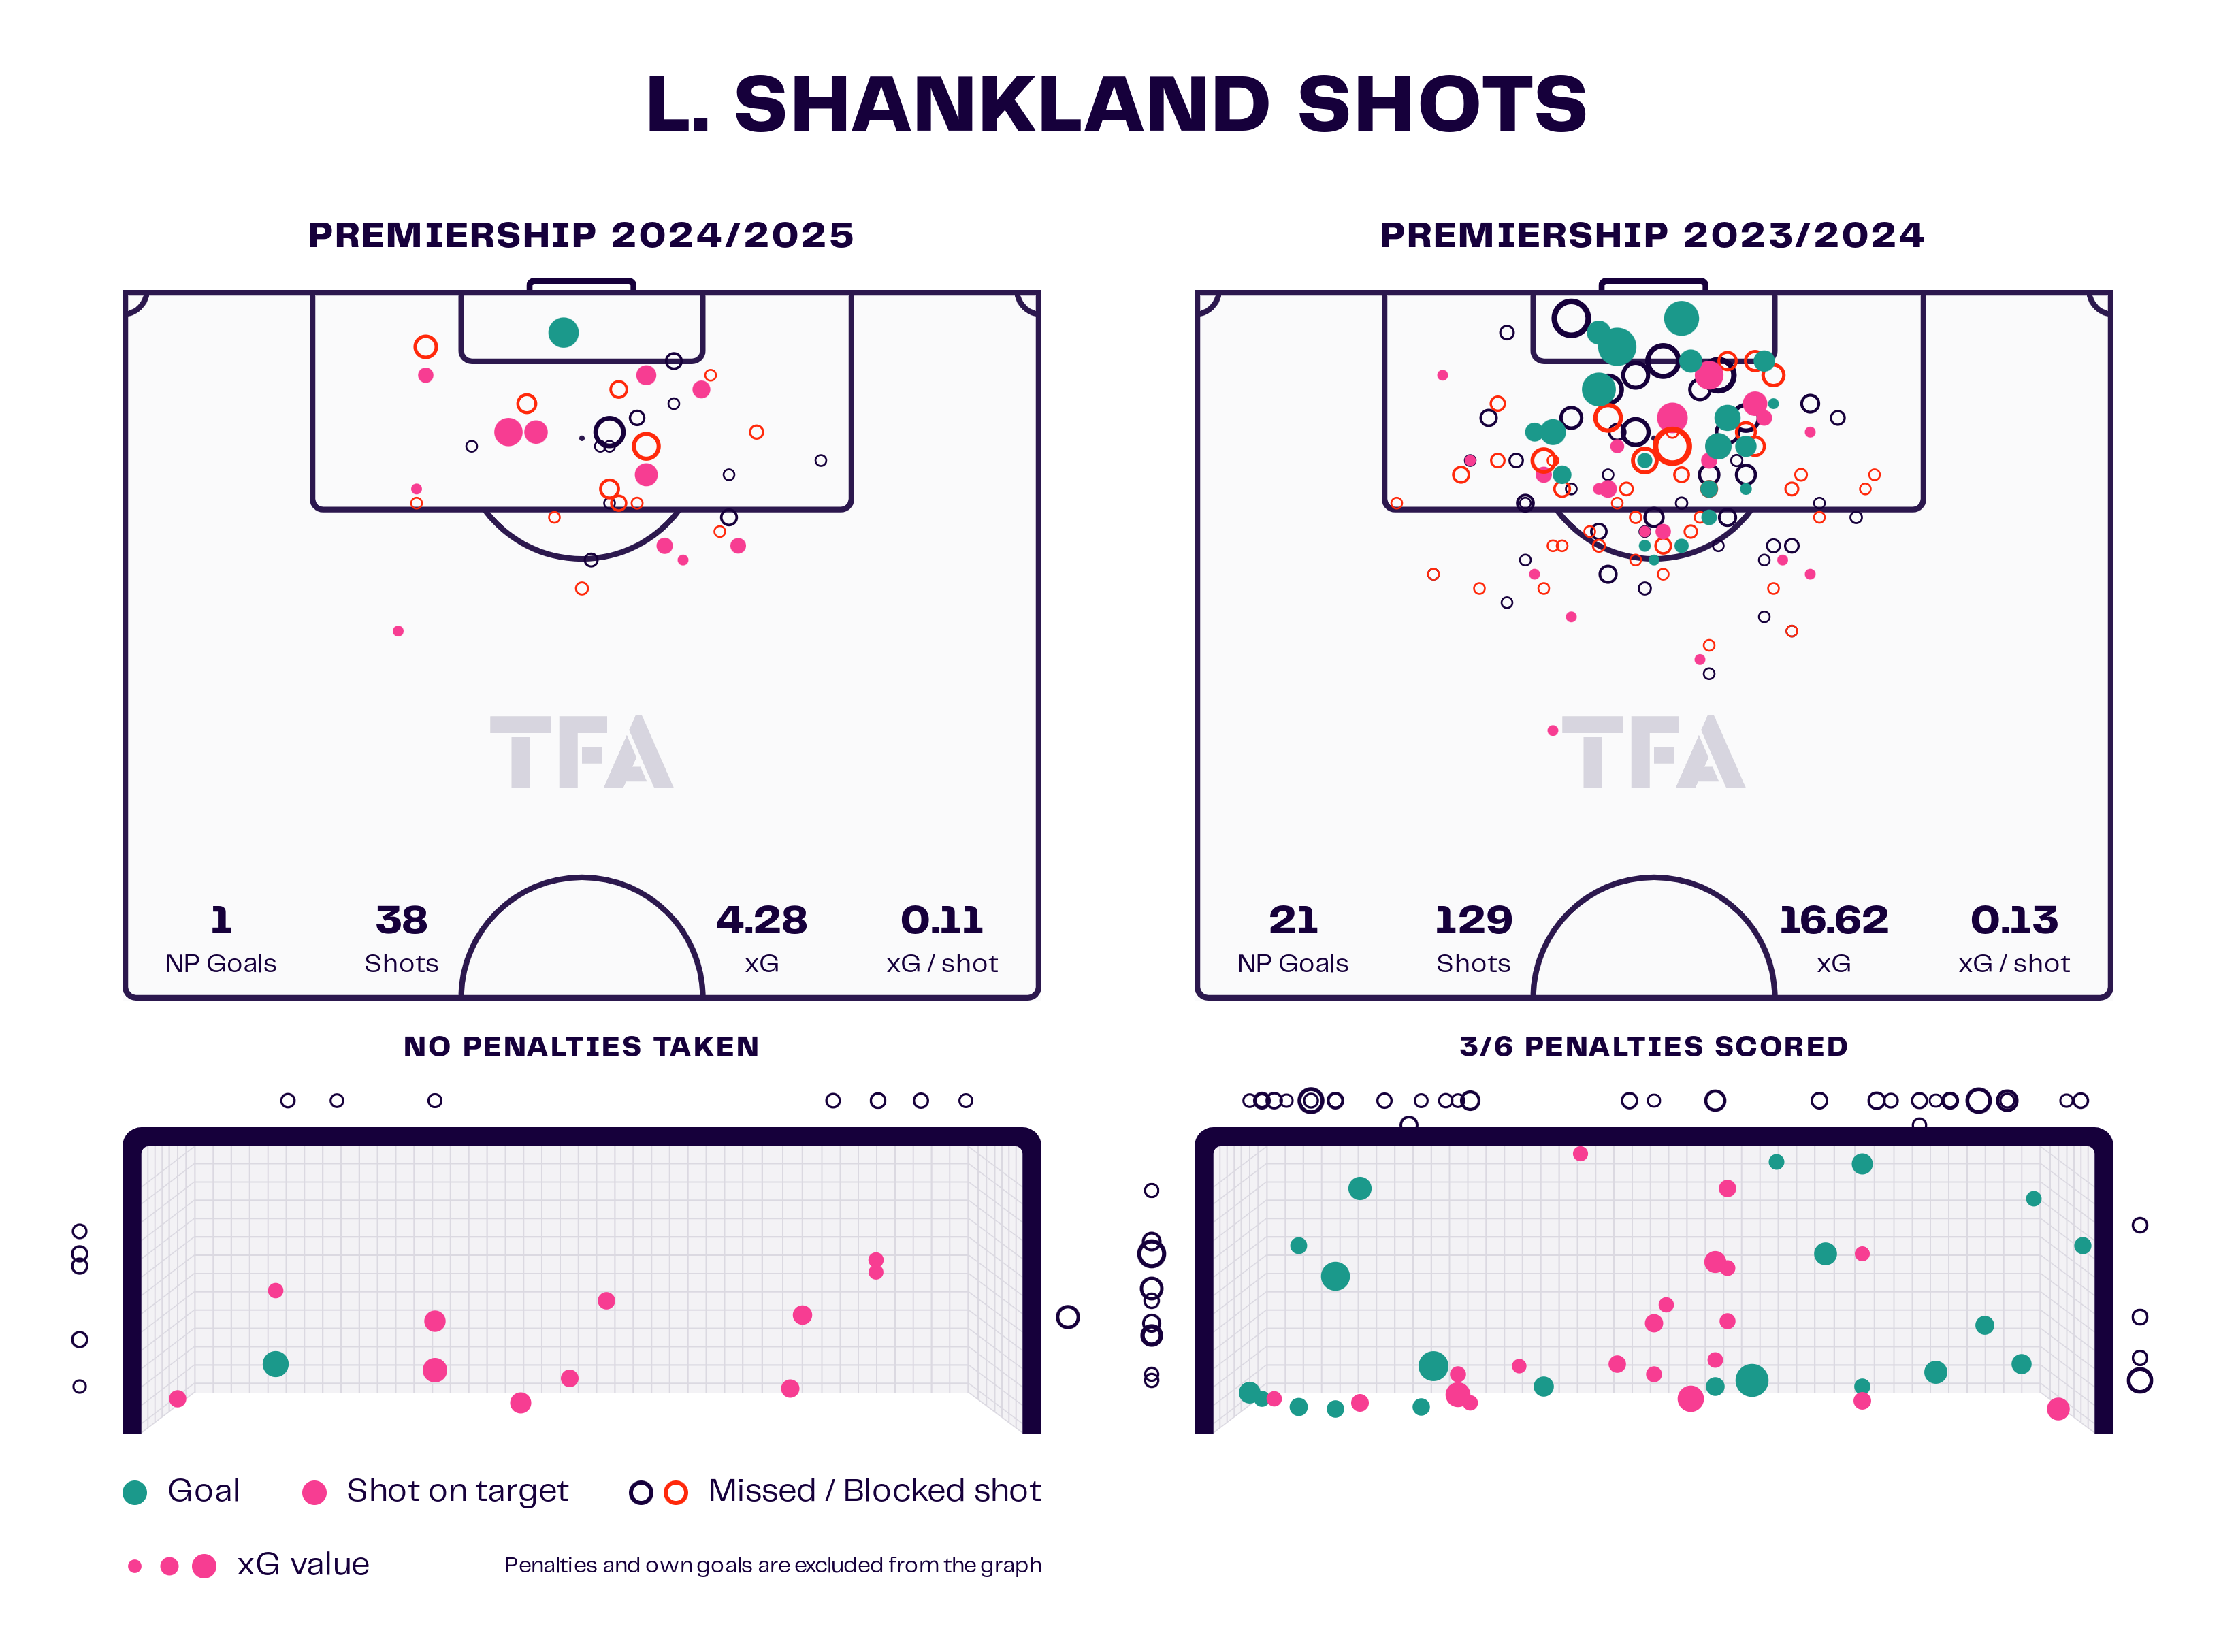
The first factor that has gone against Shankland is that the Hearts haven’t yet been awarded a penalty.
Last season, Hearts were awarded nine penalties, with Shankland taking six of them.
The forward had a fairly poor conversion rate of 50% from the penalty spot.
This still contributed three goals to his overall total.
Strikers are all about confidence.
Even converting a penalty gives forwards the belief that they can regularly find the back of the net.
Shankland would currently pounce at the chance to score from 12 yards to end his poor run of form.
Another critical factor in Shankland’s significant drop in goal contributions is that he’s now underperforming his expected goal total.
Scoring 21 non-penalty goals last season saw the Scottish international outperform his expected goals by 4.38.
This can often be interpreted as proving the forward’s ability to score difficult chances.
However, many will point to it as a sign that the player in question got lucky.
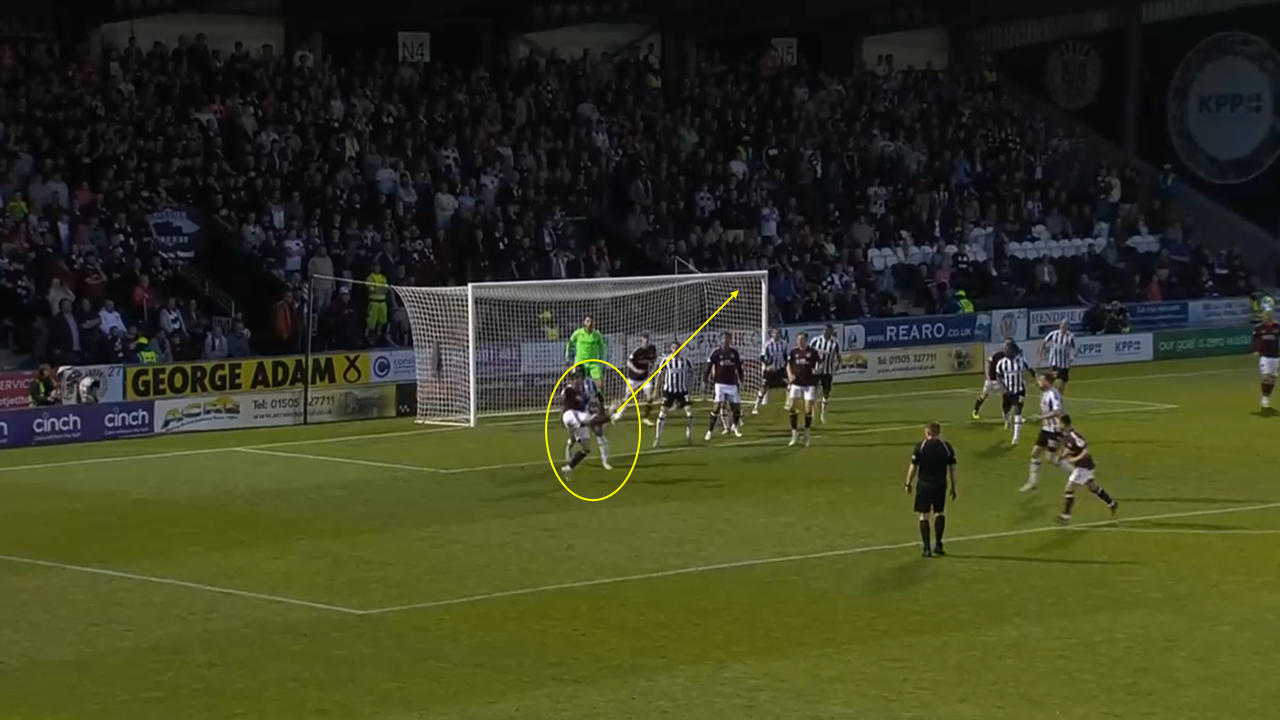
Here, the ball is headed away in a crowded penalty area.
Shankland has his back to goal and scores an audacious variation of an overhead kick.
The angle, technique and crowded penalty area are all factors that make this the most unlikely of goals.
It’s pure brilliance from Shankland, yet it’s rare to convert these types of chances consistently.
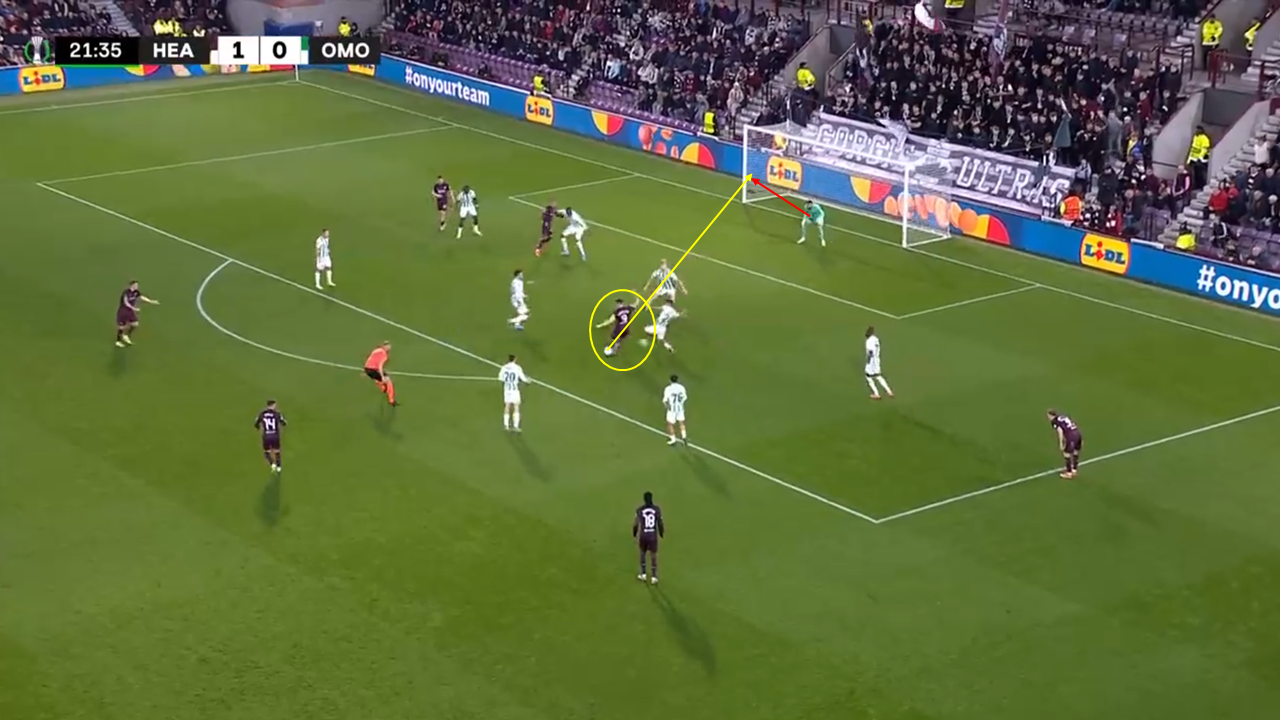
This example from the current season shows Shankland shifting the ball brilliantly onto his left foot.
This gives him the ability to strike the ball cleanly and really test the goalkeeper.
The opposition’s shot-stopper makes a remarkable save, preventing the type of goal that Shankland was scoring last season.
However, despite Shankland suffering from ‘bad luck,’ his underperformance of -3.28 when comparing his goals to expected goals this season shows that he’s not converting chances that he would be expected to.
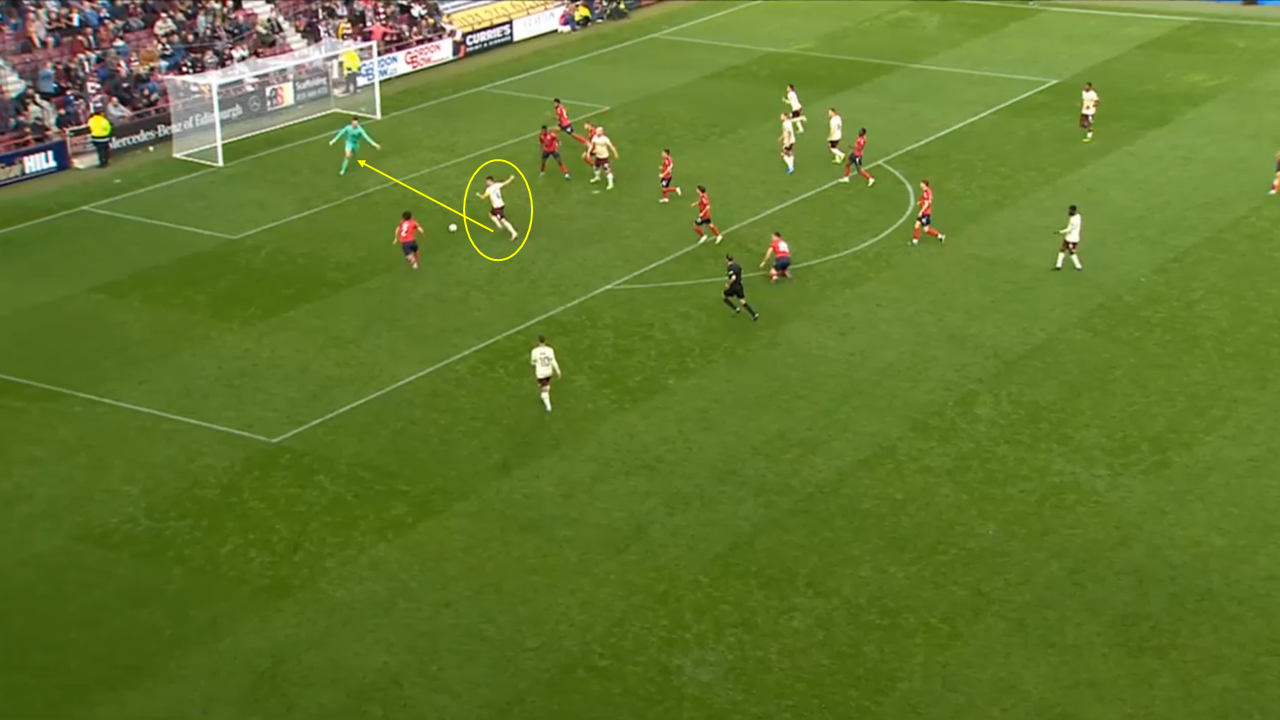
Here’s an example from this season: Shankland has got through on goal and has only the keeper to beat.
The goalkeeper charges out quickly.
Making himself big, he easily saves Shanklands poor attempt to beat him.
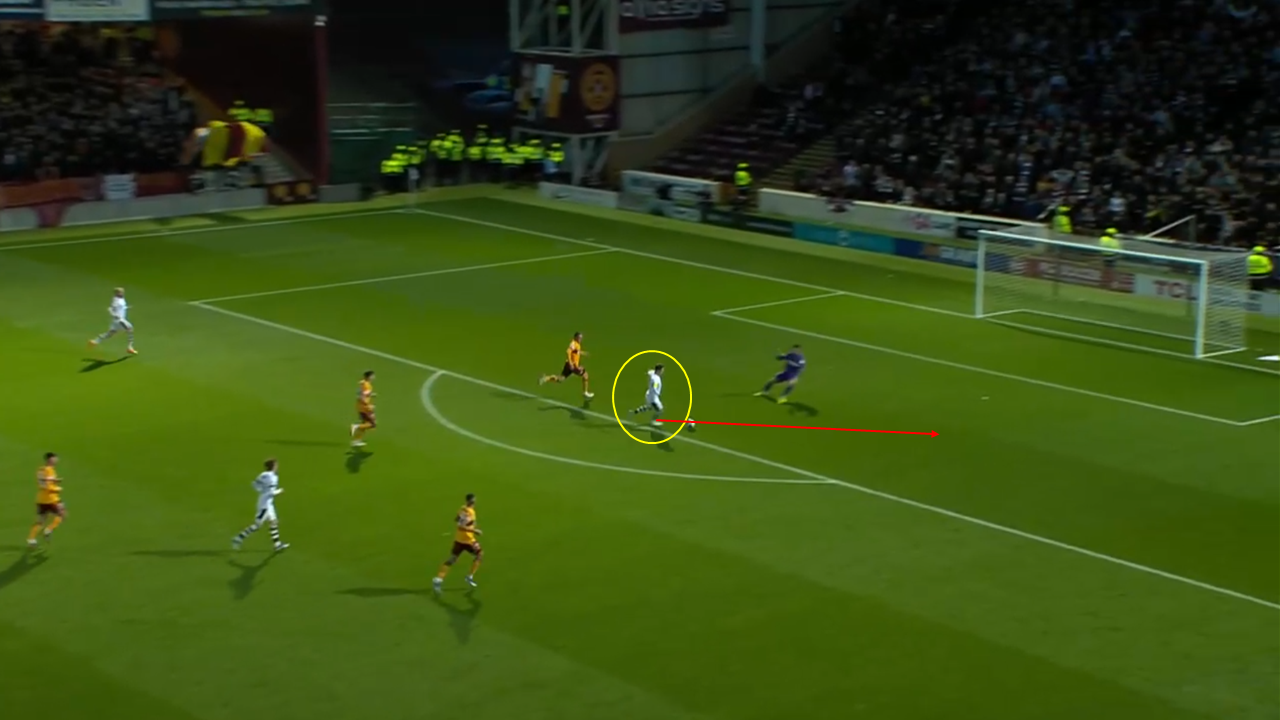
Shankland had many similar situations last season.
He shows real class by rounding the goalkeeper to convert the chance.
This demonstrates how Shankland is failing to score chances for this campaign, which would have been deemed easy for him last term.
Heart’s Underperformance
Last season, Shankland averaged 0.53 xG per 90 minutes, which is higher than his current average of 0.34 xG per 90 minutes.
This underlines that Shankland isn’t having the same quality of chances that he did last season.
Heart’s collective poor performances have undoubtedly been a key reason for Shankland’s failure to refind his form.
Hearts are underperforming in terms of the number of shots they have each match when compared with last season.
They were having an average of 11.55 shots each game last season.
They’re now averaging 10.77 shots per 90.
This isn’t a huge drop-off, and it still puts Hearts third in the league for most shots per 90.
Like Shankland, the Jam Tarts are failing to be as clinical, with only 30.3% of their efforts on targets, as opposed to last season’s figure of 34.8%.
This is all evidence that Hearts are failing to create chances of substantial quality.
When looking closer at their ability to construct chances, Hearts’ creative output has significantly dropped.
Passing metrics such as critical passes per 90 and through balls per 90 have reduced from 2.43 and 5.8 to 2.81 and 3.87, respectively.
Hearts have also failed to make the most of their ability to put crosses into the box.
Hearts have risen from making the seventh-most crosses last season to the most this season.
Despite this seemingly remarkable increase, their accuracy rate is 27.7%, the lowest in the division.
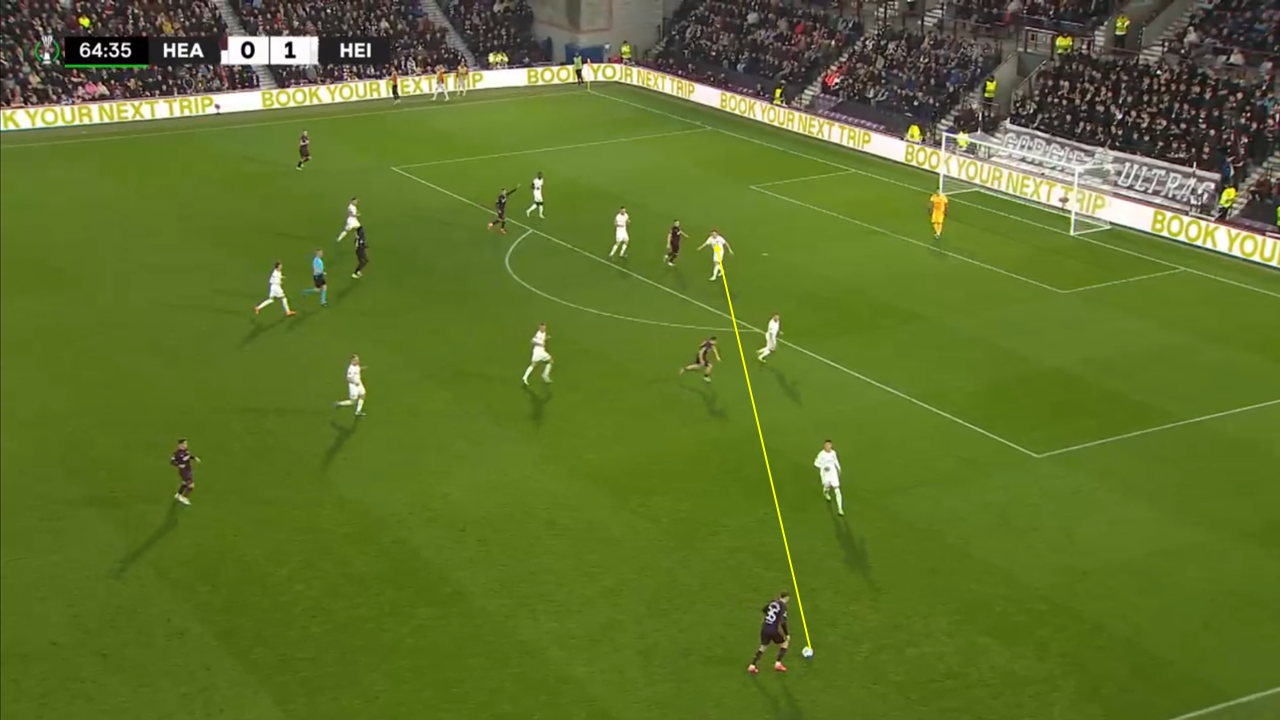
As the ball is out wide, Hearts look to put an early cross into the box.
The problem with putting a cross in from this position is that the opposition’s defence is set, making it easy to defend.
Heart’s forwards are also outnumbered, giving the opposition a numerical advantage.
Hearts & Celtic Crossing Zones Map
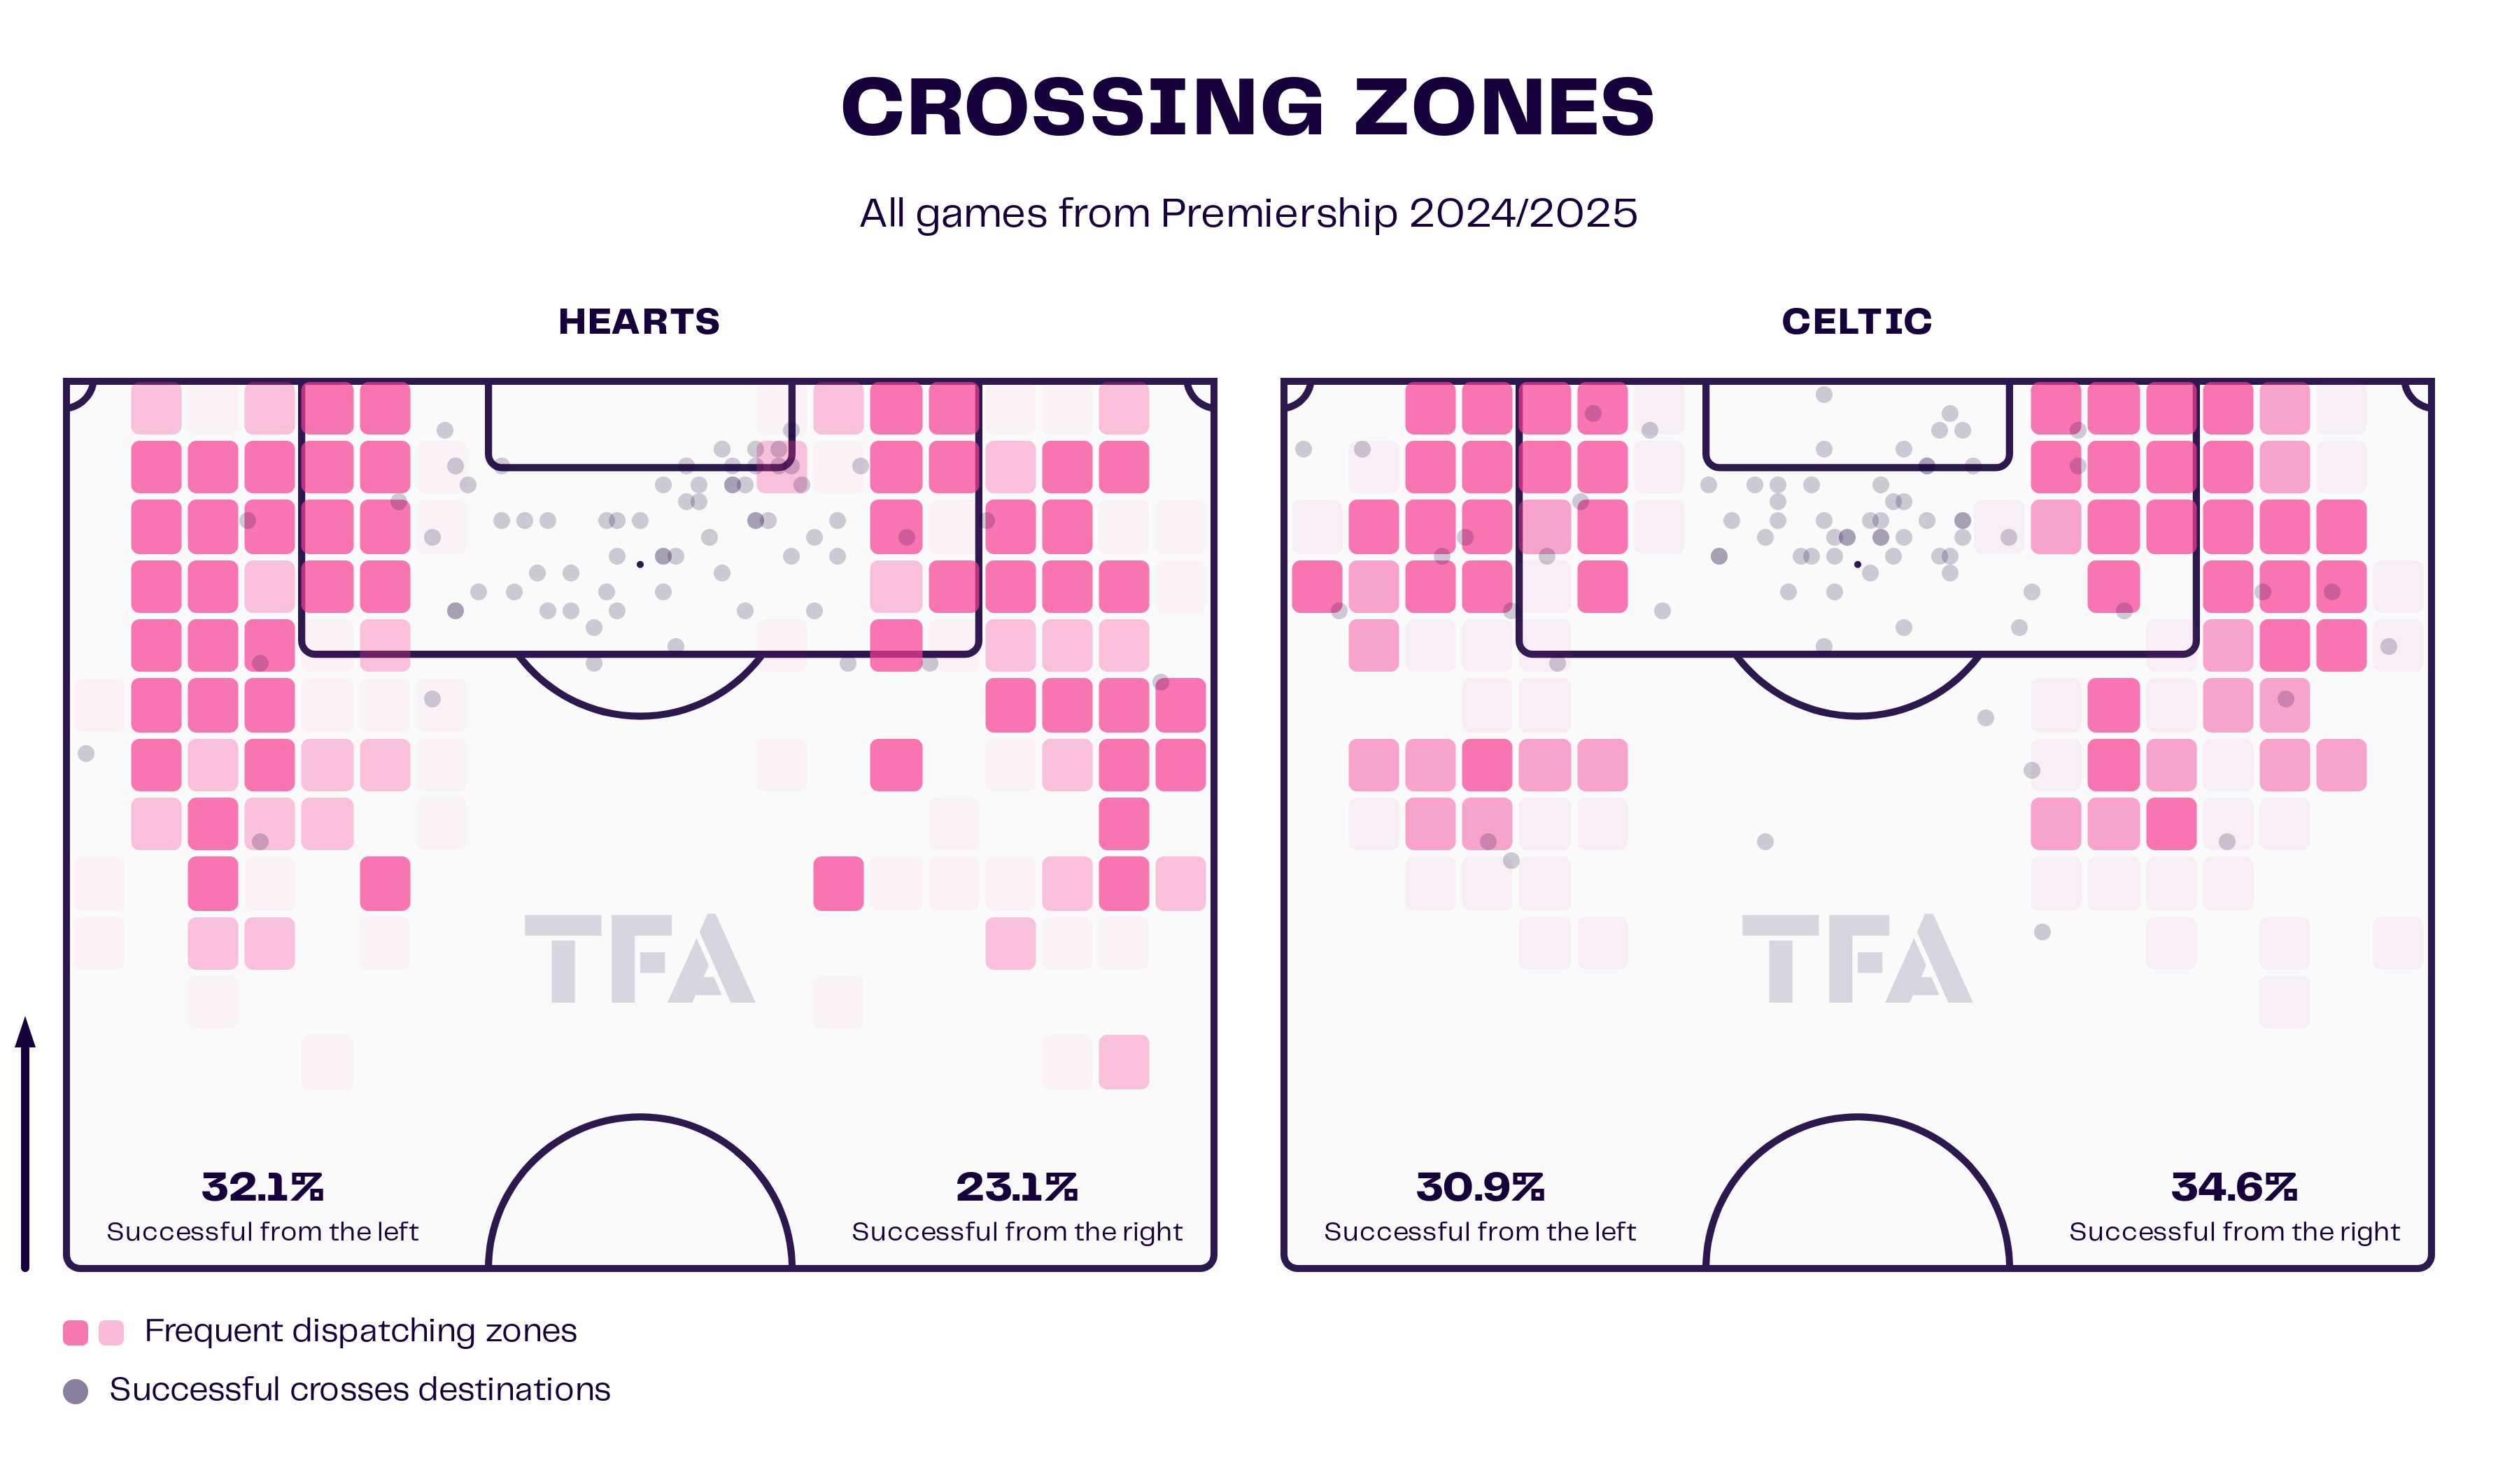
When you compare the areas that Hearts have crossed from this season with Celtic, you can see why they’ve been so unsuccessful in putting balls into the box.
Brendan Rodgers‘ side has significantly more crosses from inside and close to the box but nowhere near as many from deep positions.
This shows the lack of merit in Hearts’ current tactics when it comes to creating quality chances for Shankland and the other forwards.
Lawrence Shankland’s Positioning
Lawrence Shankland’s style of play does have the ability to play behind the striker and is very comfortable dropping deep to receive between the lines.
This season, he’s only played one of his 12 league games as an attacking midfielder.
Despite this, when comparing this season’s heatmaps to last season’s, you can clearly see where he’s been most active.
Lawrence Shankland’s Heatmap
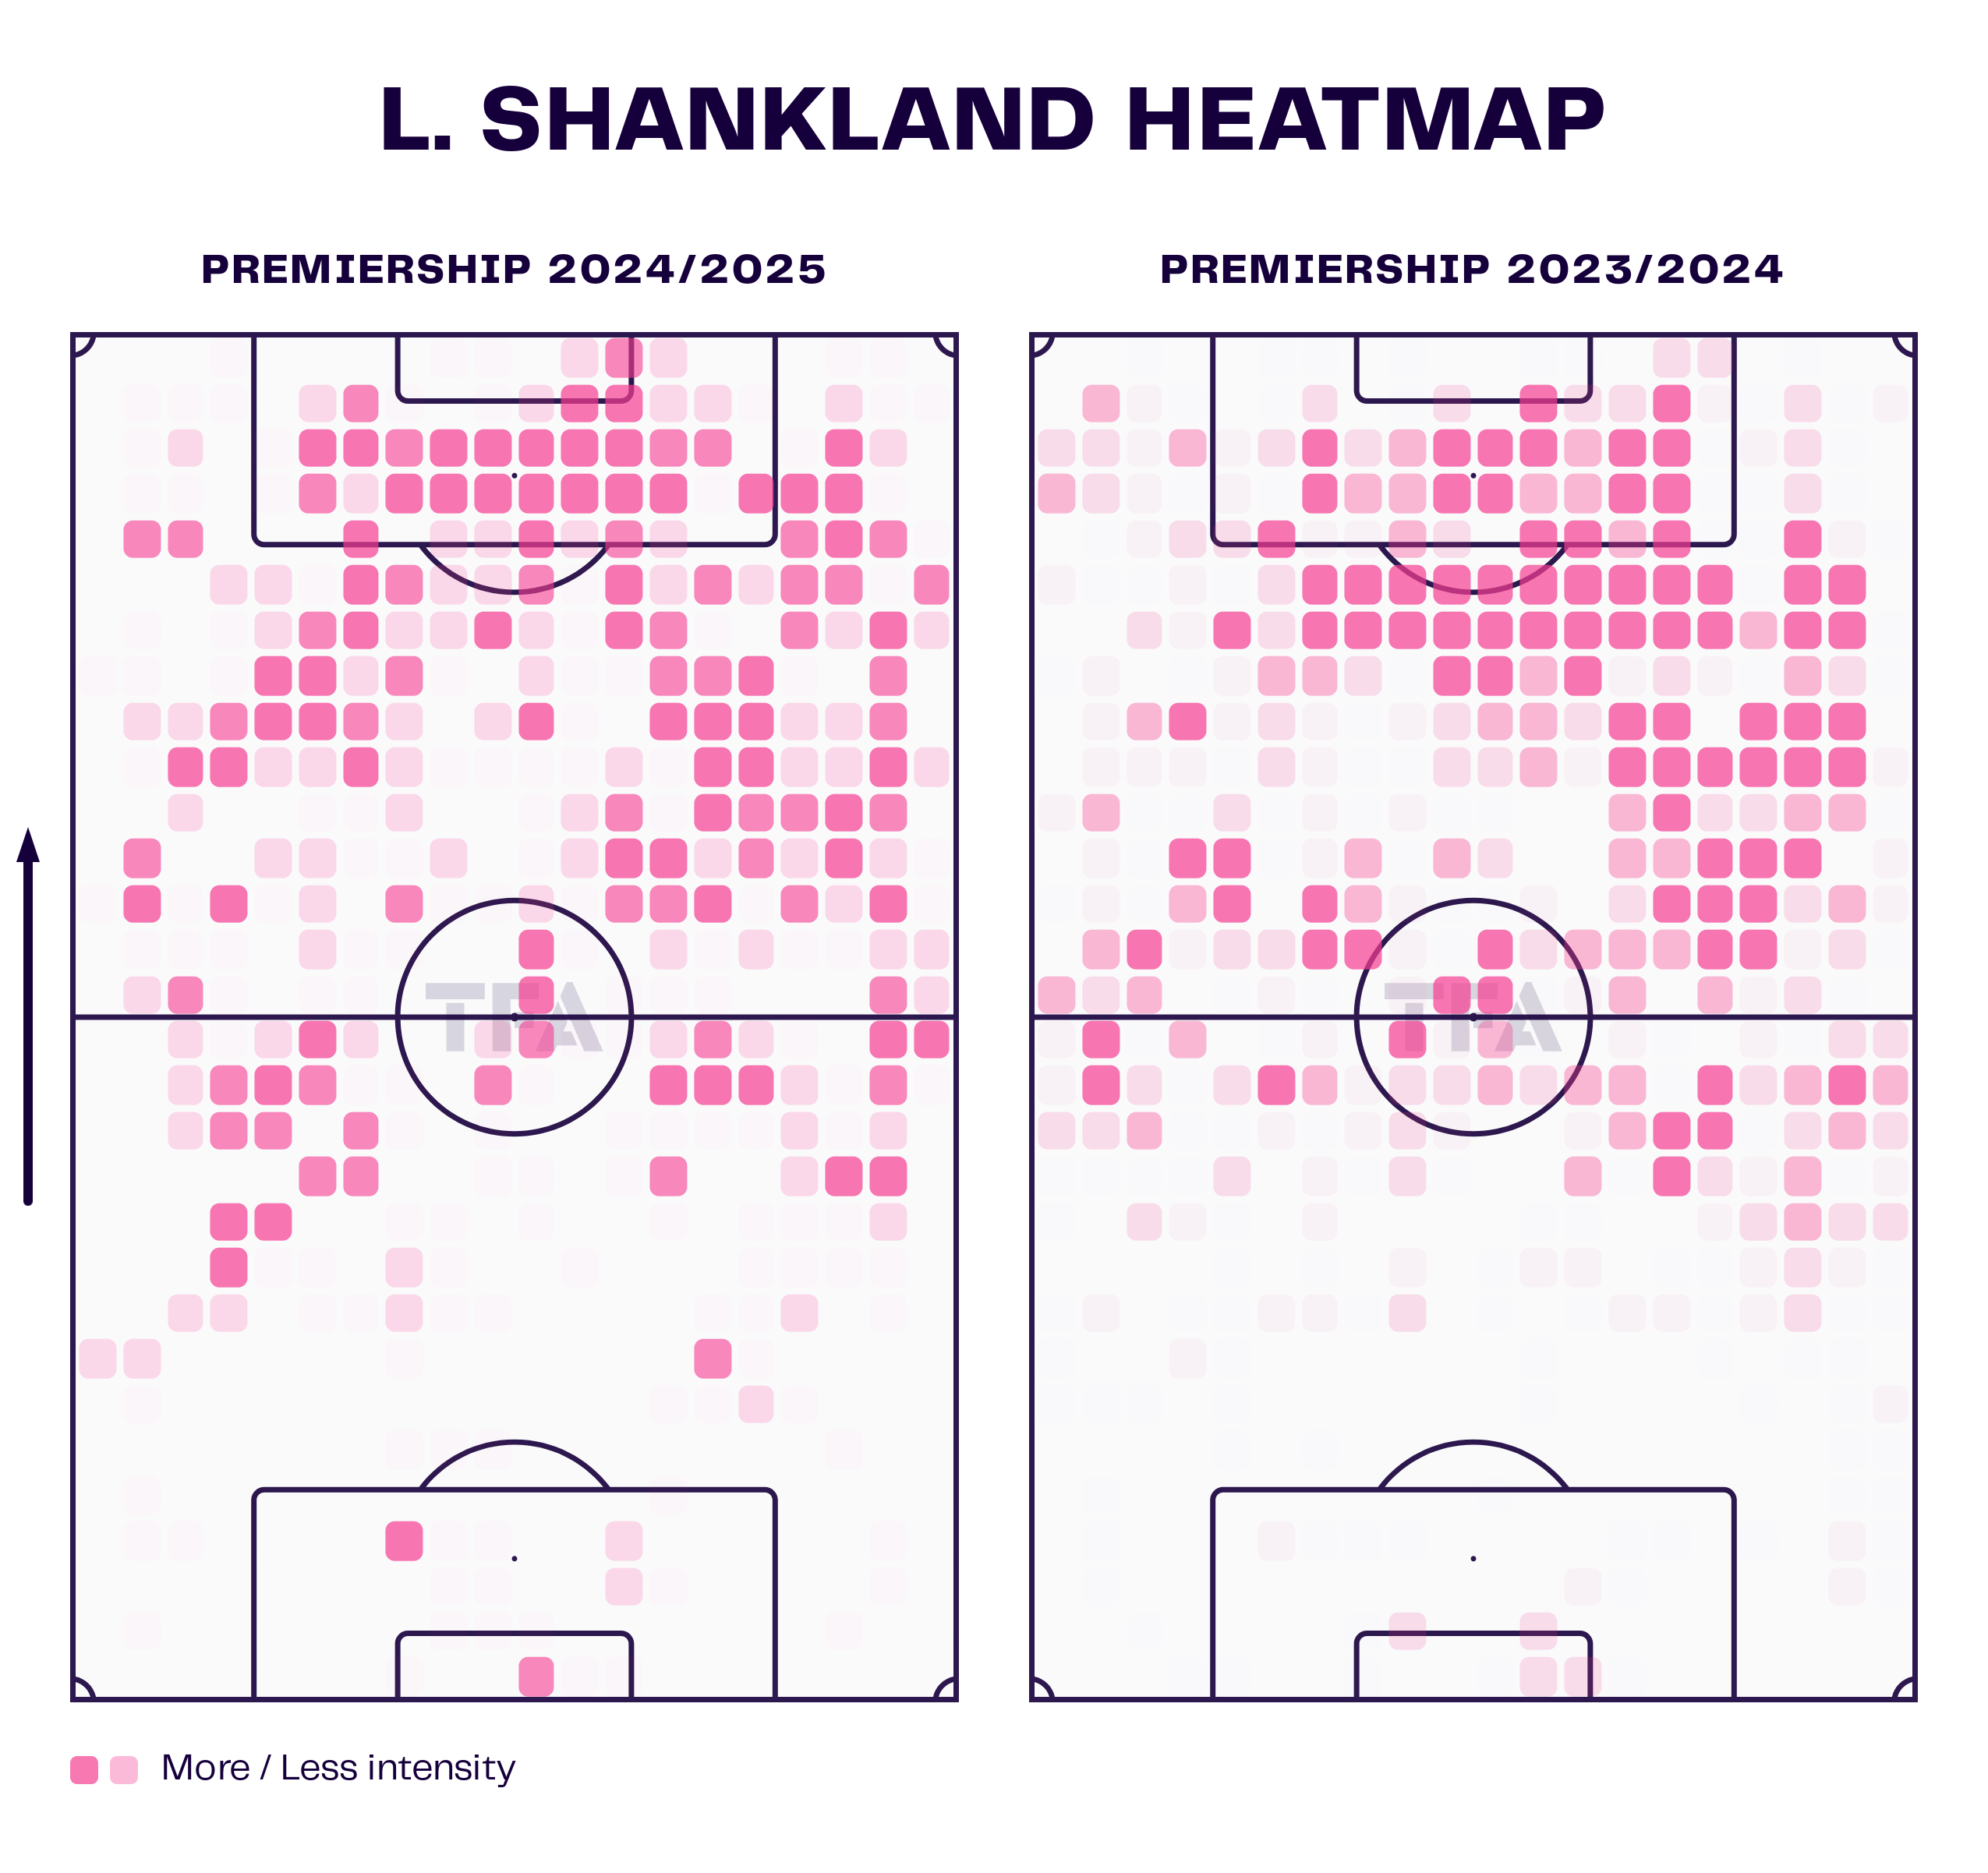
There is an increase in the actions he’s completing in the penalty area, and there’s a notable decline in the number of actions outside the penalty area.
However, where he’s taking his shots from inside the area is significantly different from last season.
Lawrence Shankland’s Shot Map

Again, citing the comparison of the past two seasons’ shot maps, Shankland has had barely any chances in and around the six-yard box, where the majority of goals are scored at all levels.
If Shankland wishes to score more goals, he needs to get into the required areas where he’s more likely to convert chances.
Despite his poor goal-scoring form, he has played an impressive role as a creator.
He has already matched his league tally for assists this season.
Shankland already has three assists and is averaging 0.12 xA per 90, which is far higher than last season’s figure of 0.07 xA per 90.
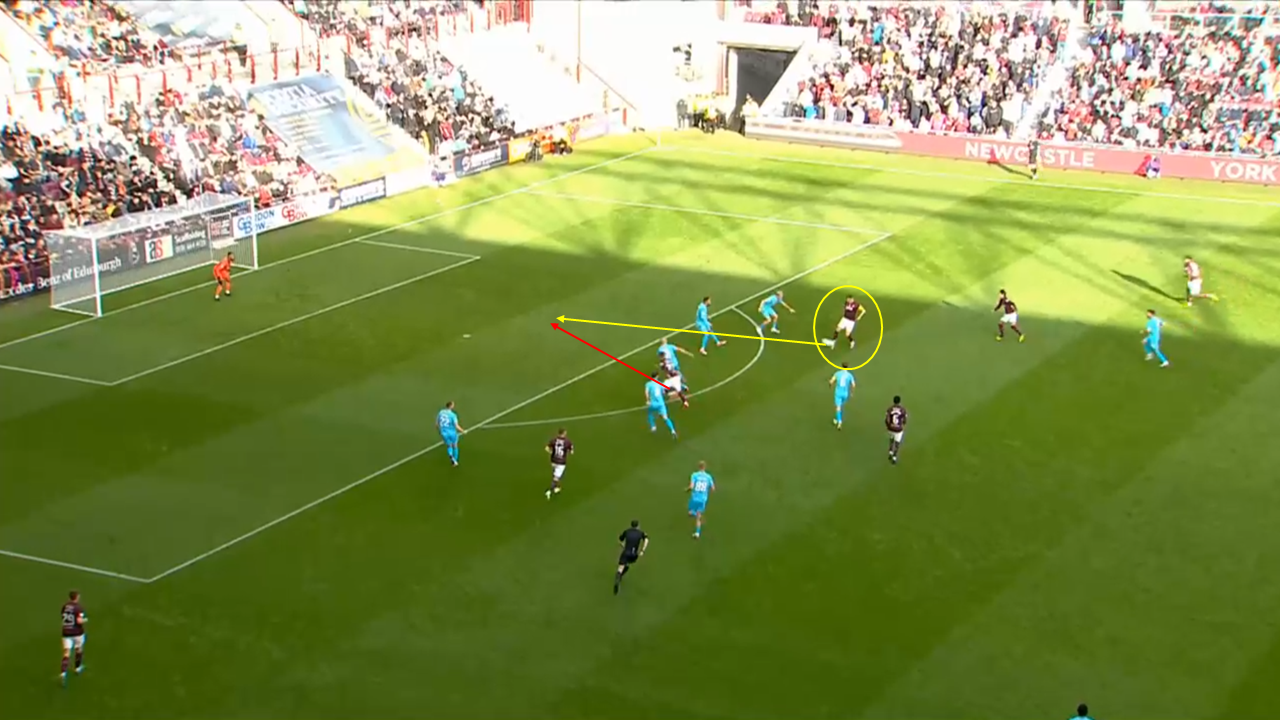
In this situation, the ball is played to Shankland’s feet.
He delicately pokes the ball through to a forward runner who’s able to control the ball in the box and convert the opportunity.
Conclusion
Hearts will be desperate to have their talisman back to his best.
From our tactical analysis and scout report, it’s evident that several reasons, both within and outside Shankland’s control, need to be addressed for his form to change.
He is required to get into better areas and be more clinical when he does so.
New boss Neil Critchley will also be looking to address Hearts’ ability to create chances of substantial quality, with the aim of helping them rise up the table once again.




Comments