Last couple of weeks on our site you could read data analysis on Premier League, Bundesliga, La Liga, Serie A and this week it is about Ligue 1. Similarly to Serie A and Bundesliga lately there was domination by Juventus and Bayern while in France the club that dominated last years was PSG. They are facing great competition from their rivals in Ligue 1 and this season they will have a tough task to get on top based on the current situation.
Going through this analysis we will see how similar are teams from the middle to bottom part of the table while the top six teams on the table are clearly better than the rest. This analysis contains important data and statistics which will give us better insight in the performance of the clubs from Ligue 1.
Performance and expected goals model
The first graph we will analyze consists of created metrics called defensive and offensive performance. Both metrics are in percentage value and they represent the team variance between xG and goals.
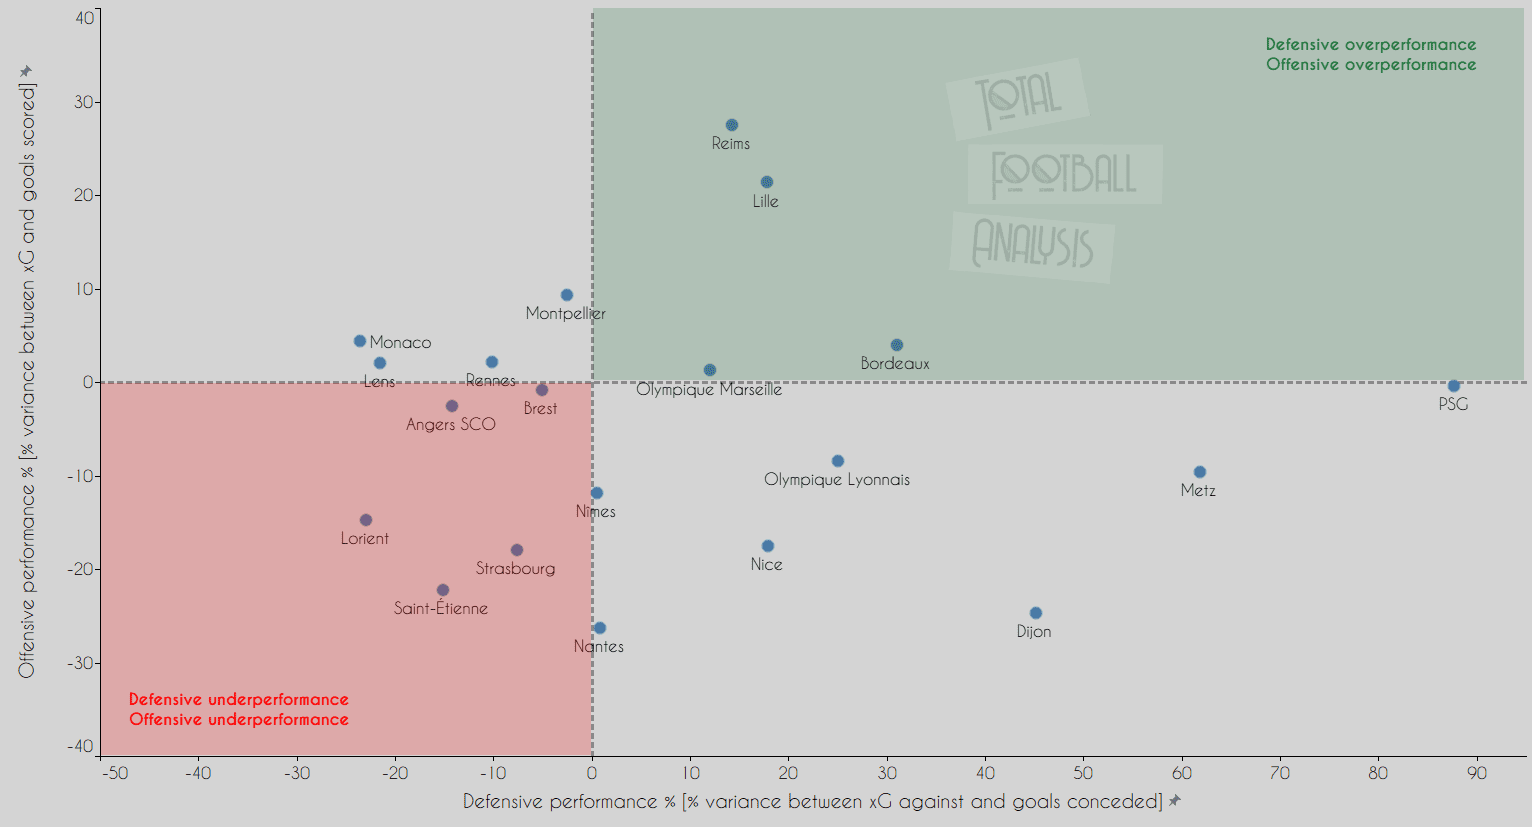
In this graph it is clear how PSG is overperforming in defence by almost 90%. What let them down is their finishing, because with the stars they have in the squad they should be able to overperform their xG because of the quality of their players. League leaders Lille overperform in both directions which is surely one of the reasons why they are on top. They are accompanied by middle table teams Reims, Marseille and Bordeaux. It is a little concerning for Marseille to be in the middle of the table while overperforming their xG and now with Villas-Boas gone they face even more problems. Monaco and Rennes are slightly overperforming offensively while underperforming defensively while Lyon is overperforming defensively and underperforming offensively. Saint-Etienne underperforms in both metrics and they confirm that their last season wasn’t coincidence.
Next graph will show us xG values to see the quality of the team based on the quality of chances created and allowed.
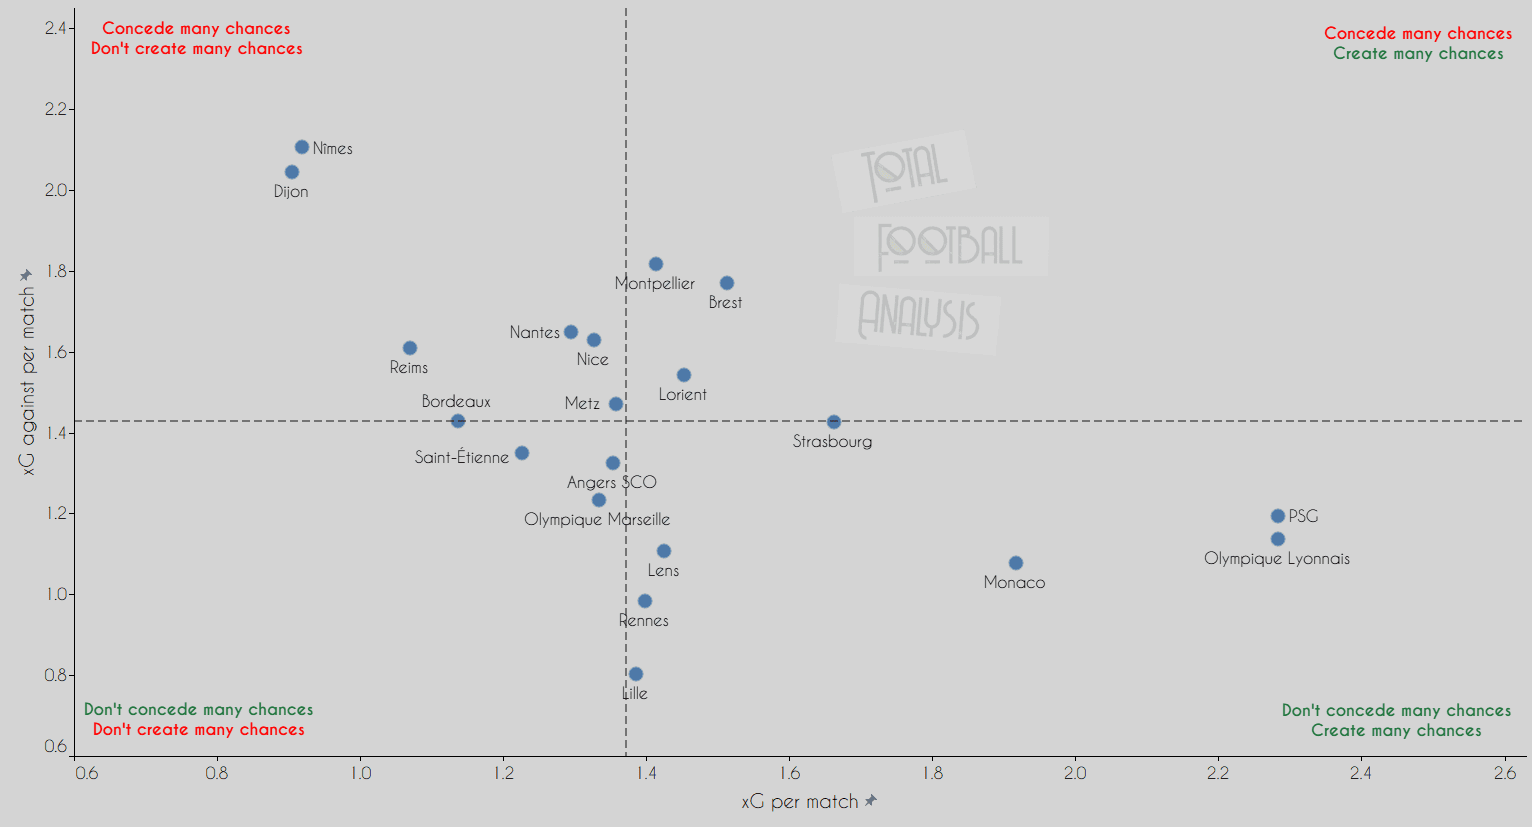
In this graph, we can see that PSG, Lyon and Monaco are clearly better than the rest of the league when it comes to creating chances and getting into promising goalscoring situations. They are fighting for top places with Lille who shows the best defence because they allow the least amount of chances for their opponents based on xG against per 90. Only team who has below one xG against per 90 is Rennes. As we saw on the previous graph PSG is the biggest defensive overperformer and they are the best in conceded goals conceding only 14 goals compared to Lille’s 15 goals which is 2nd best in the league. Last two teams on the table are Nimes and Dijon who are clearly the worst teams in the league, only teams that are creating less than one xG per match and allowing more than two xG against per match. Montpellier and Brest are playing entertaining matches and they allow a lot of high-quality chances for their opponents while also creating an above-average number of chances. On Brest matches there is 3.82 goals on average per match while on Montpellier matches there is 3.35 goals on average per match which is surely exciting for neutral fans to watch.
Attacking
In this section, we will take a detailed look into teams shooting and passing tendencies, while also analysing how dangerous they are in set-pieces. First we will take a look how often teams shoot and what is their average shooting distance.
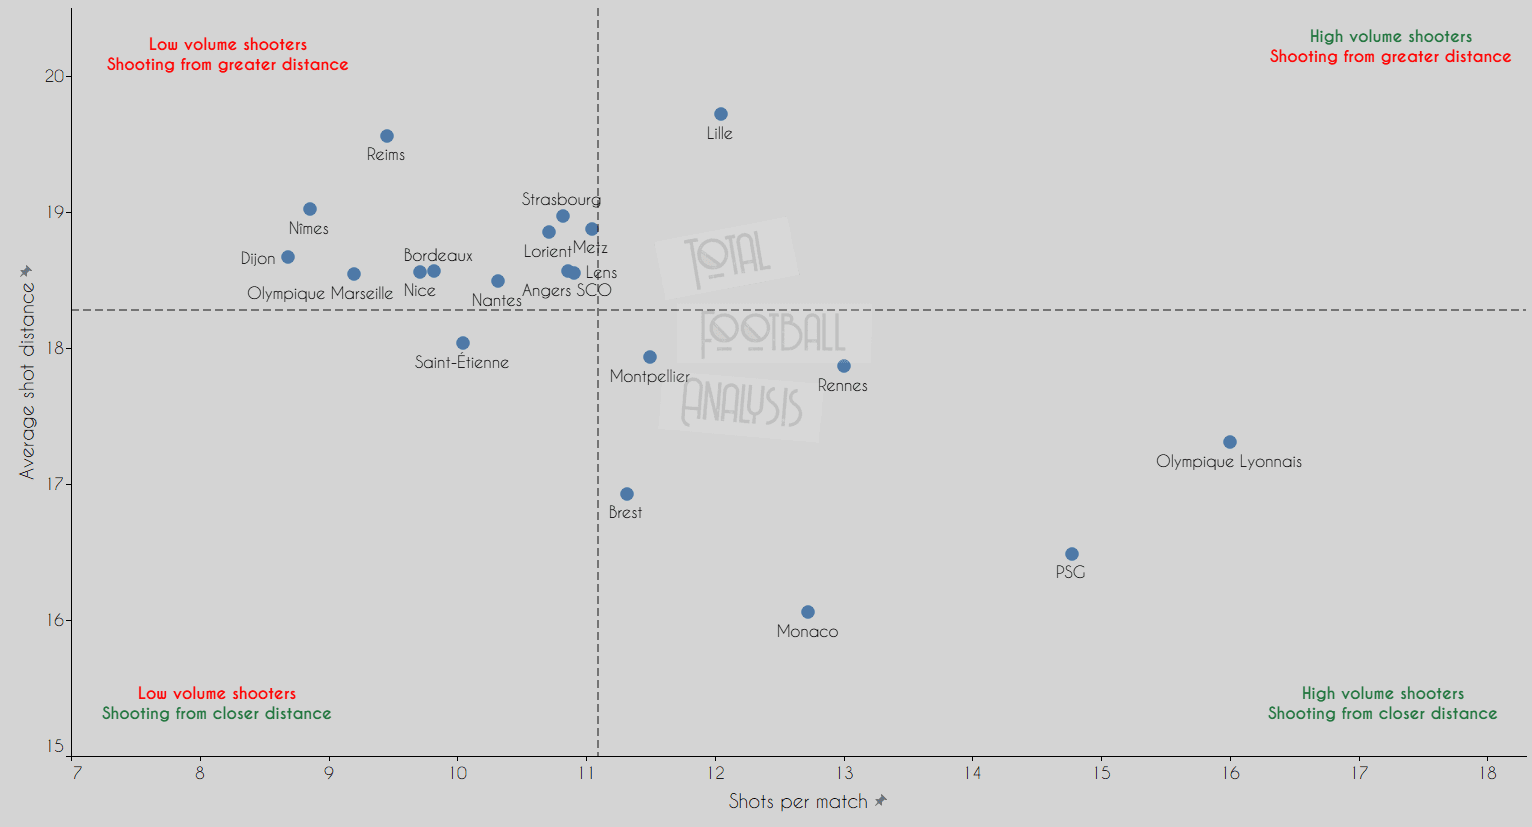
When it comes to shots it is not surprising to see teams like Lyon, PSG and Monaco being one of the frequent shooting teams in the league. Monaco and PSG shoot from the closest distance compared to the others. League leaders Lille show why they are overperforming in the attack because they are the team that shoots from biggest average distance in the league which is impressive given their efficiency, but also concerning in the long-term. Because of the big separation from Lyon, PSG, Monaco and Rennes there are 12 teams that are below average in both metrics. It is concerning for those teams that they shoot less than 11 times per match and from a greater distance than 18 metres. It could be said that apart from the top half teams’ others don’t create enough to shoot from closer distance or they are just not patient enough and attempt shots from long-range distances.
On the next graph we will evaluate the passing tendencies of Ligue 1 teams. It will show us which teams are more direct and which teams tend to play more positional football. Size of the circle represents the average possession in %.
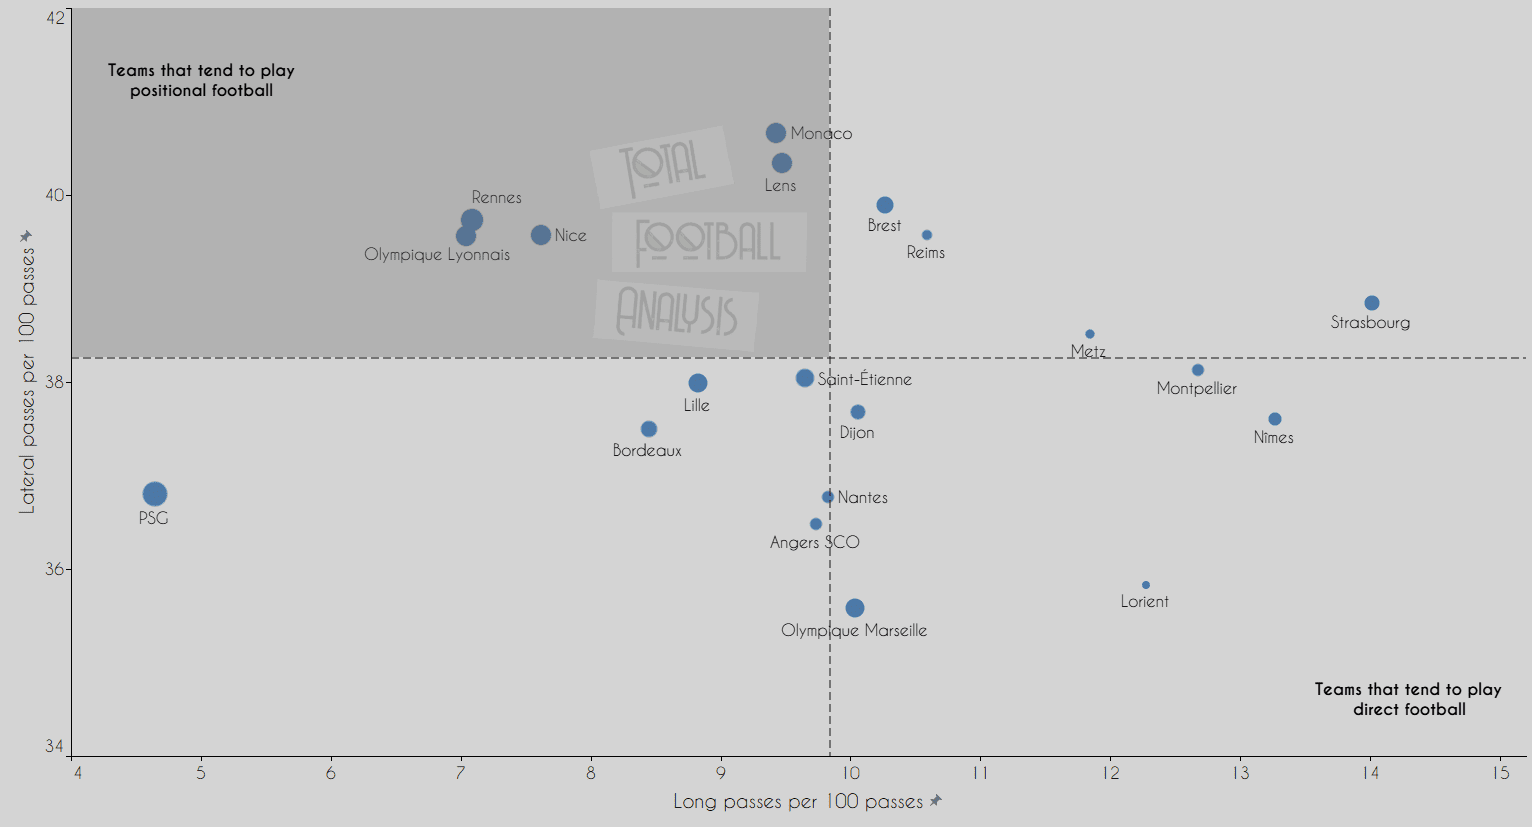
In this graph we can see that PSG is having high possession, but they are not playing too many lateral passes and they try to be more progressive with the ball with a tendency to attack opponents without giving them too much time to prepare for their attack. Lyon, Rennes and Nice look like the teams that tend to be more positional and patient with the ball when in possession, while Monaco and Lens are in that group as well with slight tendency to attempt more long passes. Lorient is clearly the most direct team with lowest average ball possession in the league. Marseille seems like the most impatient team in the league with the lowest tendency to play laterally.
The last graph in this section will show us how dangerous are teams in the set-pieces.
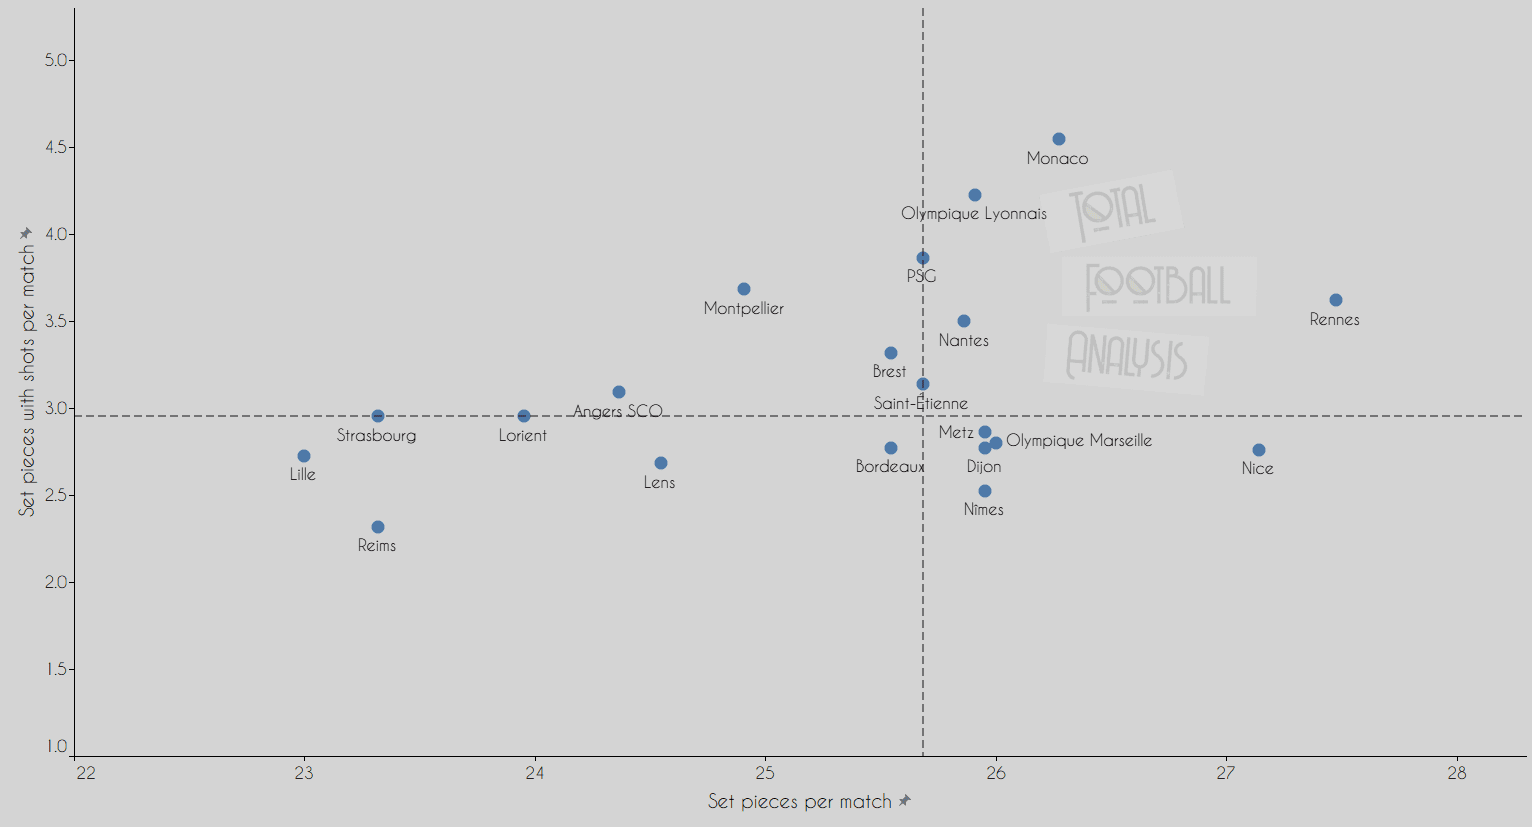
What we can see on this graph is that Monaco and Lyon are the most dangerous teams in the league when it comes to set-pieces. Both teams are shooting more than four times per match after set-pieces with around 26 set-pieces per match. Monaco scored an impressive 15 goals on set pieces which is almost double than Rennes who scored 8 goals on set-pieces. Lille average the smallest amount of set-pieces per match and they are below average in shots after set-pieces per match.
Even though PSG is right behind Monaco and Lyon based on shots after set-pieces, they scored only two goals on set-pieces and only Nimes scored less with one goal on set-pieces. Getting goals on set-pieces could be crucial for PSG in the rest of the season in their battle for the title.
In this section we saw pretty strong numbers by Lyon, PSG and Monaco who all show they are an attacking force in the league.
Defending
In the last section, we will take a look into teams success in duels and also their tendency to press higher and actively trying to regain possession. The graph below shows how successful are teams in defensive duels and aerial duels in percentage.
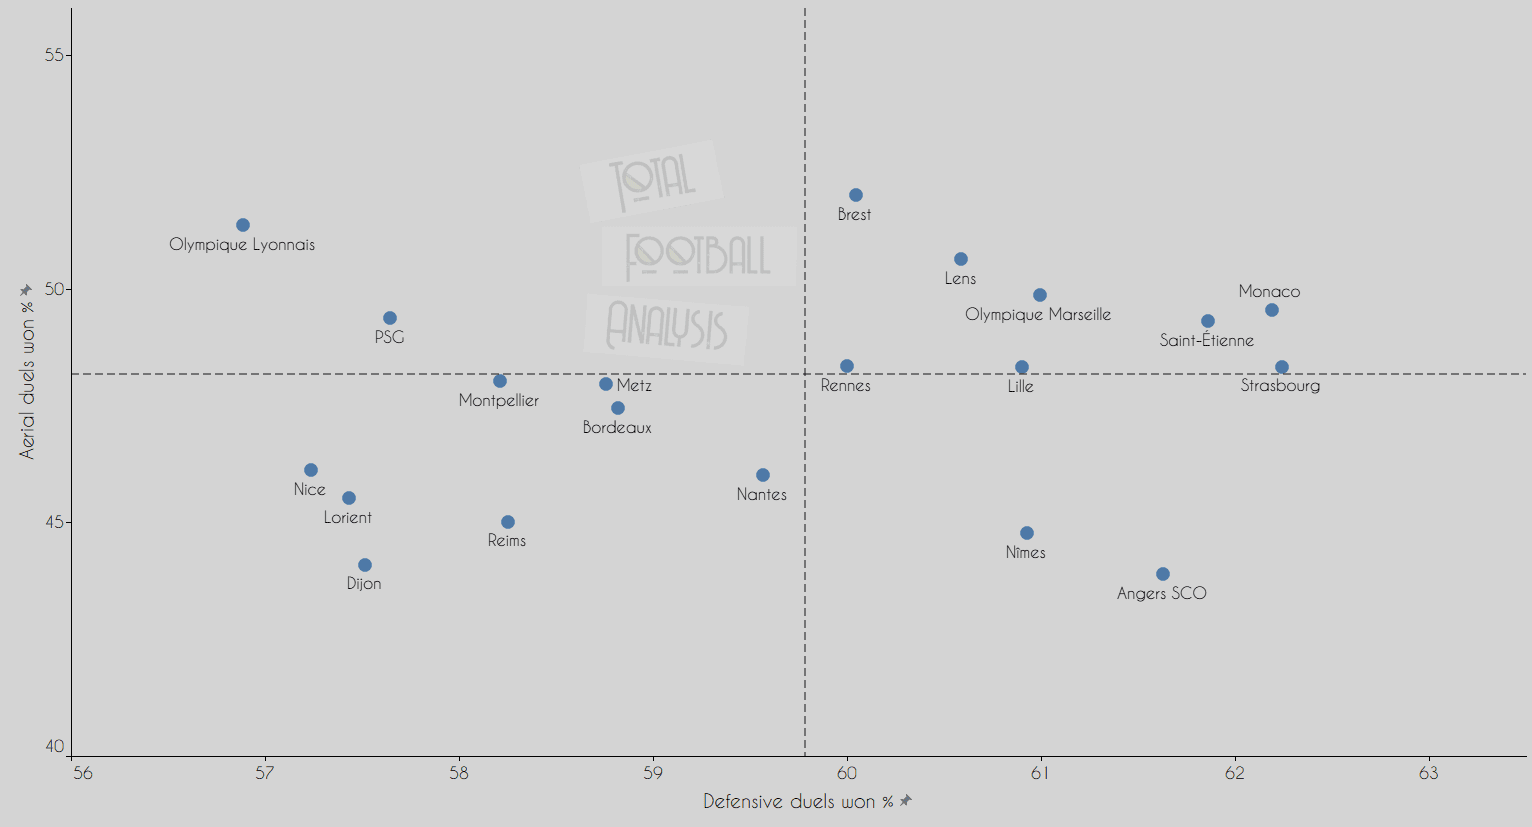
On this graph we can see that Lyon and PSG are the only teams who are below average in defensive duels success rate and above average in aerial duels success rate. It is interesting that Lyon is the least successful team in defensive duels won % while being 2nd best in aerial duels won %. Monaco and Lille are above average in both metrics accompanied by Strasbourg, Saint-Etienne, Marseille, Lens, Brest and Rennes. We can see that on this graph there is no pattern based on league position like it was the case for most of the attacking-oriented graphs which shows that the main difference in the league is in the offensive quality between the clubs.
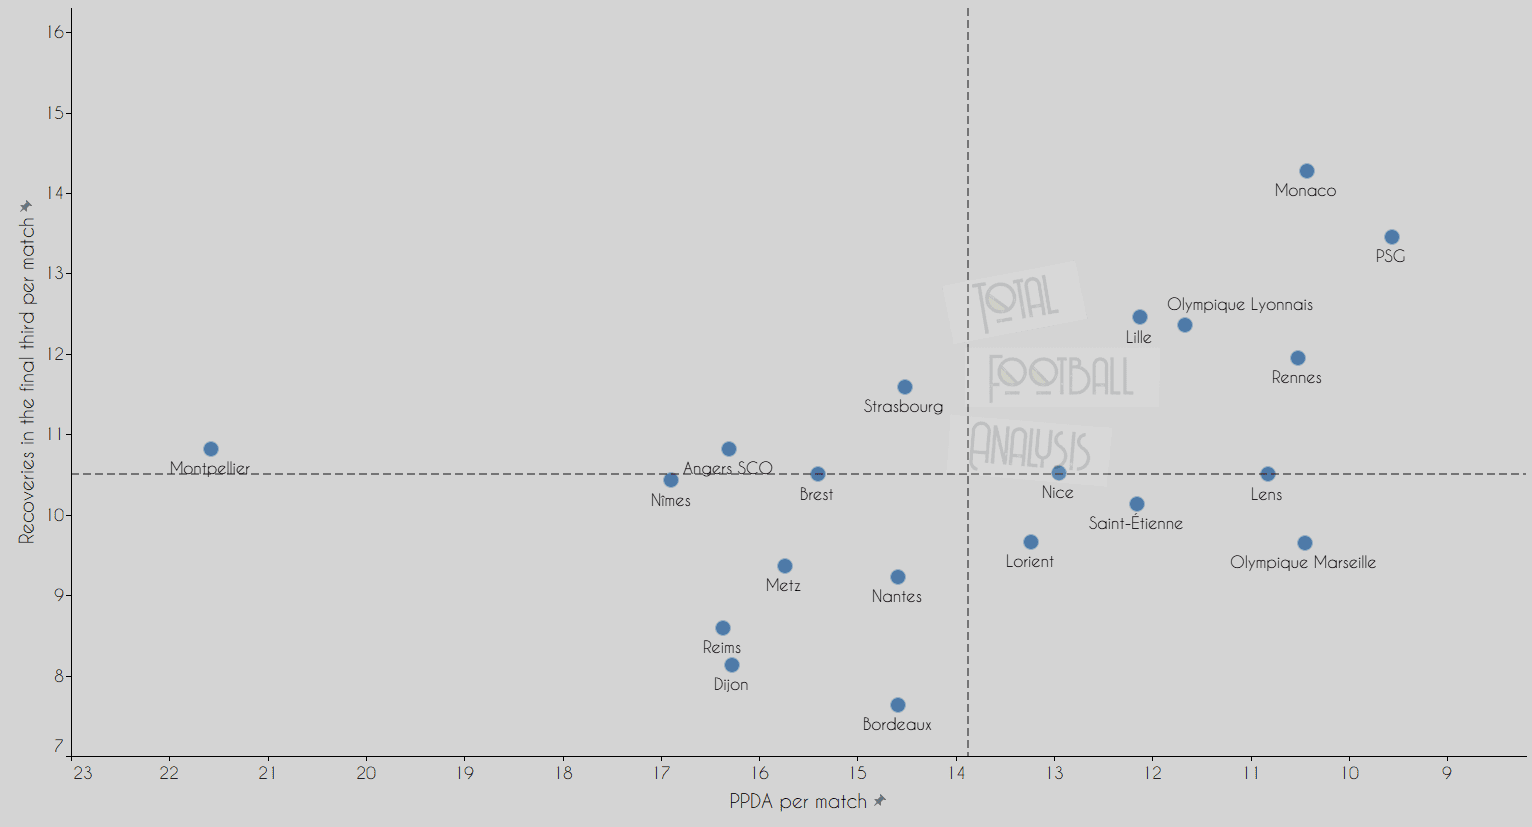
In this graph we can see teams PPDA per match(passes allowed per defensive action) and recoveries in the final third per match. Top five teams on the table are the teams that made the most recoveries in the final third per match and they are allowing less than 12 passes per defensive action. PSG is averaging lowest PPDA meaning they are often trying to regain possession quickly, while Monaco is the best team in the high pressing averaging more than 14 recoveries in the final third per match. Montpellier is the team that doesn’t bother too much to regain possession quickly, but they still manage to make an above-average number of recoveries in the final third. Bordeaux is the worst compared to the rest of the league when it comes to recoveries in the final third per match.
Based on the defensive metrics we can conclude that Monaco and Lille qualities stand out because they are above average in both graphs.
Conclusion
Lille defensive qualities are on a high level and it is the biggest reason they are on the top, along with overperformance in the attack. It would be harsh to conclude that they are lucky to be on top because they showed constant performances which could be decisive if they are able to keep it on that level. Monaco and Lyon shouldn’t be ignored as well given their strong performances lately, especially Monaco who is unbeaten in the last eight league matches with seven wins and one draw. Nimes and Dijon performances indicate that they are on their way to Ligue 2 showing abysmal numbers both defensively and offensively, which is hard to overcome. It is a little concerning for the quality of the league to see such difference in offensive quality between 6-7 teams and the rest of the league. However, battle at the top will bring us an exciting few months in the Ligue 1 and it will be interesting to see can Pochettino bring the best from PSG squad in their push for another title.



Comments