If you’re a Liverpool fan, you’ll be bitterly disappointed with how your team have started the 2022/23 Premier League season. After 14 matches played, the reds sit in 6th place, 7 points outside of the top four and 15 points behind leaders Arsenal. Kopites are in unison in hoping for a turnaround after the FIFA World Cup, with the tournament providing a lengthy break for all Premier League clubs.
While Manchester City were odds-on favourites for the title before the signing of goal machine Erling Haaland, the Norwegian’s arrival cemented City’s status as title favourites, and not many thought they could be stopped this season. As ambitious as Liverpool and their fans are, this was a massive task. But then again, who would’ve predicted that Arsenal would be top of the league on Christmas day?! Regardless, Liverpool are nowhere near either of those two teams but have provided evidence that suggests that they’re still on course to finish in the top four and qualify for the UEFA Champions League.
But why are they finding this season so difficult? Is it a lack of squad depth in certain areas? Is it the departure of Sadio Mane? Is it a tactical downfall? It’s tough to say on face value as we don’t know which Liverpool will show up week in, week out. Will we see the Liverpool that lost to the likes of Nottingham Forest and Leeds United? Or the team that beat Bournemouth 9-0? Consistency is clearly an issue for Jürgen Klopp’s side.
This data analysis will look to provide some clarity as to why they’ve been poor so far, using statistics to see where they need to improve and where they are successful. This will be done alongside an analysis of Liverpool’s data from the previous three seasons which goes all the way back to their Premier League triumph in 2019/20. The aim here is to see if there is any statistical outlier that points to Liverpool’s poor 22/23 season so far. All data used is from Liverpool’s opening 14 Premier League fixtures from each of the previous three seasons, and the current one.
Seasons overview
Before diving into the data analysis itself, it is important to understand where Liverpool were in the league after 14 games (the number of games played in the current season at the time of writing) as it will provide some context to look back on throughout the rest of this report.
2019/20: This is the one. The season that reds fans had been waiting for, for 30 long years. The season that finally delivered the Premier League title to Anfield. It was a strange season, with a large portion of the games being played behind closed doors due to the Coronavirus outbreak. After 14 games, they were top of the pile with 40 points, clear by a healthy eight points, with a goal difference of +20.
2020/21: Repeating the success of the previous season was always a tough challenge, but Liverpool started the season nicely. With a goal difference of +31 already, they were in the title race at this point — in third place with 31 points, just two off the top spot.
2021/22: The reds impressed again last season. Reaching the final of the UCL, winning both the FA Cup and the League Cup, they also came a close second in the league, second only to Manchester City. After 14 games they had the same points tally as the season before, but this time they found themselves top, with a goal difference of +17.
2022/23: Which brings us to the here and now. It doesn’t make for pretty reading unless you support Everton or Manchester United (or if you just don’t like Liverpool). 22 points for the reds leaves them in 6th place going into the World Cup break, with a goal difference of +11.
In possession and attack
An area of Klopp’s team that few have been able to get close to replicating and that many have been afraid to face, Liverpool’s attack has always been ferocious during the current manager’s reign. As time went on, their approach play and general performance was fine-tuned, tactically speaking, but they never lost that attacking spark. This segment provides an analysis of their attacking performance this season and the three previous.
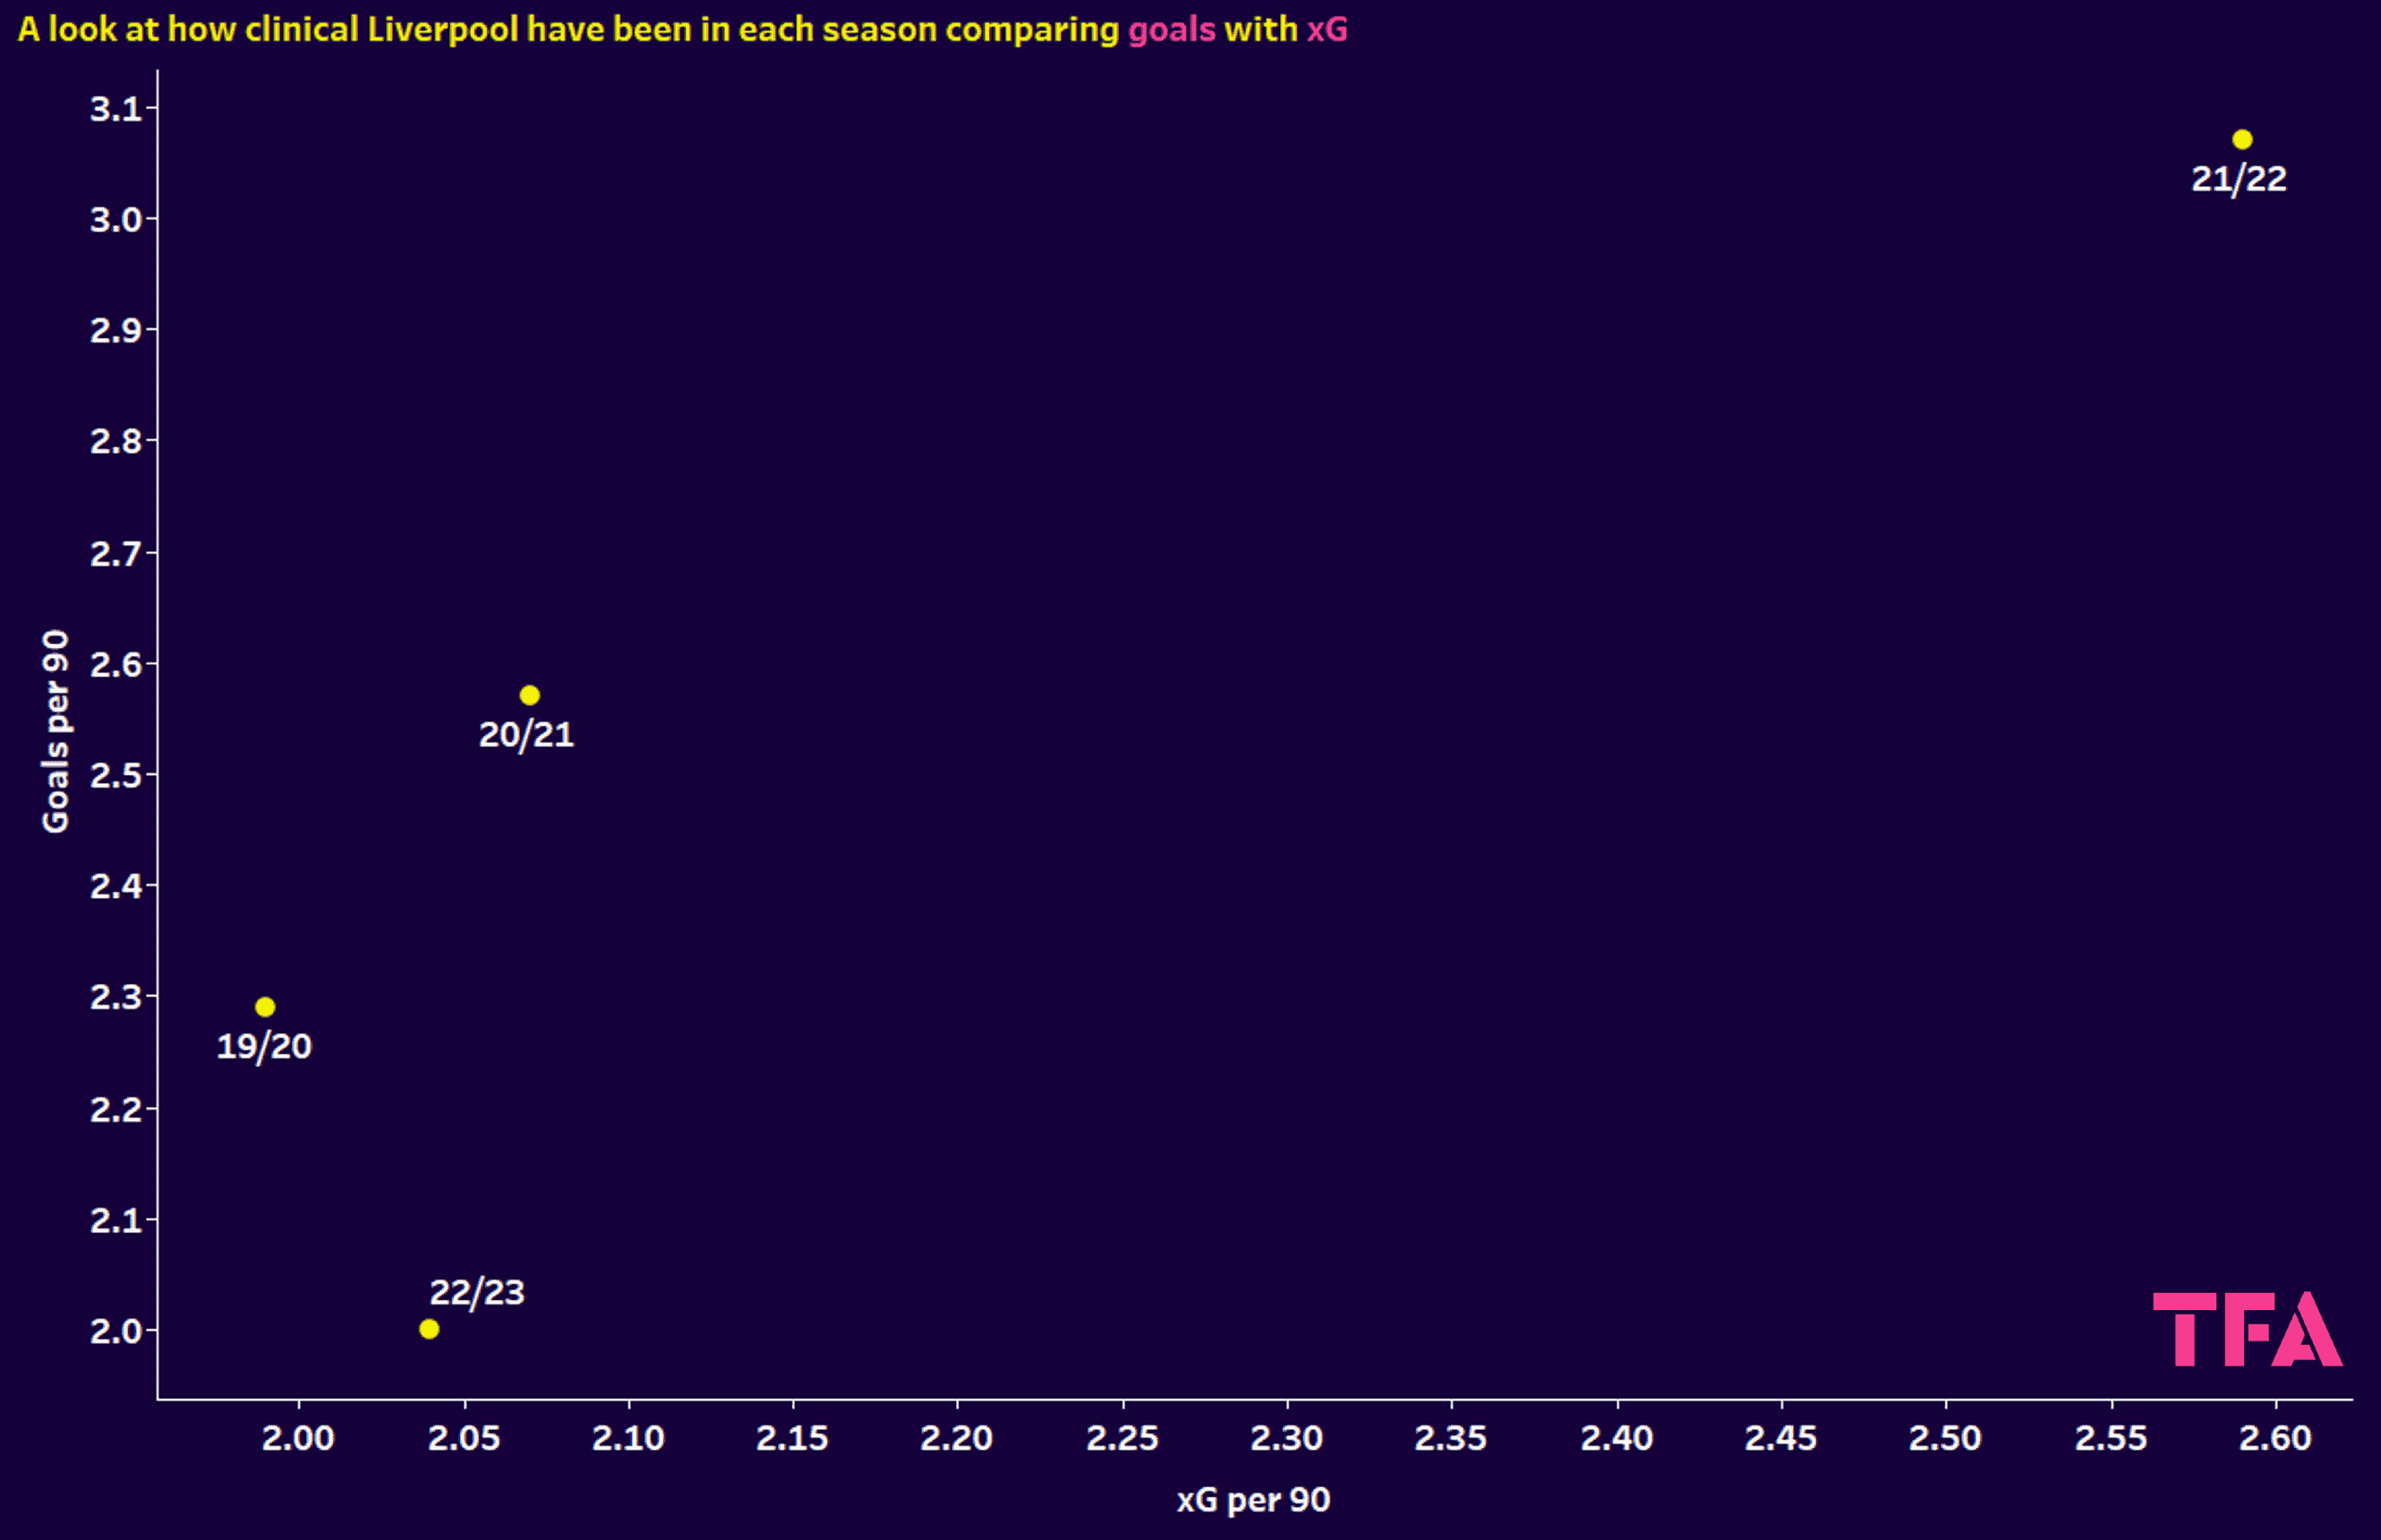
We begin by jumping straight into the business end of attack: goals. This season, Liverpool have had mixed fortunes in front of goal from week to week, recording 28 goals so far — which happens to be the highest tally outside of the top four. Drilling further, we can see that they tend to score fewer goals than they did in any of the previous three campaigns. They average two goals per 90 minutes currently, which in itself isn’t really a poor statistic, but by Liverpool’s standards, they have been far better.
Their xG this season is also lower than the previous two seasons, but interestingly, it is higher than their title-winning season. According to the data, they were monstrous in front of goal last season at this point in the season, so expecting a repeat of that would be unfair, but they will look to build on their current xG average of 2.04.

Moving on to their rates of possession now. The purpose of this statistic is to provide more context rather than a direct assessment, as higher possession does not necessarily result in better performances. That is evidenced by both this season, which averages 60.8% (the joint-highest of the four seasons), and their title-winning season (the lowest of the four seasons) in which they averaged 58.98% possession. So, these findings rule out any notion that they aren’t controlling games in terms of possession, their downfall lies elsewhere.
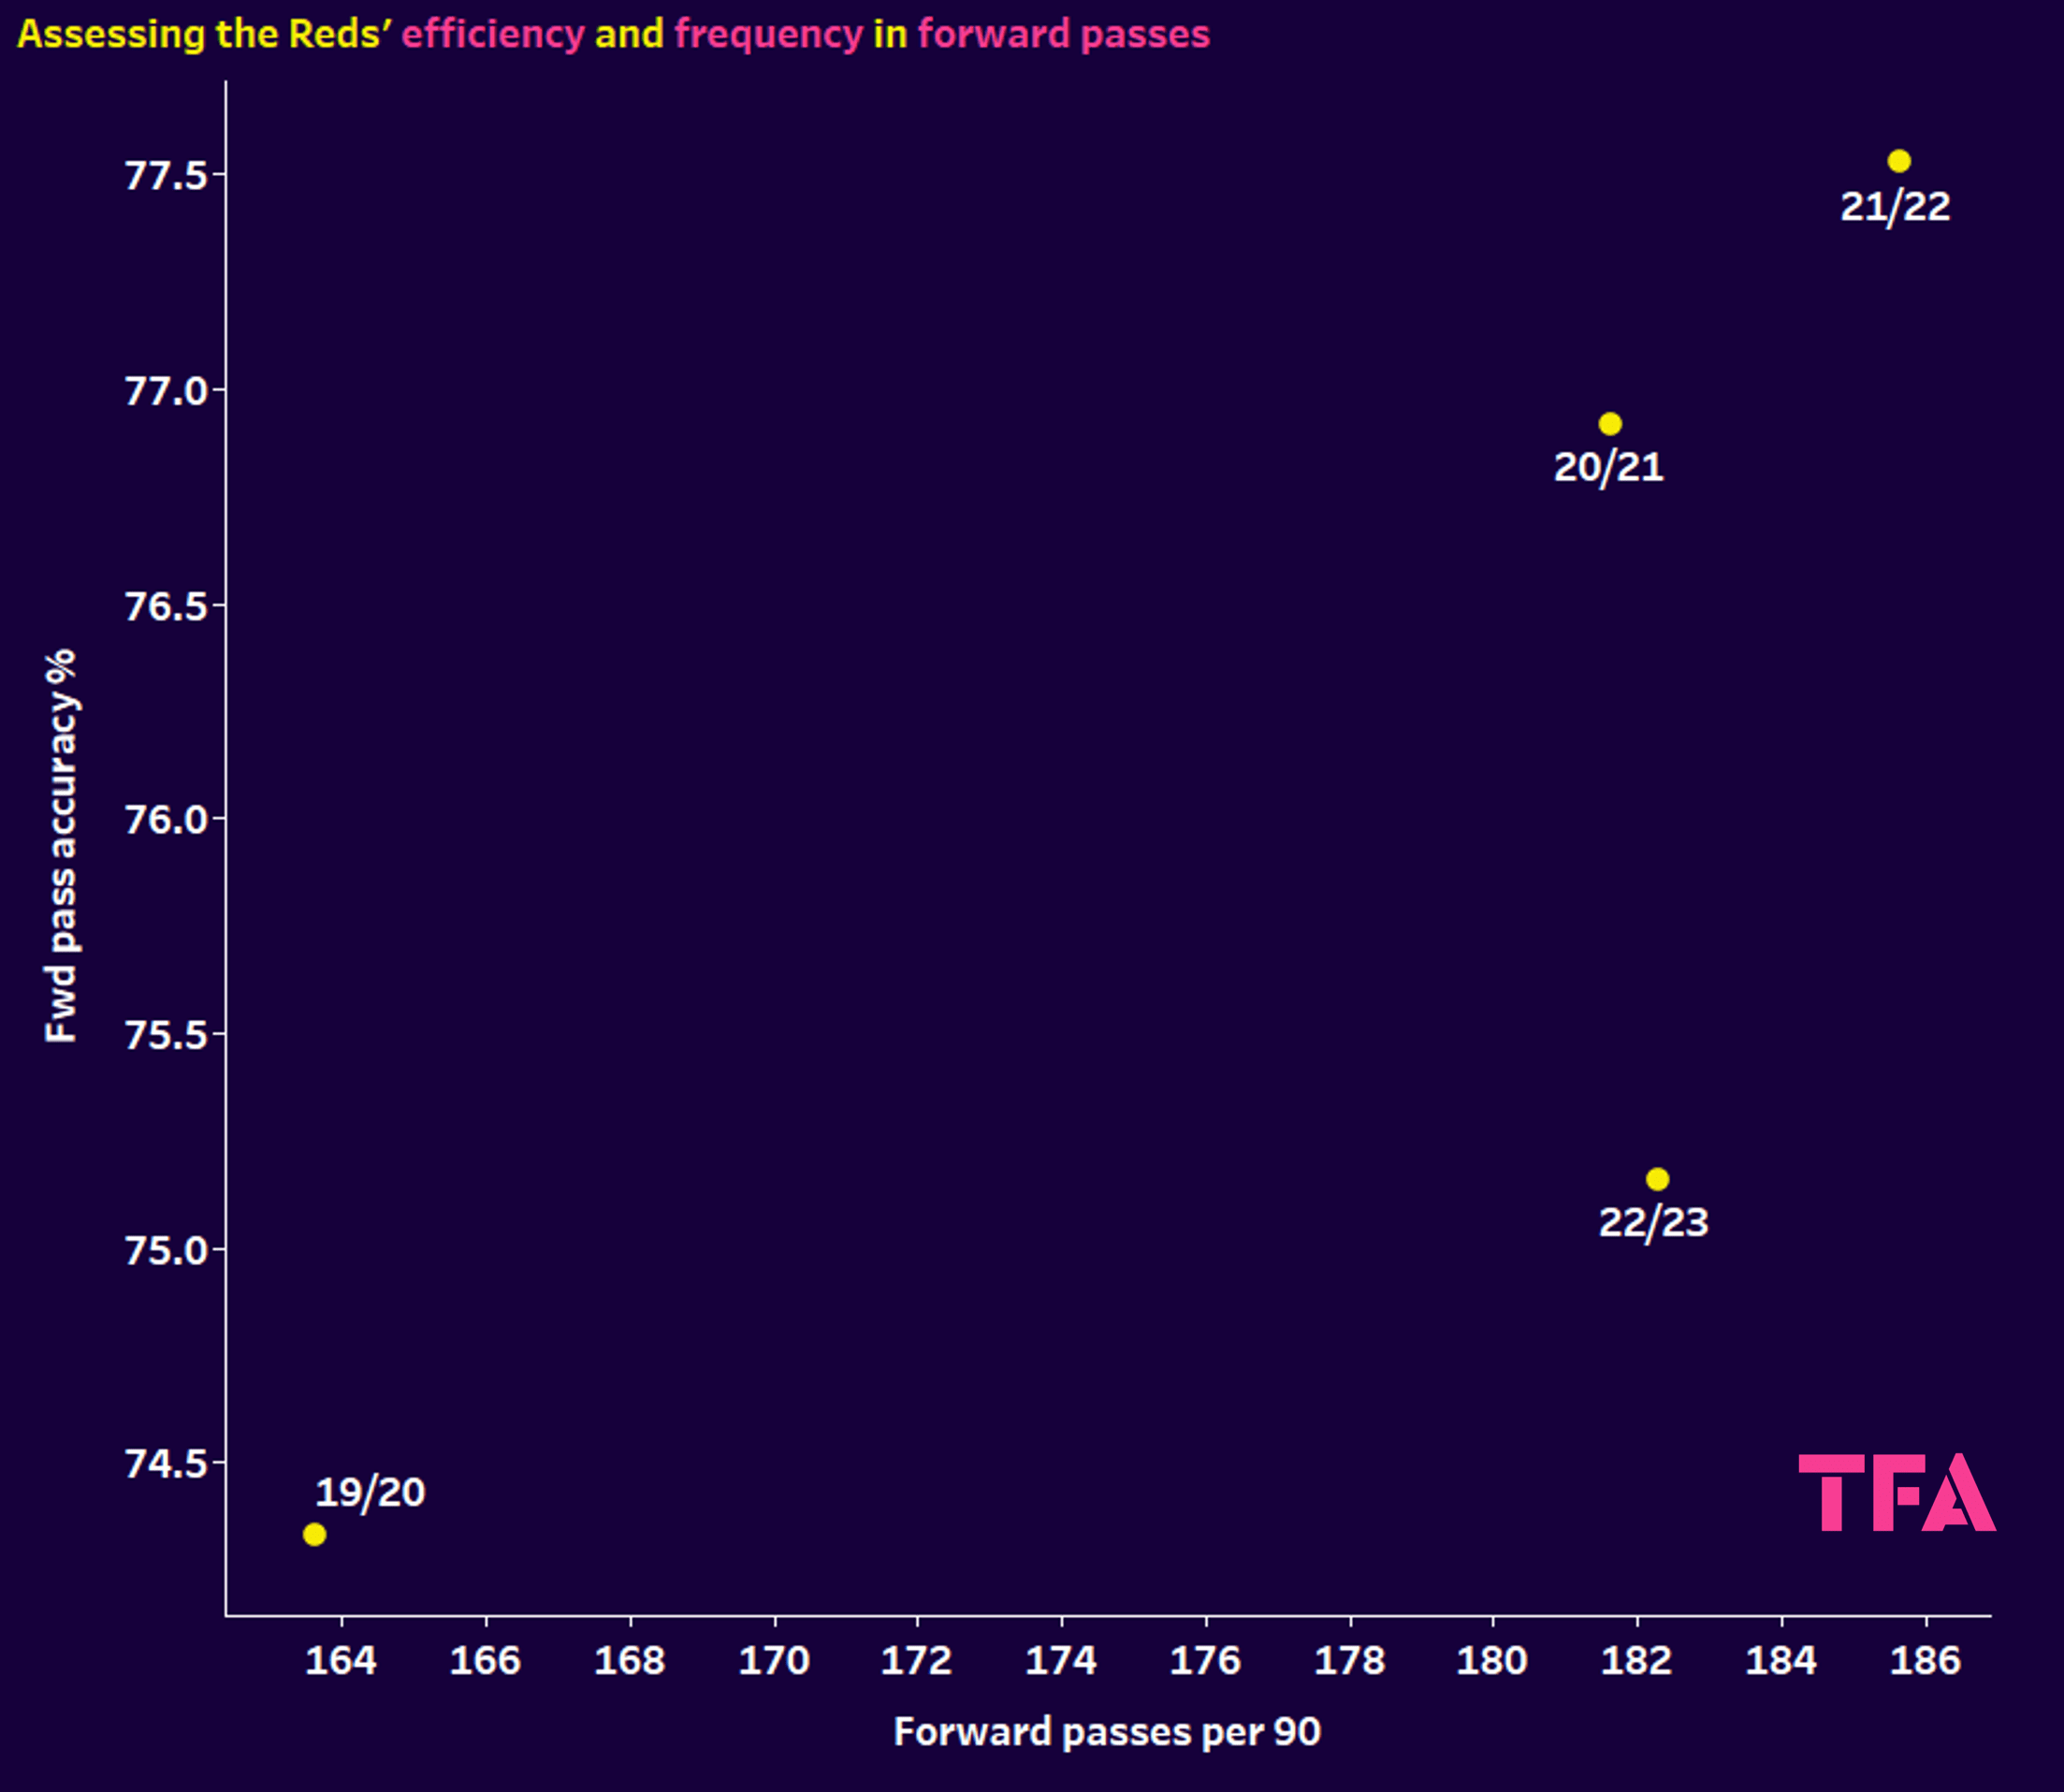
To build on the previous graph, this set of data gives some context to how Liverpool perform with all that possession. Often with possession-based teams who like to control large portions of the game, we see a high number of lateral and backward passes, with a hesitancy to play forwards at times.
Again, the 19/20 season ranks lowly which is remarkable given how they started (and ended) the season in terms of points and league position. What we can draw from the data so far in terms of lower averages in the presented data is that they were more efficient that season.
Attempting forward passes this season is not so much of an issue for them as they average 182.29 per 90, slightly higher than 20/21 and just behind 21/22. What separates them this season is their accuracy in doing so. Of their forward passes this season, 75.16% have been accurate, which could be where we see part of their big problem come to light. We’ve seen multiple examples this season of Liverpool trying to play forward but they act without conviction, the ball gets turned over and they get punished on the break.
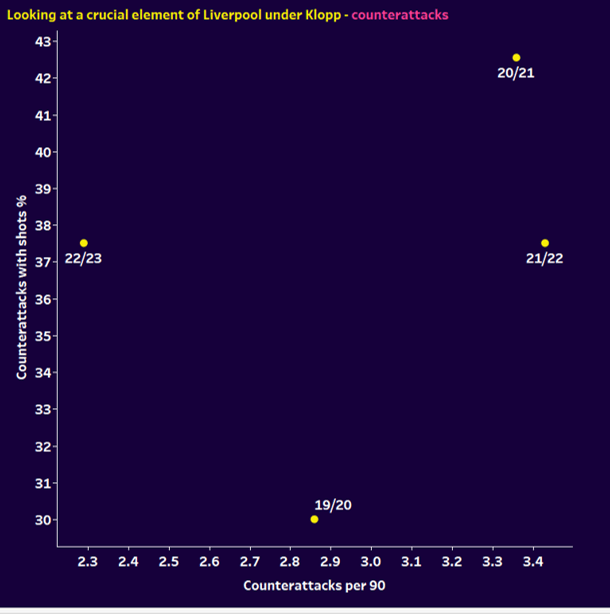
This next analysis covers a major area of Liverpool’s philosophy under Klopp. They have been unmatched when it comes to punishing teams in a counterattack, and it has won them games on countless occasions.
We’ll start with the positive this time. So far this season, 37.5% of their counterattacks end in a shot being taken, which equals the percentage of last season. So, when they launch a counterattack, they still have that cutting edge to create a chance on goal. Another issue is made clear in the number of times they launch a counterattack, which is lower than all three of the previous seasons, and while the margins may not seem all that large numerically, they are missing out on vital opportunities to create more chances on goal.

We end the possession/attack segment with a look at Liverpool’s match tempo over the years. Wyscout measure a team’s tempo by counting the number of passes made per minute of possession. Essentially, it does what it says on the tin, measures a team’s tempo in possession.
If you had just woken up from a coma and had no idea of any football history of the last three years, and you were presented with the data we have discussed so far, you would be mistaken for assuming that the 19/20 data was taken from a title-winning team! Their lower tempo in that season as a whole may come as an initial surprise, but when you consider factors like those fixtures where they played poorly but scraped a result and their fading of form towards the end of the season.
This season, their match tempo is measured at 18.24, which is only slightly slower than 20/21 and 21/22. There is no real comparison to be drawn next to other seasons on this statistic alone; similar to the possession graph, it provides context.
Defending
Defensively, Liverpool struggled in the early days of Klopp’s reign, it was very much a case of just trying to outscore the opponents. From a neutral perspective, it made for some incredible spectacles, but for fans of the club, there was a level of uncertainty in the air. Klopp shored up his team’s defence, both tactically and in terms of new signings. A certain Mr. Van Dijk might have had something to do with that.
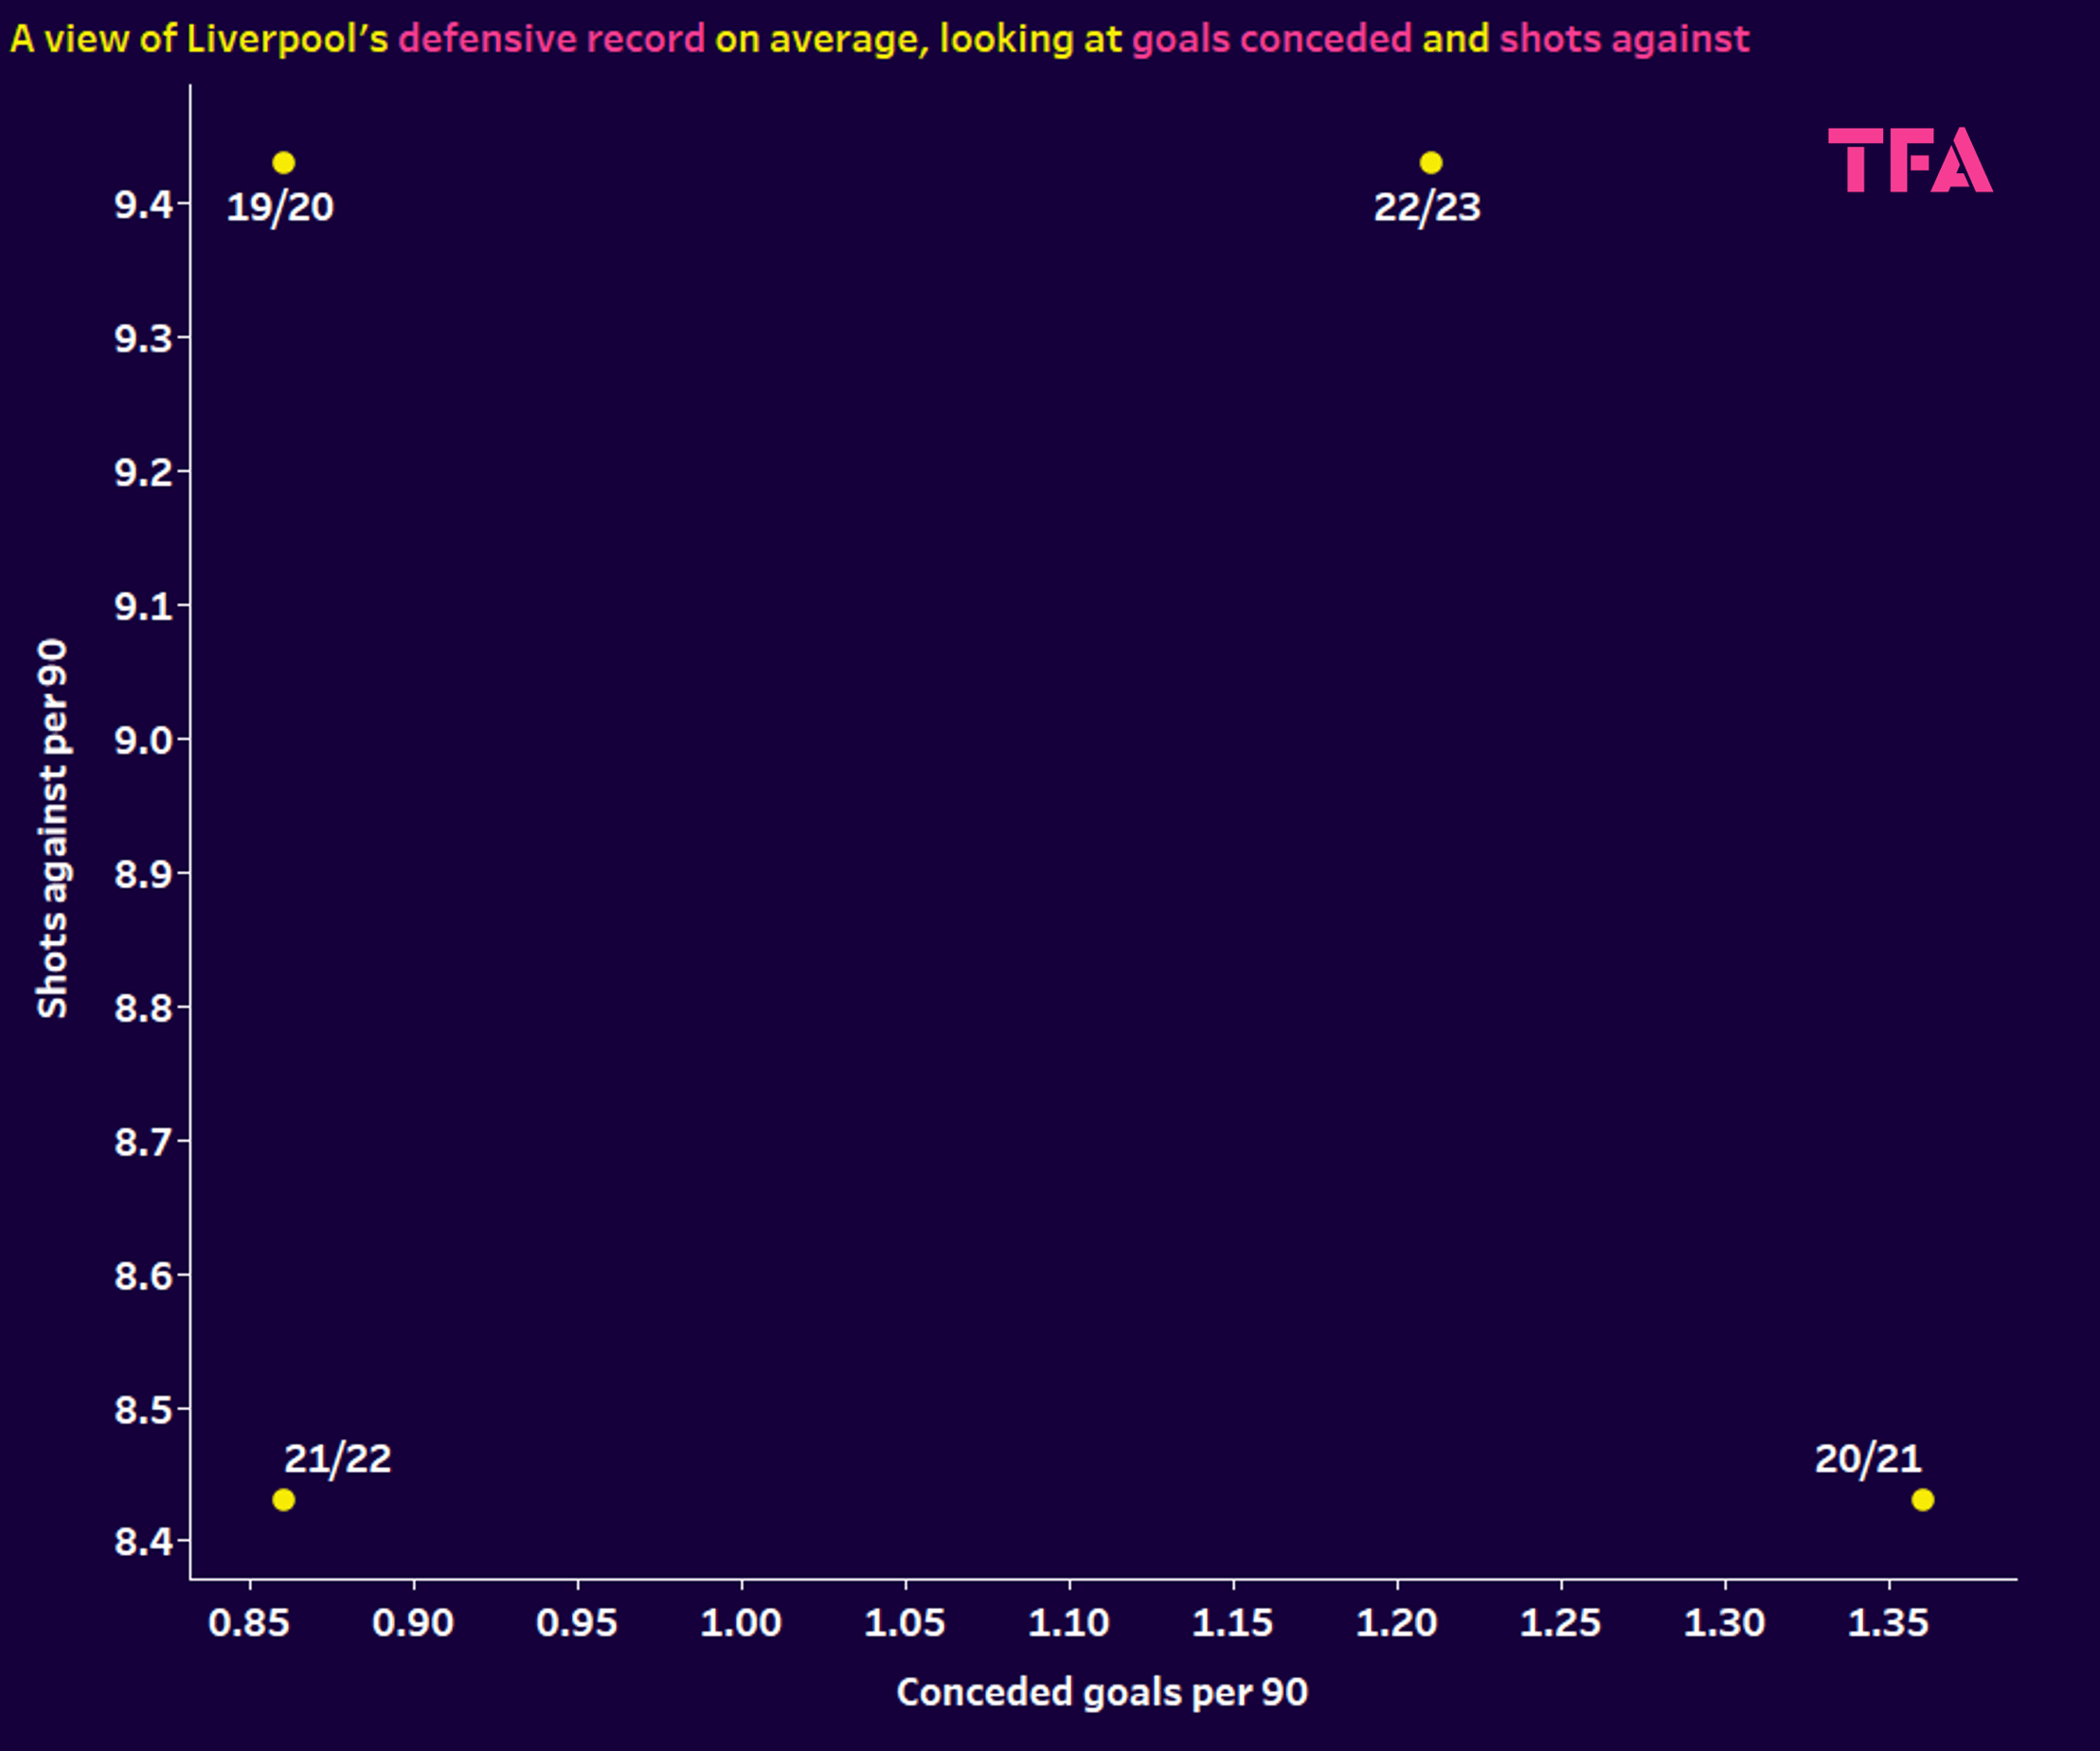
This graph makes for interesting viewing. Each season takes a corner which we can draw assessment from. For example, the 20/21 season in the bottom right of the graph indicates that Liverpool conceded a poor number of goals in that period but faced a low number of shots. Last season is when Liverpool looked the most stable defensively after 14 games according to the data.
The top right corner is where you don’t want to be. It indicates a higher number of goals conceded as well as facing a larger portion of shots as well — this is where Liverpool are at in the current season. If you’ve watched Liverpool this season across a few games, then this won’t come as a shock to you as they seemingly aren’t the indestructible team they once were. The reds have shipped 17 goals in 14 games this season, which is not a defensive record you expect of a team battling it out for European football.
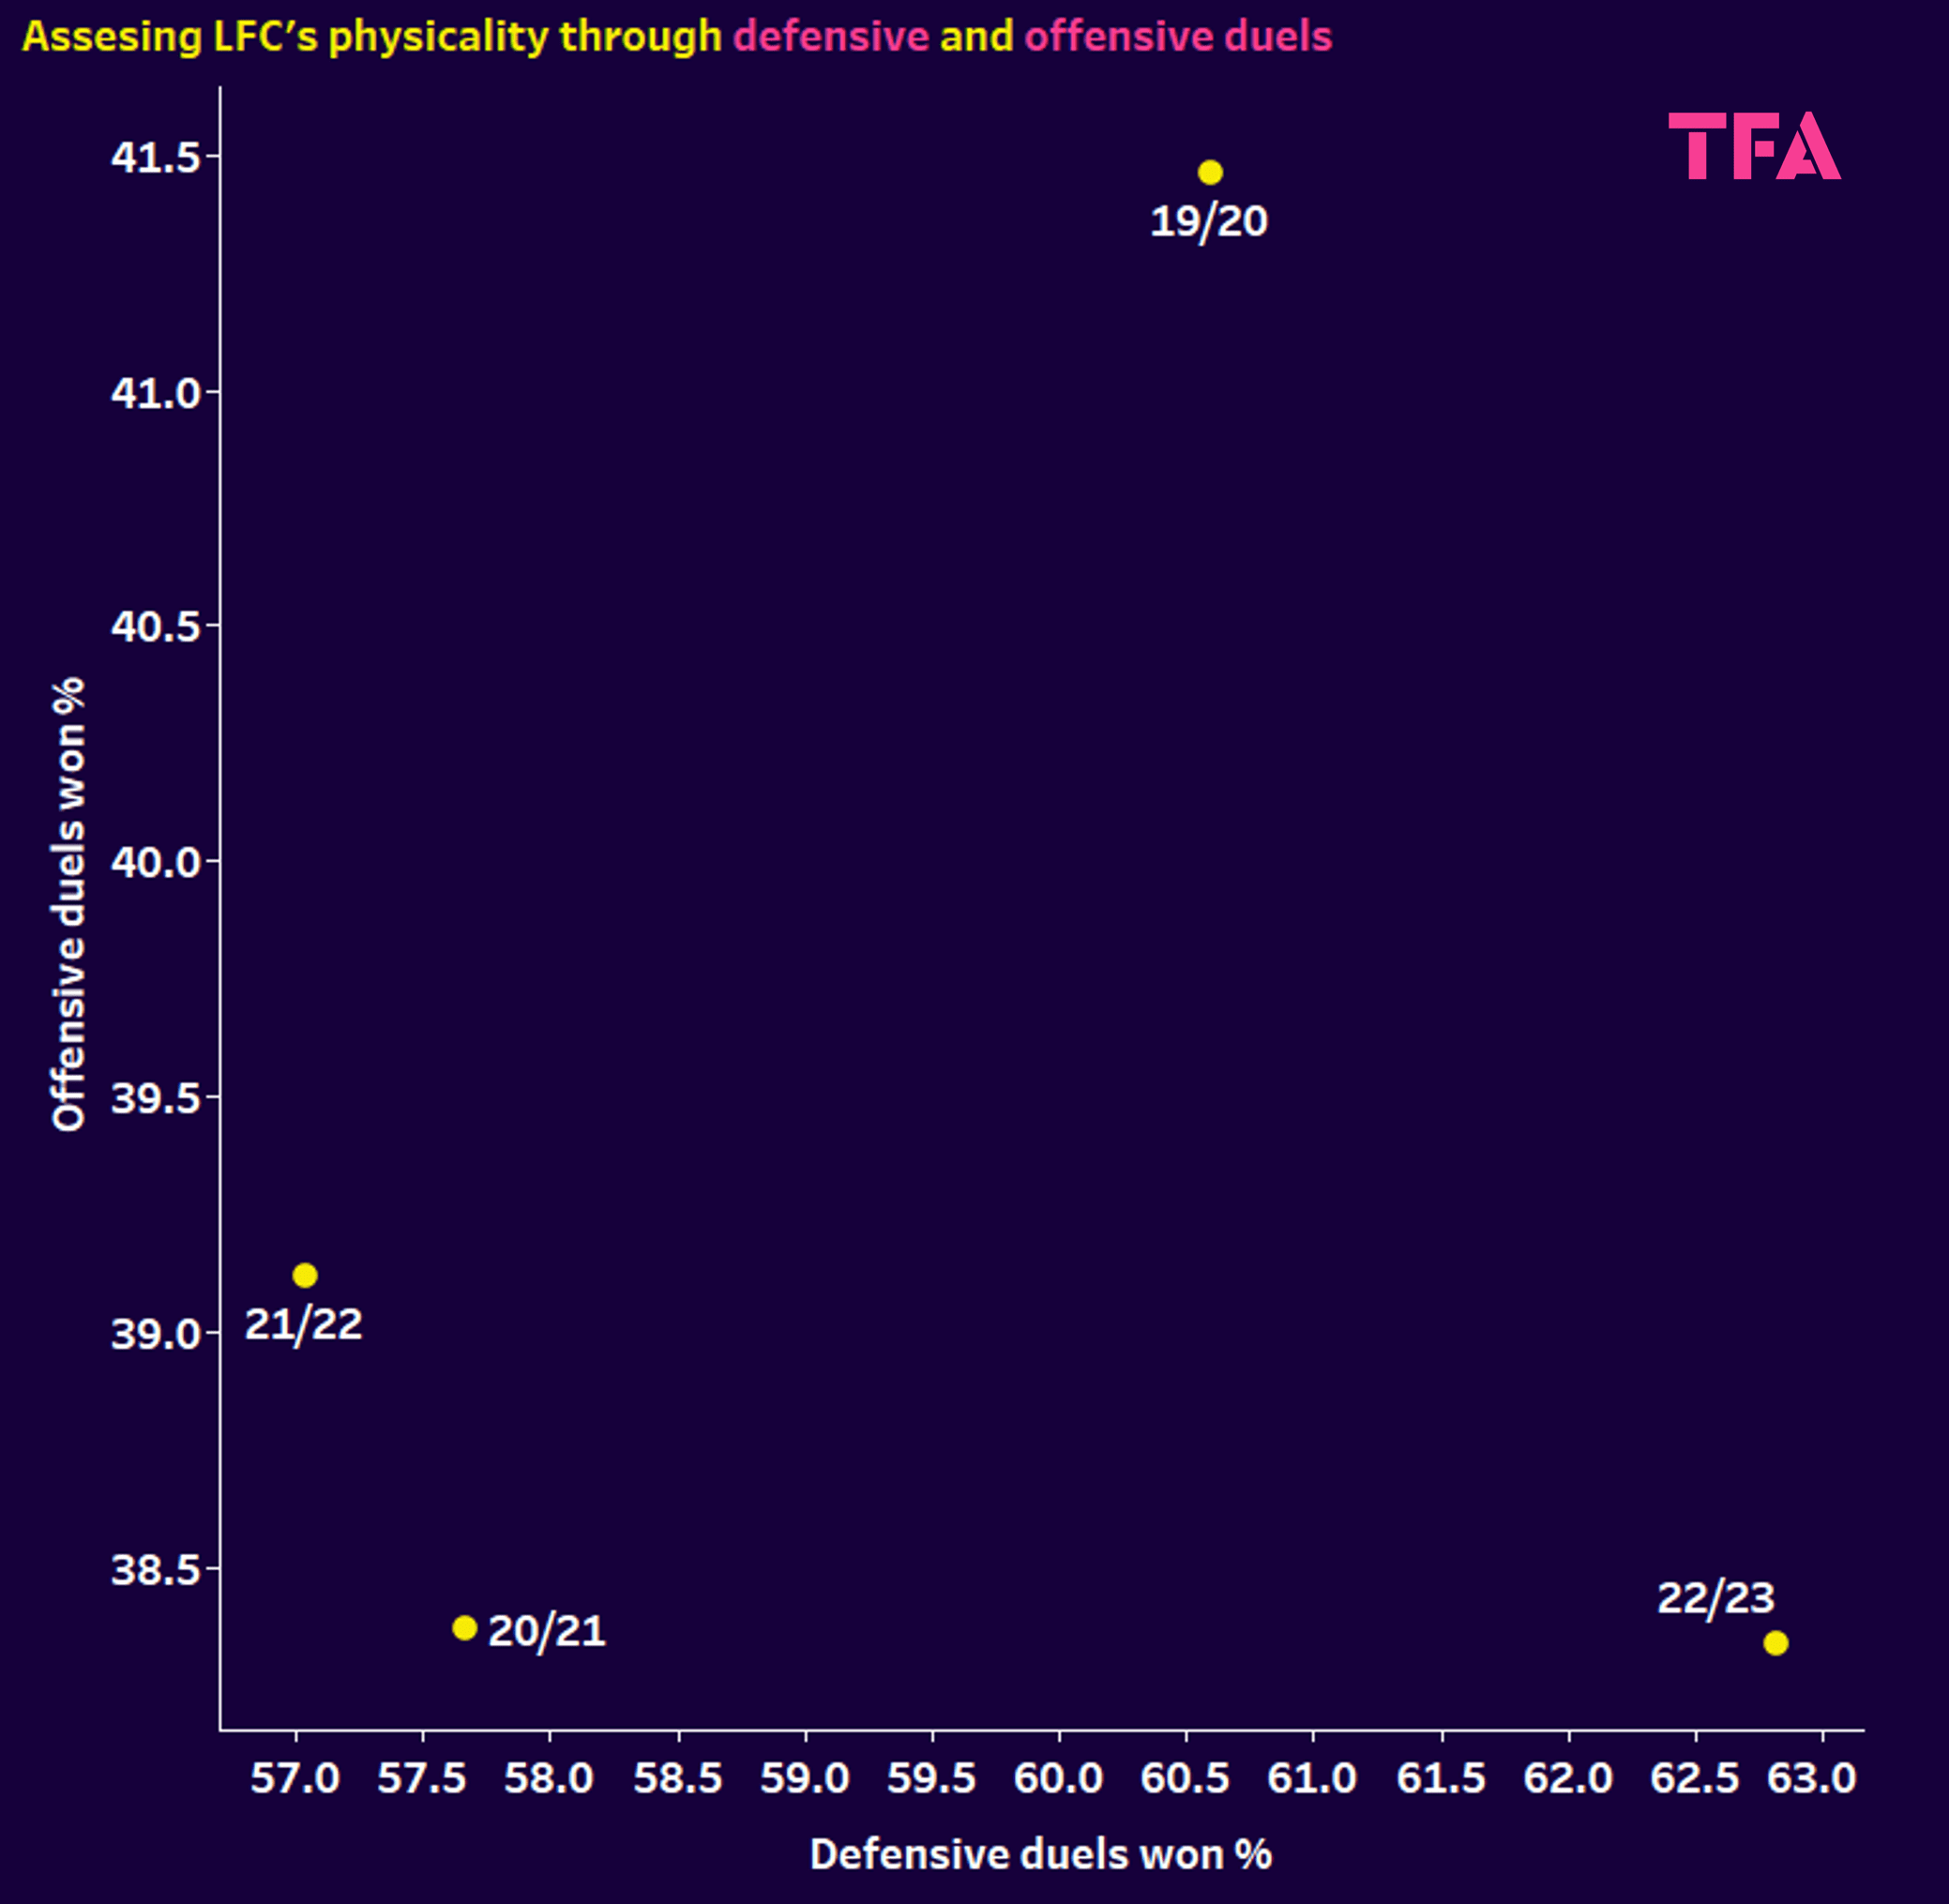
All the best teams in football history are physical in some capacity of the word. Not only do successful sides need to show strength, ability, and consistency in defensive battles to protect their own goal but showing the same traits higher up the pitch and in possession of the ball is equally important. This graph represents just that — a look at Liverpool’s performance in terms of offensive and defensive duels.
We’ll jump back to the trend of starting with the positive — Liverpool are strong and reliable in defensive duels, according to the data. They surpass their 14-game rate for the past three seasons, recording a rate this season so far of 62.82%. This success is something they should look to incorporate into their attacking play and offensive duels, as their success rate in these actions is just 38.34%, their third-worst 14-game rate since 2019/20.
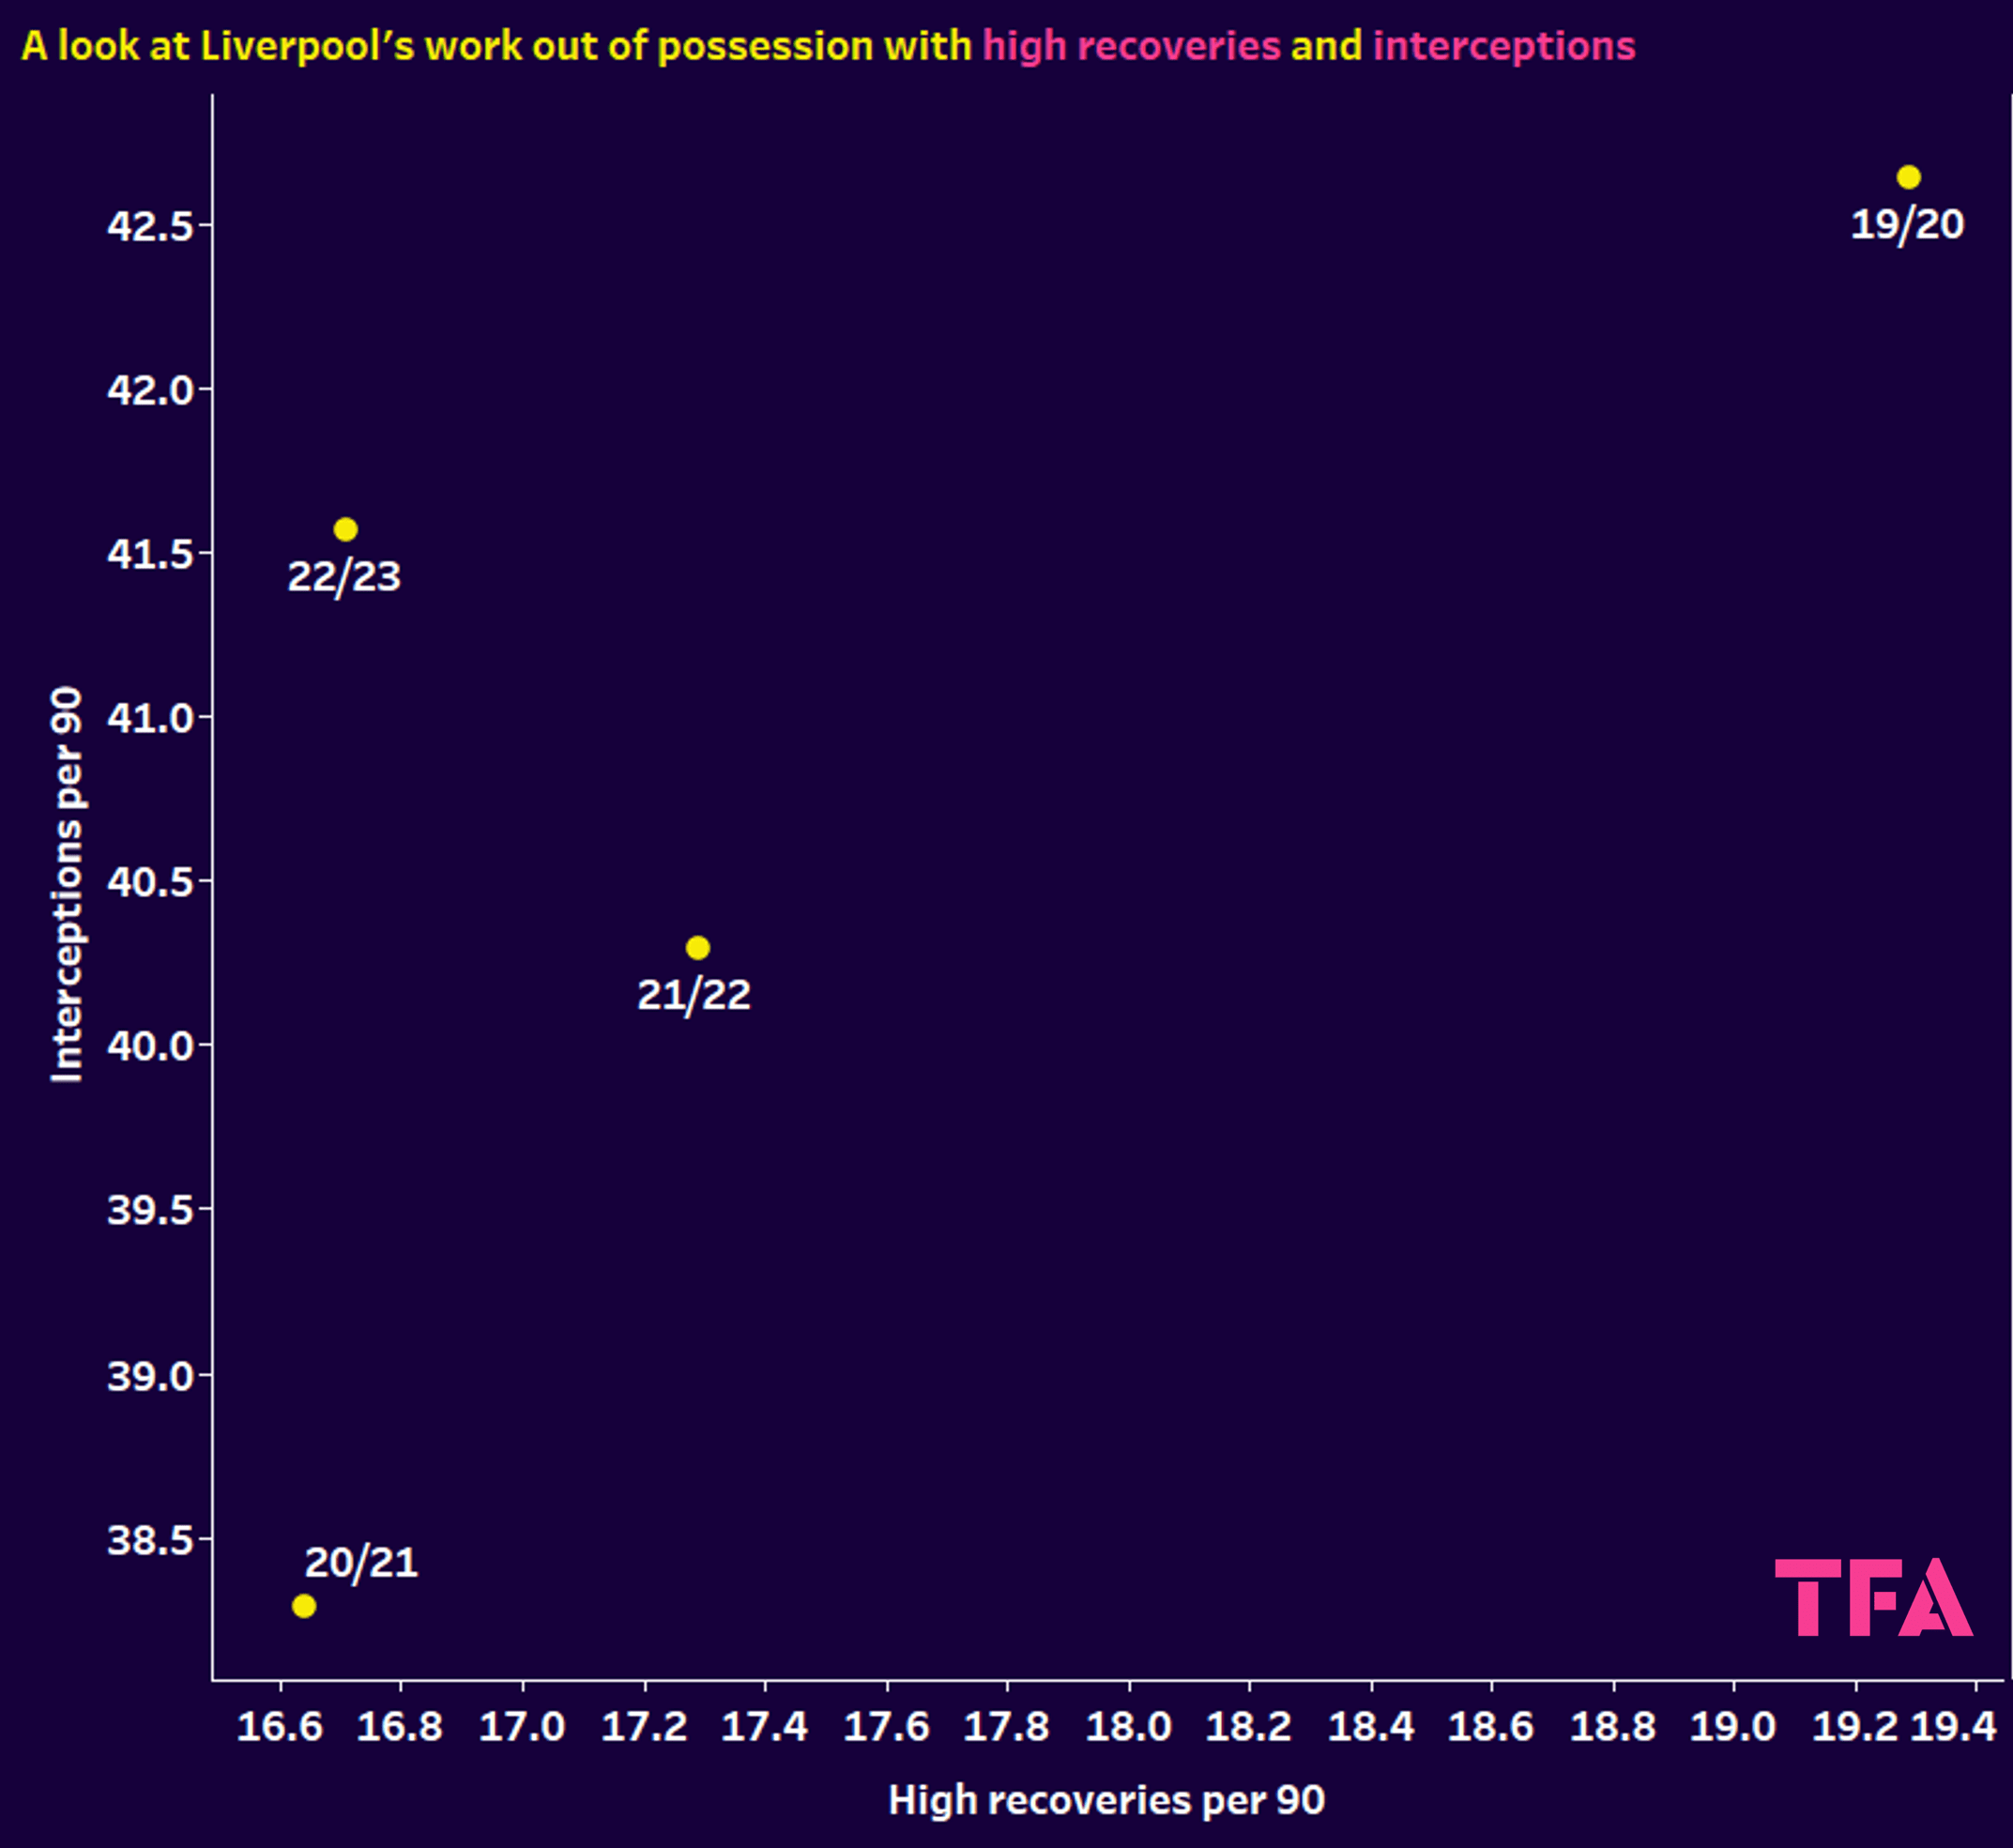
As mentioned in the attacking segment, counterattacking is a vital cog in the aggressive, high-energy Liverpool machine. High-intensity pressing goes hand-in-hand with that attacking approach, and Liverpool have become masters of the press under Klopp, with very few teams able to escape the high-energy approach.
This was a major element of Klopp’s approach in the title-winning season, which is why they are in the top right corner of the graph which indicates that they completed an impressive level of high recoveries as well as making a good number of interceptions as well. Breaking up opposition play and pressing in high areas gave the reds more chances to attack quickly.
The Liverpool of this season do well at breaking up play, making 41.57 interceptions per 90, but they seem to have pulled away from the high press as they have averaged just 16.71 high recoveries per 90. Not a complete drop-off in terms of ditching the approach altogether, but certainly a noticeable difference. Whether this is purely tactical or even coincidental, or down to the fact that there are some new faces in attack and midfield and Klopp is simply waiting for them to be more settled into the system before unleashing them in the press, it’s an area that has not been as present in the team this season so far.
Conclusion
This data analysis alone will not identify any problems Liverpool are having on the pitch, but we can draw some points of concern along with the context of their performances.
According to the data, they have struggled in several areas in comparison to previous years, and that has translated onto the pitch and the league table. Pressing doesn’t seem to be as successful, and they don’t seem to be physical enough in duels when in possession. A lower average number of counterattacks may be linked to their lower numbers in goal-scoring metrics, and they are defensively too vulnerable at times.
How they return from the World Cup will define their season, and putting together a run of good results in the Premier League will not only bolster their standing in that competition but will also provide good momentum to carry into other competitions too.



Comments