Luck plays a part in football, larger than many fans and pundits like to admit. Its vagueness and difficulty in being quantified often means luck is written off as a manager’s poor excuse to deflect blame. But luck, or variance, as it should be referred, exists whether we like it or not. Not every sequence on the football field occurs as the result of meticulous tactical play – despite Pep Guardiola’s best efforts. Even the best managers can’t escape the grips of variance, because ultimately where probability is involved, variance is invariably a factor.
With the Expected Goals (xG) model, probability is the fundamental principle underlying the metric. Whether a shot is likely to go in or not has a designated percentage, calculated through thousands of hours of football analysis used to clearly and accurately describe the quality of a chance. We saw in my previous magazine article how variance can be used to impact tactical decisions. Common sense would naturally lead us to conclude that the top managers are the best at reducing the amount of variance their team faces by creating the highest quality chances possible. Through their tactical nous, training ideas and managerial style, the best managers – consistently achieving the best results – are making sure their team is playing an optimum level of football to reduce variance to as little as possible.
Sadly, however, deviation leading to a sequence of bad results can run longer than that of the board’s patience, often resulting in a desk clear-out for the unlucky managers. But sometimes the table that is so heavily broadcast across the globe to millions of fans and used religiously as the measure of a club’s ability, lies.
What the league table shows is the current standing of all teams amid whatever spell of variance they are enduring. Some are the lucky ones, scoring more goals than expected and sitting in an undeservedly high position. Heaps of praise for the manager who has masterminded the glorious pathway to unchartered territory for his team, however, highly unsuspecting of the regression to the mean that his team will face when expected goals and actual goals begin to realign.
Others are the unlucky ones, facing a media backlash labelled as a crisis when according to their xG and expected goals against (xGA) they should be higher in the table. But how can a manager address the concerns of the faithful fans by declaring his team as merely unlucky? It doesn’t wash, but that’s where in this tactical analysis, we show you where Expected Points (xPTS) come in.
So, what are Expected Points?
Expected Points is a calculated figure that shows a team’s ‘true’ league position. xPTS uses both xG and xGA from each game a team has played to provide an expected amount of points each side would expect to win based on the quality of the chances they created in the 90 minutes. Using the probabilities assigned to each shot attempted and shot faced, xPTS uses standard deviation to calculate the variance a side would expect to face if the game were to be replayed identically an infinite amount of times.
Putting it succinctly, shots with lower xG will face a larger variance because of their lower probability of going in. Conversely, shots with a higher xG will face a lower variance because of the higher probability they hold.
Understanding this variance we can apply a percentage figure to indicate how often a team would expect to win a specific match – using the identical attempts on goal – on any given occasion. From this, the win, draw and loss percentage can be converted into an xPTS total.
This total shows the average points a team would be expected to win based on the chances they created and faced. From here we can then compare this to the points that were literally won/lost to deduce if a team was lucky or unlucky.
Example: Man City vs Crystal Palace (11/01/20)
Earlier in January, the champions met Crystal Palace in what was set to be another routine home win for Man City, who were desperate to maintain some semblance of a title challenge. The game didn’t go to plan for Guardiola however, finishing 2-2 despite dominating the game.
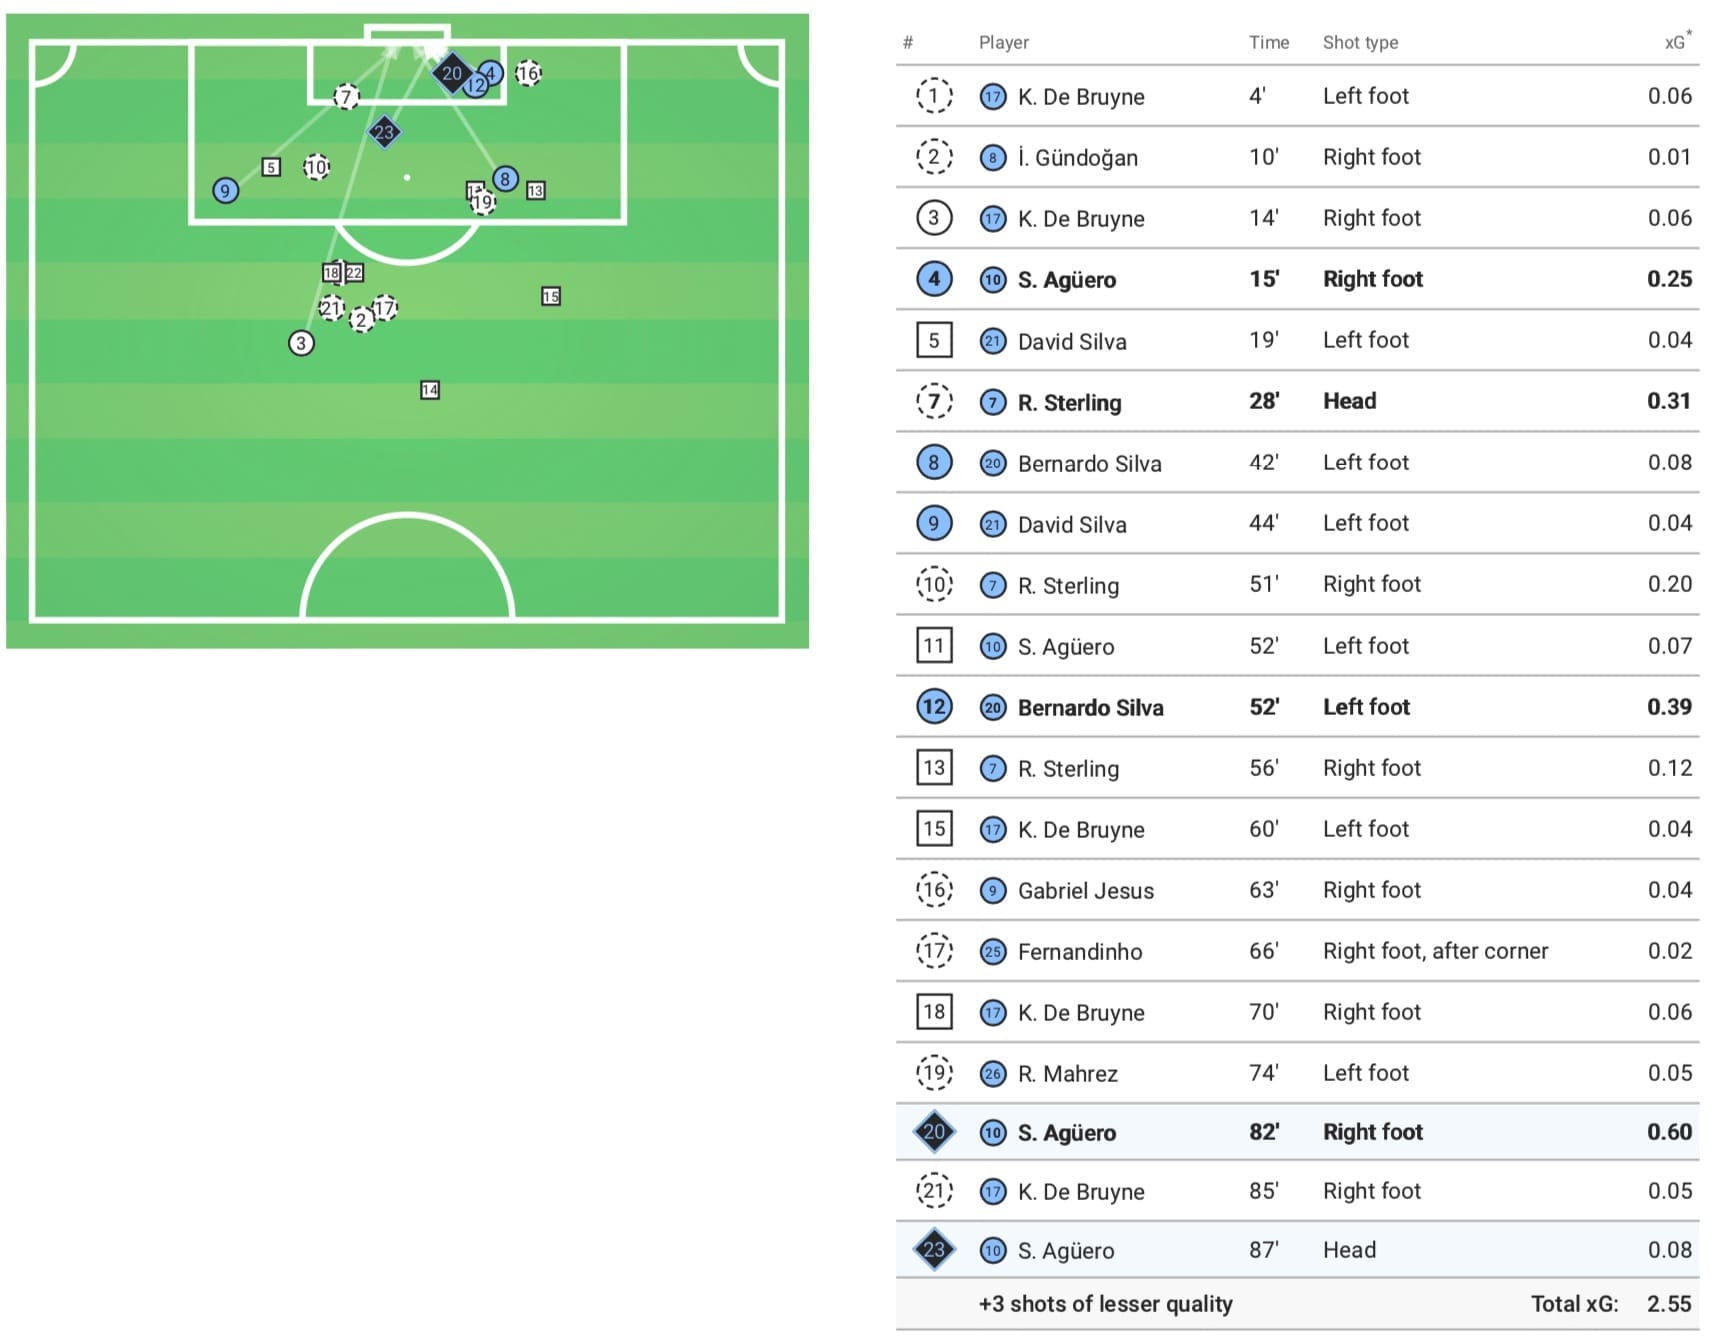
After the game, Guardiola was quoted in saying ‘we did everything but win’, which from the xG map above, and the following calculations, we’ll prove him right. The Sky Blues finished with an xG of 2.55, with their main chances coming from Aguero (0.6 xG) and Bernardo Silva (0.39 xG).
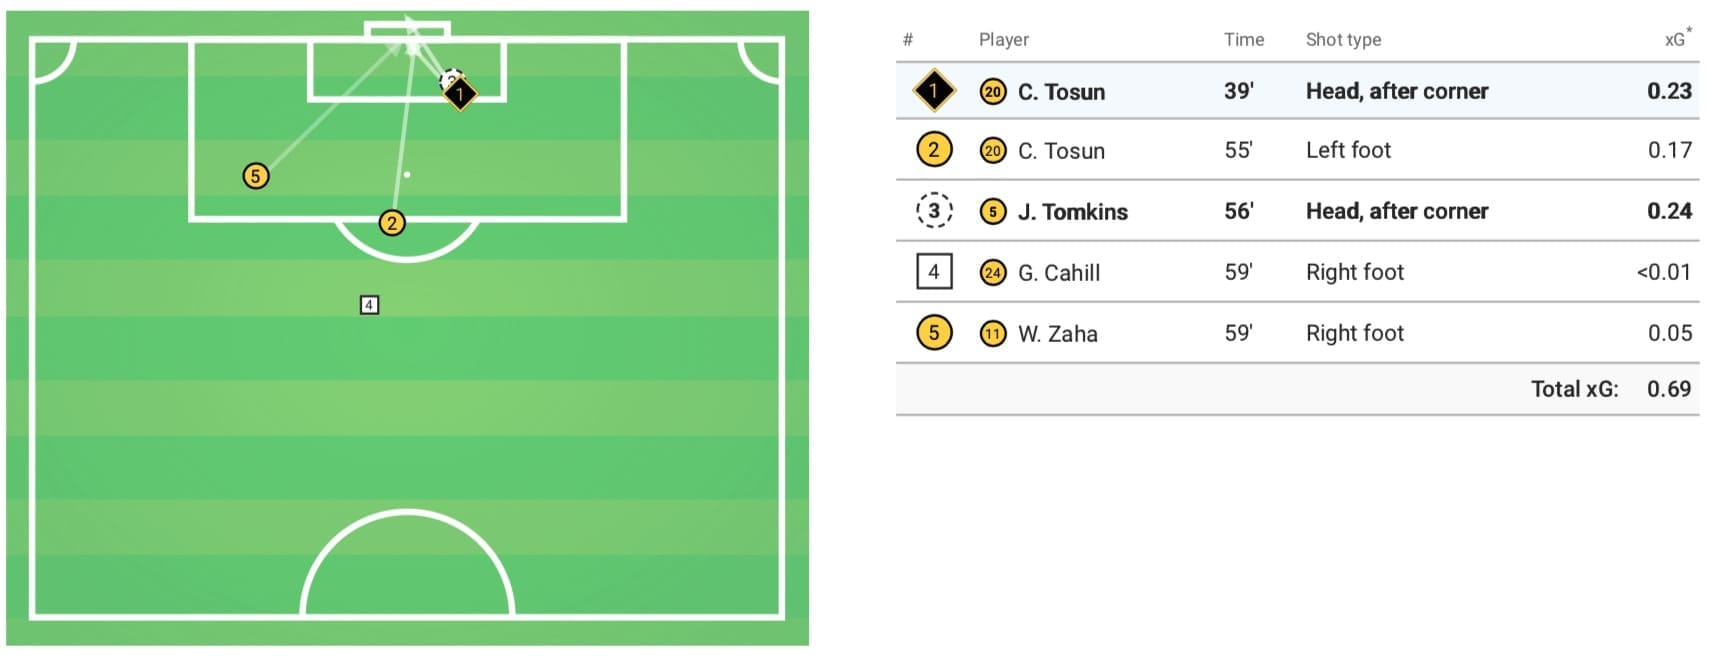
Crystal Palace’s xG map tells a different story. They managed an xG of just 0.69, with their best chance coming from a James Tomkins header that achieved 0.24 xG. Despite this, the Southern club ended the game with 2 goals and a valuable point. So how can we prove the luck element and how does this relate to xPTS?
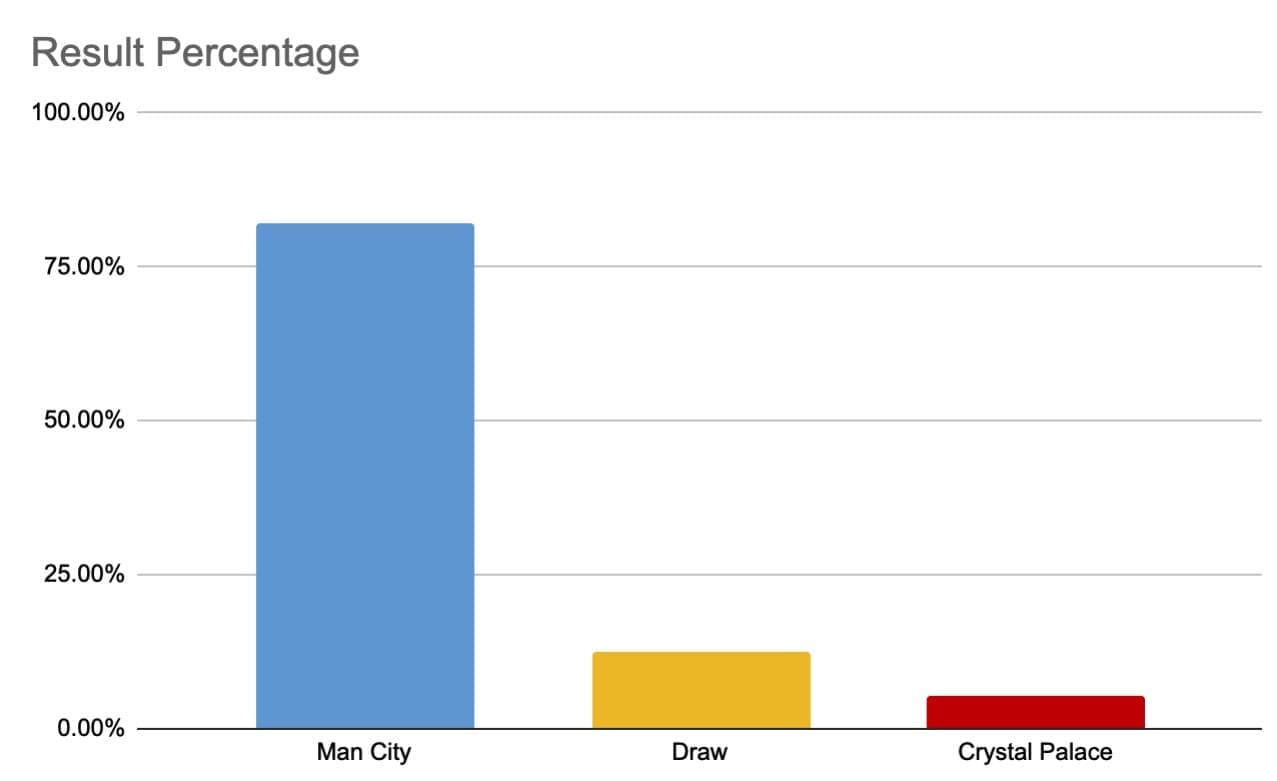
Plugging the numbers, we can see above that based on the quality of chances created in the game, on any given occasion – if the game were played an infinite amount of times – Man City would expect to win 82.05% of the time. The next most likely outcome of the game is a draw at 12.58%, with a Crystal Palace victory occurring just 5.37% of the time.
Going a step further, we can calculate the Expected Points for each side. This is a little bit tricky with the draw rewarding one point and the victory rewarding three. However, I’ve shown below how it’s done.
Man City Expected PointsCrystal Palace Expected Points3 points x 82.05% = 2.46 3 points x 5.37% = 0.16
1 points x 12.58% = 0.13 1 points x 12.58% = 0.13
Total xPTS = 2.59 Total xPTS = 0.29
The visual below shows the results.
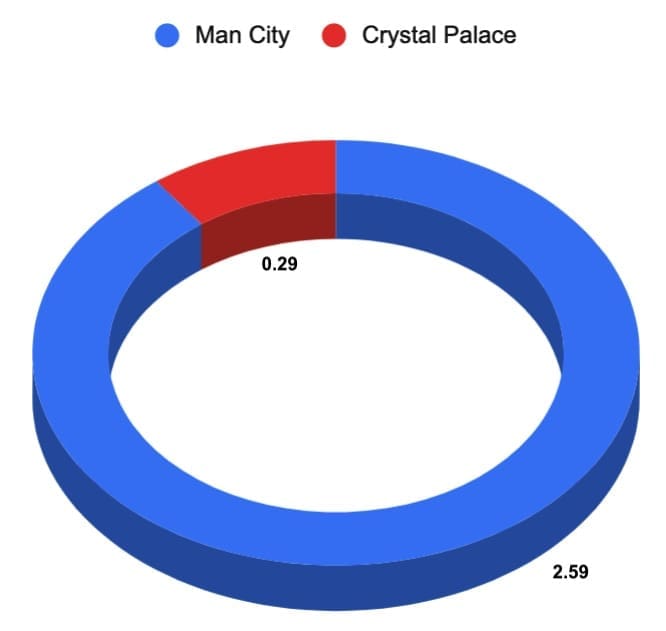
The results are clear. We can see that on average Man City would expect to earn 2.58 points per game. Crystal Palace, on the other hand, would achieve an xPTS of just 0.29. Instead, with just 1.00 points, Man City have to cope with an xPTS deficit of 1.58, which will no doubt be a bitter pill to swallow.
A few of you may be thinking, but you can’t get 2.58 points, so what is this telling me? It’s a fair question and the answer is this. 2.58 shows the average amount of points Man City would expect to win if the fixture were played identically and an infinite amount of times. This also explains why both teams xPTS don’t add up to three, as it’s an average figure.
A tale of two tables
As the season progresses, a team’s actual points tally begins to differ from the number of points they would expect to have accrued based on the quality of chances they created. We can then create a separate table to show how this differs.
Below, I have used this season’s English Premier League. I have used the top six teams in the league as of 27/01/2020.
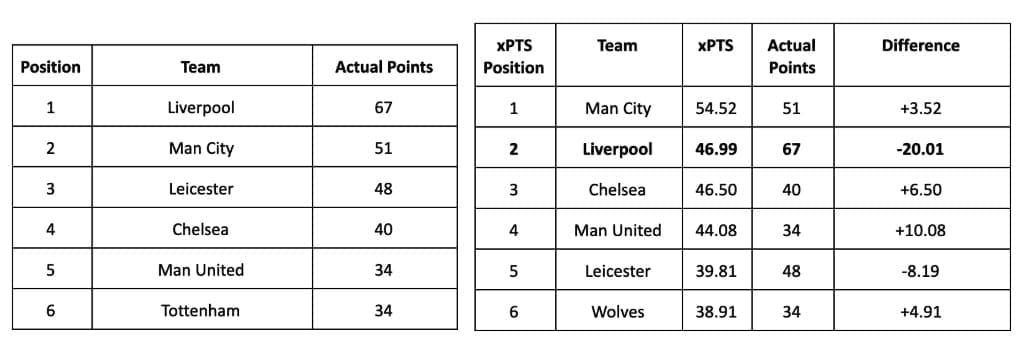
It’s immediately clear to see how the two tables differ. The most startling change is that the league leaders Liverpool, who are currently on 67 points, would only be expected to have won 46.99 points. This gives them a massive 20.01 points more than what would be expected based on the games they’ve been involved in this season.
On the other hand, Man City would expect to be in first place, turning the 16-point deficit into a 7.53-point lead. Another interesting point is the hugely differing media narrative Man United and Leicester have had this season and yet, as per the xPTS, Man United can feel hard-done-by that they are not above the Foxes and in the Champions League positions.
Circling back to Liverpool, they are the most interesting as according to the xPTS totals, they currently are the luckiest team in Europe. They have a massive 20.01 more points than would be expected based on the quality of chances they’ve created and faced. No other team across the major top European leagues have experienced the level of positive variance that the Anfield club have faced so far this season.
Below we take a closer look at the games that have helped the most towards this huge xPTS differential.
Southampton vs Liverpool (17/08/19)
xPTS Differential: -2.07
Early on in the season, Liverpool travelled to the South Coast where they met Southampton. We can see below that Jurgen Klopp’s side left with all three points despite amassing an xG of 1.52, which was inferior to the home side’s 2.14.
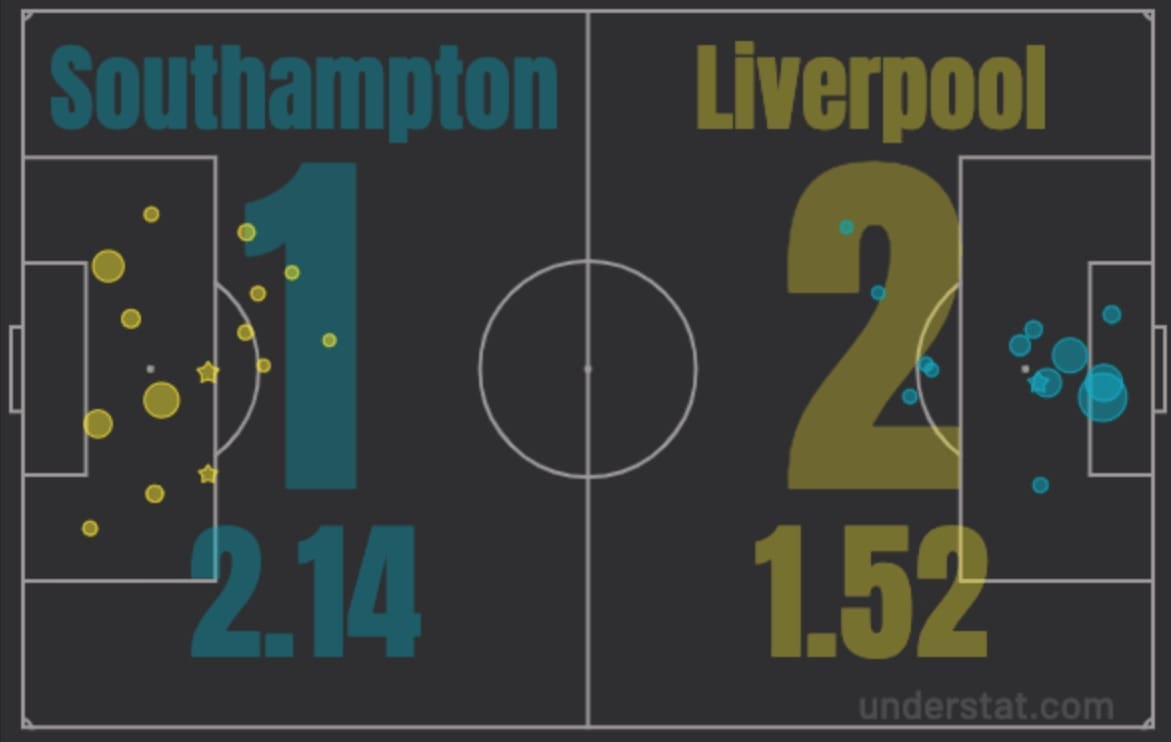
The visual above shows the quality of chances created by each side, in the form of xG. Each circle is representative of a shot taken. The larger the circle, the easier the chance, therefore, the higher the xG. The starred elements represent the shots that found the back of the net.
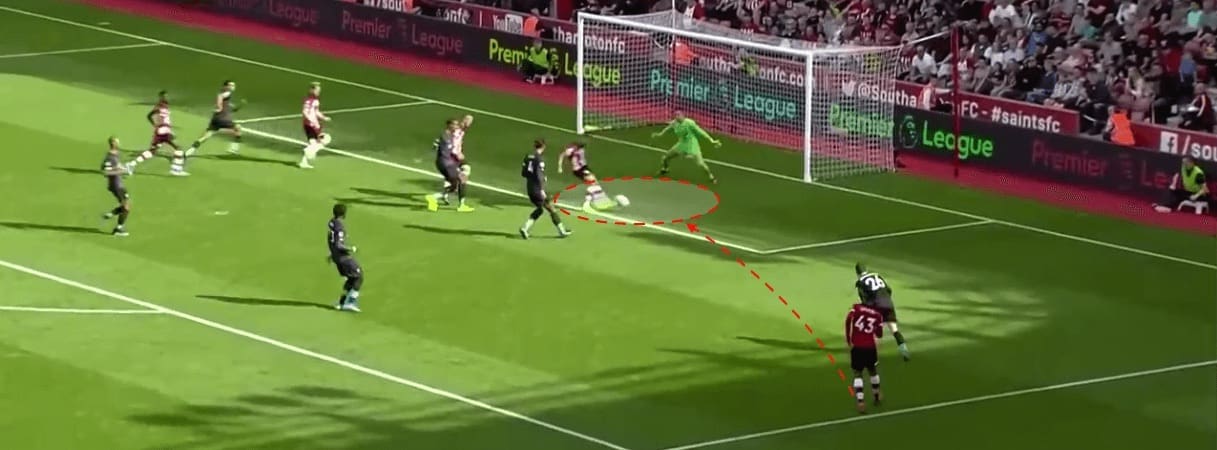
One of Southampton’s larger circles was a chance that fell to Danny Ings. The attempt was their biggest in the match and yielded a massive 0.56 xG. The 56% chance of finding the net was calculated from a number of factors. Firstly Ings is in acres of space, timing his run perfectly to drift away from Virgil van Dyke. Secondly, Ings is close to the goal and almost perfectly central. These key factors all contributed to the 0.56 xG earned. Fortunately, from Liverpool’s perspective, Ings slid the ball wide and spurned a golden opportunity.
So how does this stack up in terms of numbers?
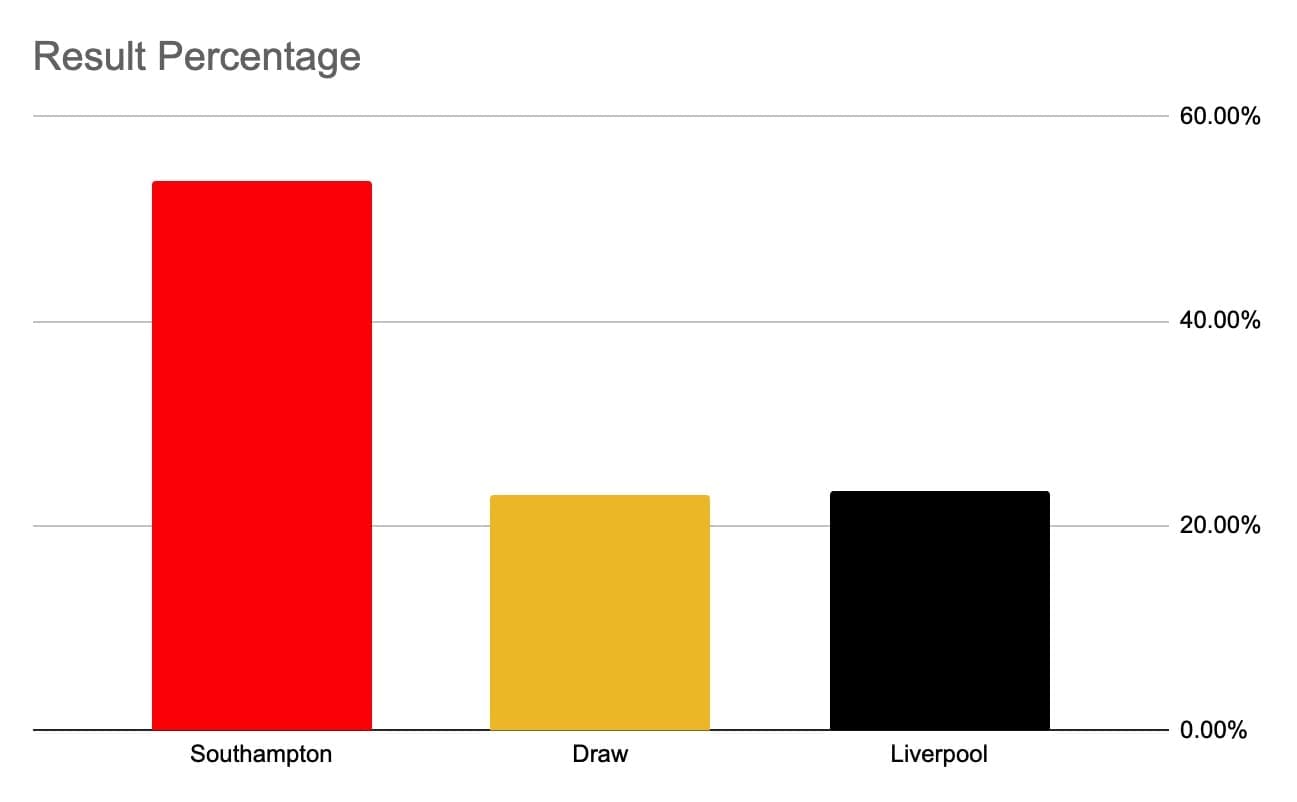
Plugging the numbers we can see that 53.06% of the time Southampton would expect to win based on the in-game chances. This made the chance that the result was anything but a Liverpool win, a whopping 76.63%. Despite the numbers, Klopp’s men walked off the pitch with all three points in hand.
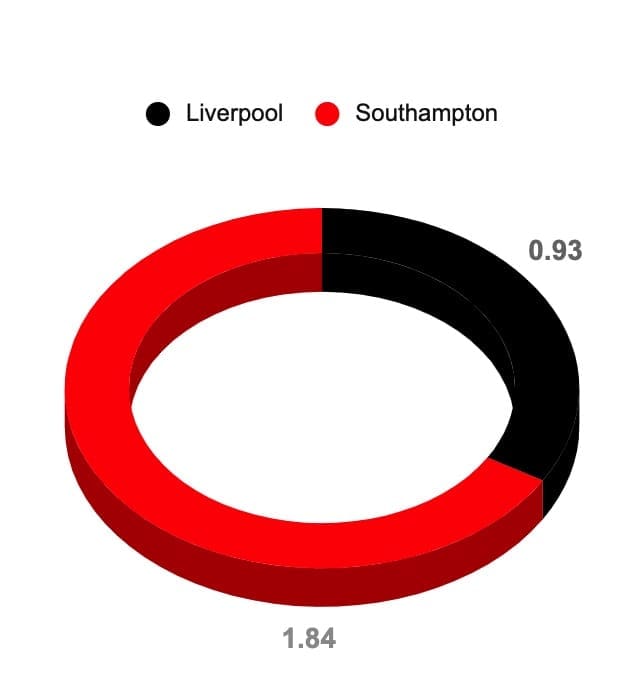
We can see above that Liverpool should consider these three points as bonus points. If things went as expected, Liverpool would expect to earn on average just 0.93 points. Compare this to their 3 points actually won, which gives us a differential of -2.07, and we can see that perhaps lady luck attended St.Marys that day – wearing a Liverpool shirt.
Chelsea vs Liverpool (22/09/19)
xPTS Differential: -1.8
In September, Liverpool met Chelsea at Stamford Bridge. Liverpool had made a strong start to the season, winning their first five and scoring 15 goals. The Reds were top of the table, just two points ahead of rivals Man City.
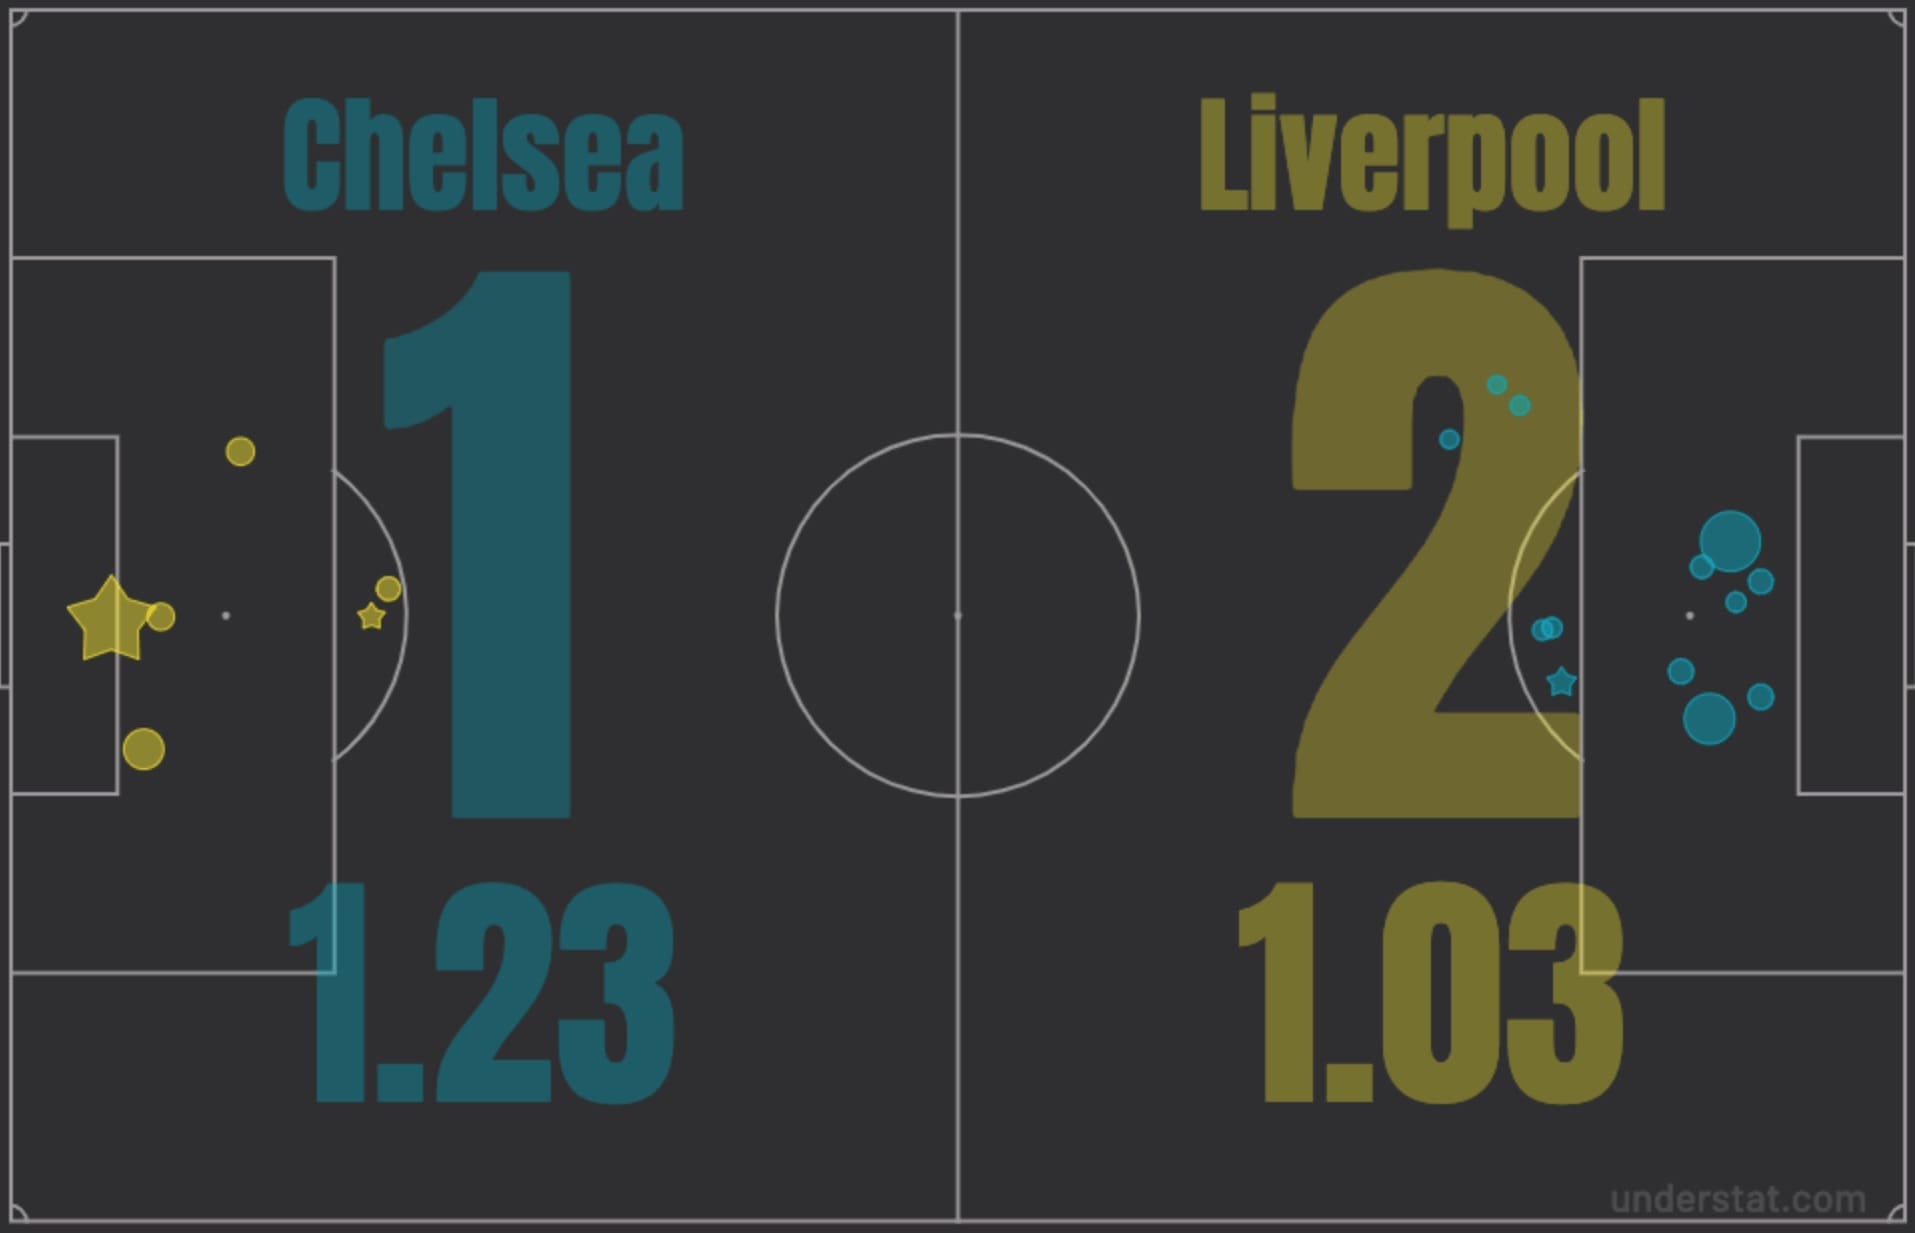
At the final whistle, Liverpool walked off victorious after a 2-1 victory, but was that the fair result? We can see above, probably not. Chelsea, scoring just one goal, amassed an xG of 1.23. Liverpool on the other hand, scored two goals, with an xG of just 1.03.
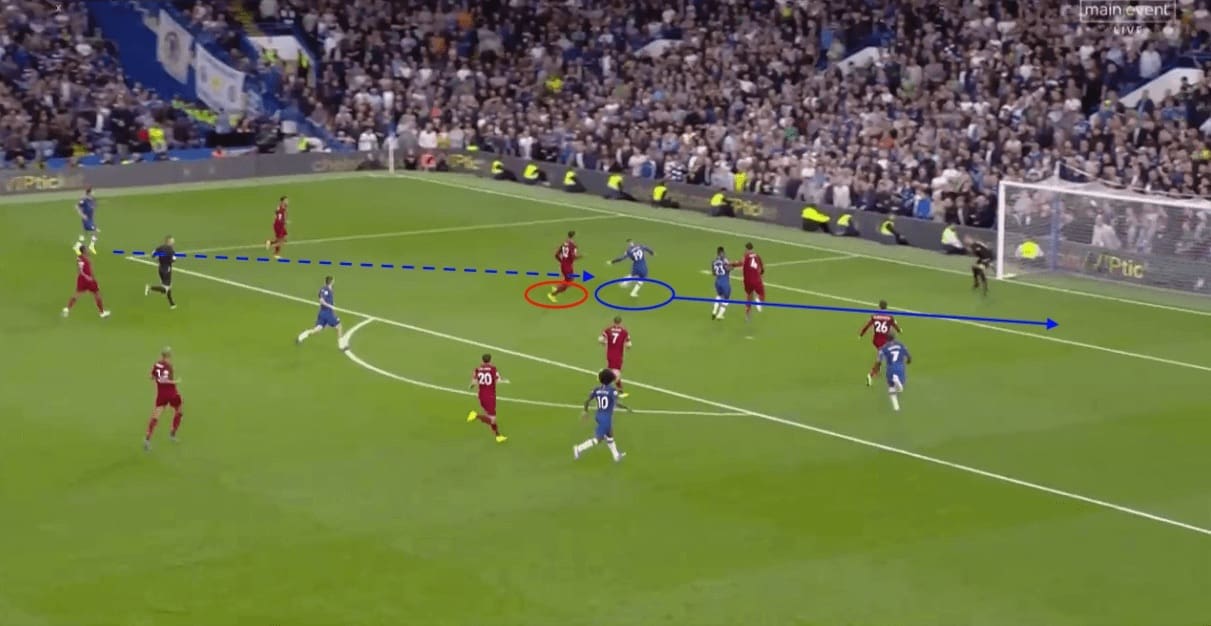
One of the bigger chances wasted by the home side fell to Mason Mount in the closing stages of the game. We can see above how following good movement off the wing, Mount has moved away from Joël Matip and into space. The ball is delivered on a plate for Mount who now has plenty of room to shoot on his stronger foot. Van Dijk is occupied by Tammy Abraham so is unable to get across to attempt a block. These factors yielded a 0.40 xG for the opportunity, which among other attempts, were missed by Frank Lampard’s side.
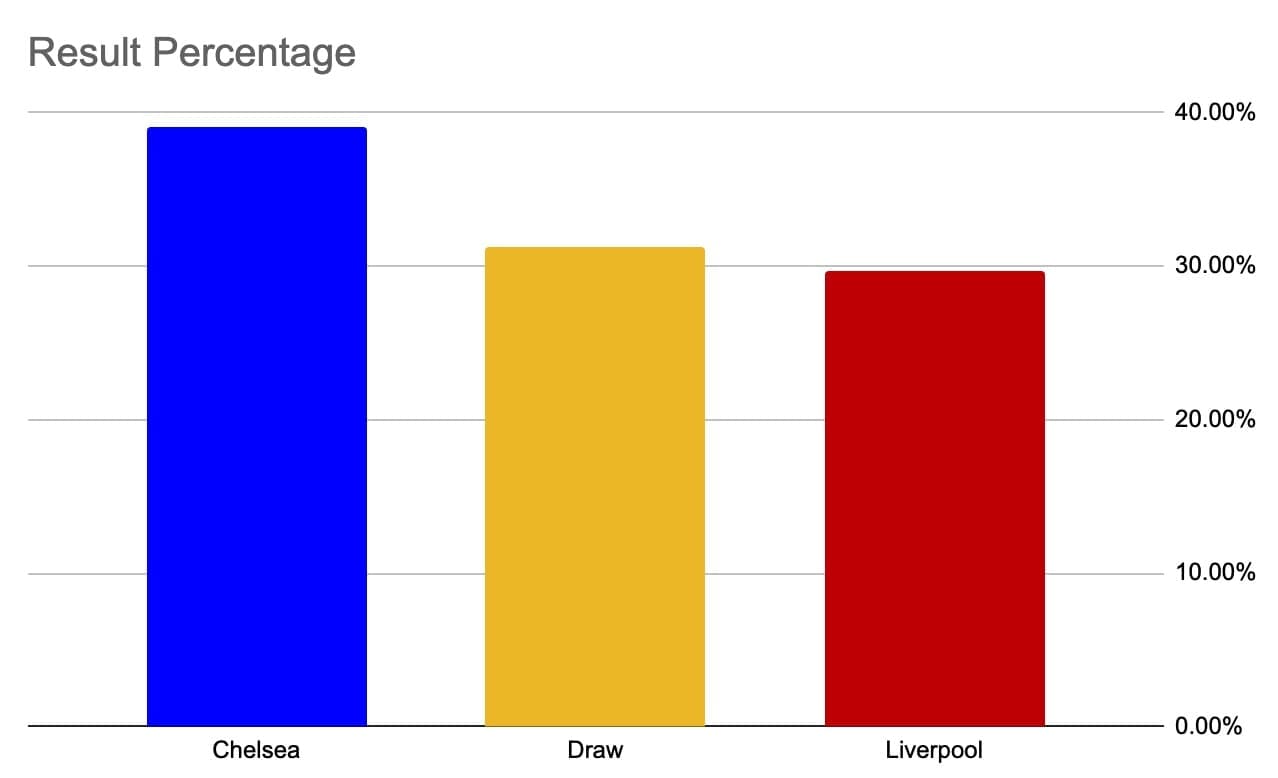
Based on the chances, Chelsea would expect to win 39.07% of matches if they were replayed identically. 31.24% of the time the result would be a draw. This means anything other than a Liverpool win occurs in 70.31% of the matches.
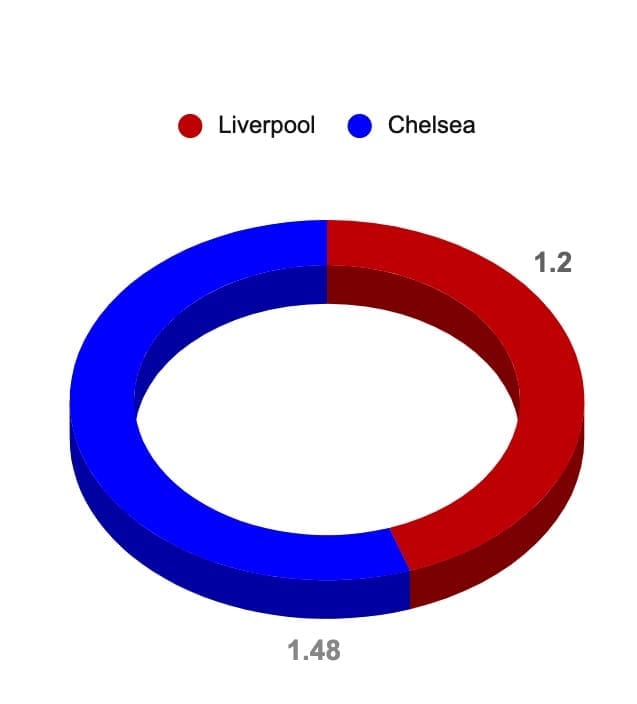
We can see from the above visual that as a result, the xPTS differential for Liverpool is -1.8. On average they would expect to win 1.2 points, instead, to Klopp’s delight, they took all three.
Liverpool vs Man City (10/11/19)
xPTS Differential: -1.76
Perhaps the most significant xPTS differential comes from Liverpool’s crucial game against their title rivals Man City. At this stage of the season, City were six points behind Liverpool who had racked up a massive 10 wins out of 11, putting them on 31 points. Despite just 11 games played, the match was earmarked as a must-win for the reigning champions, with a potential nine-point deficit looking too big of a gap to bridge.
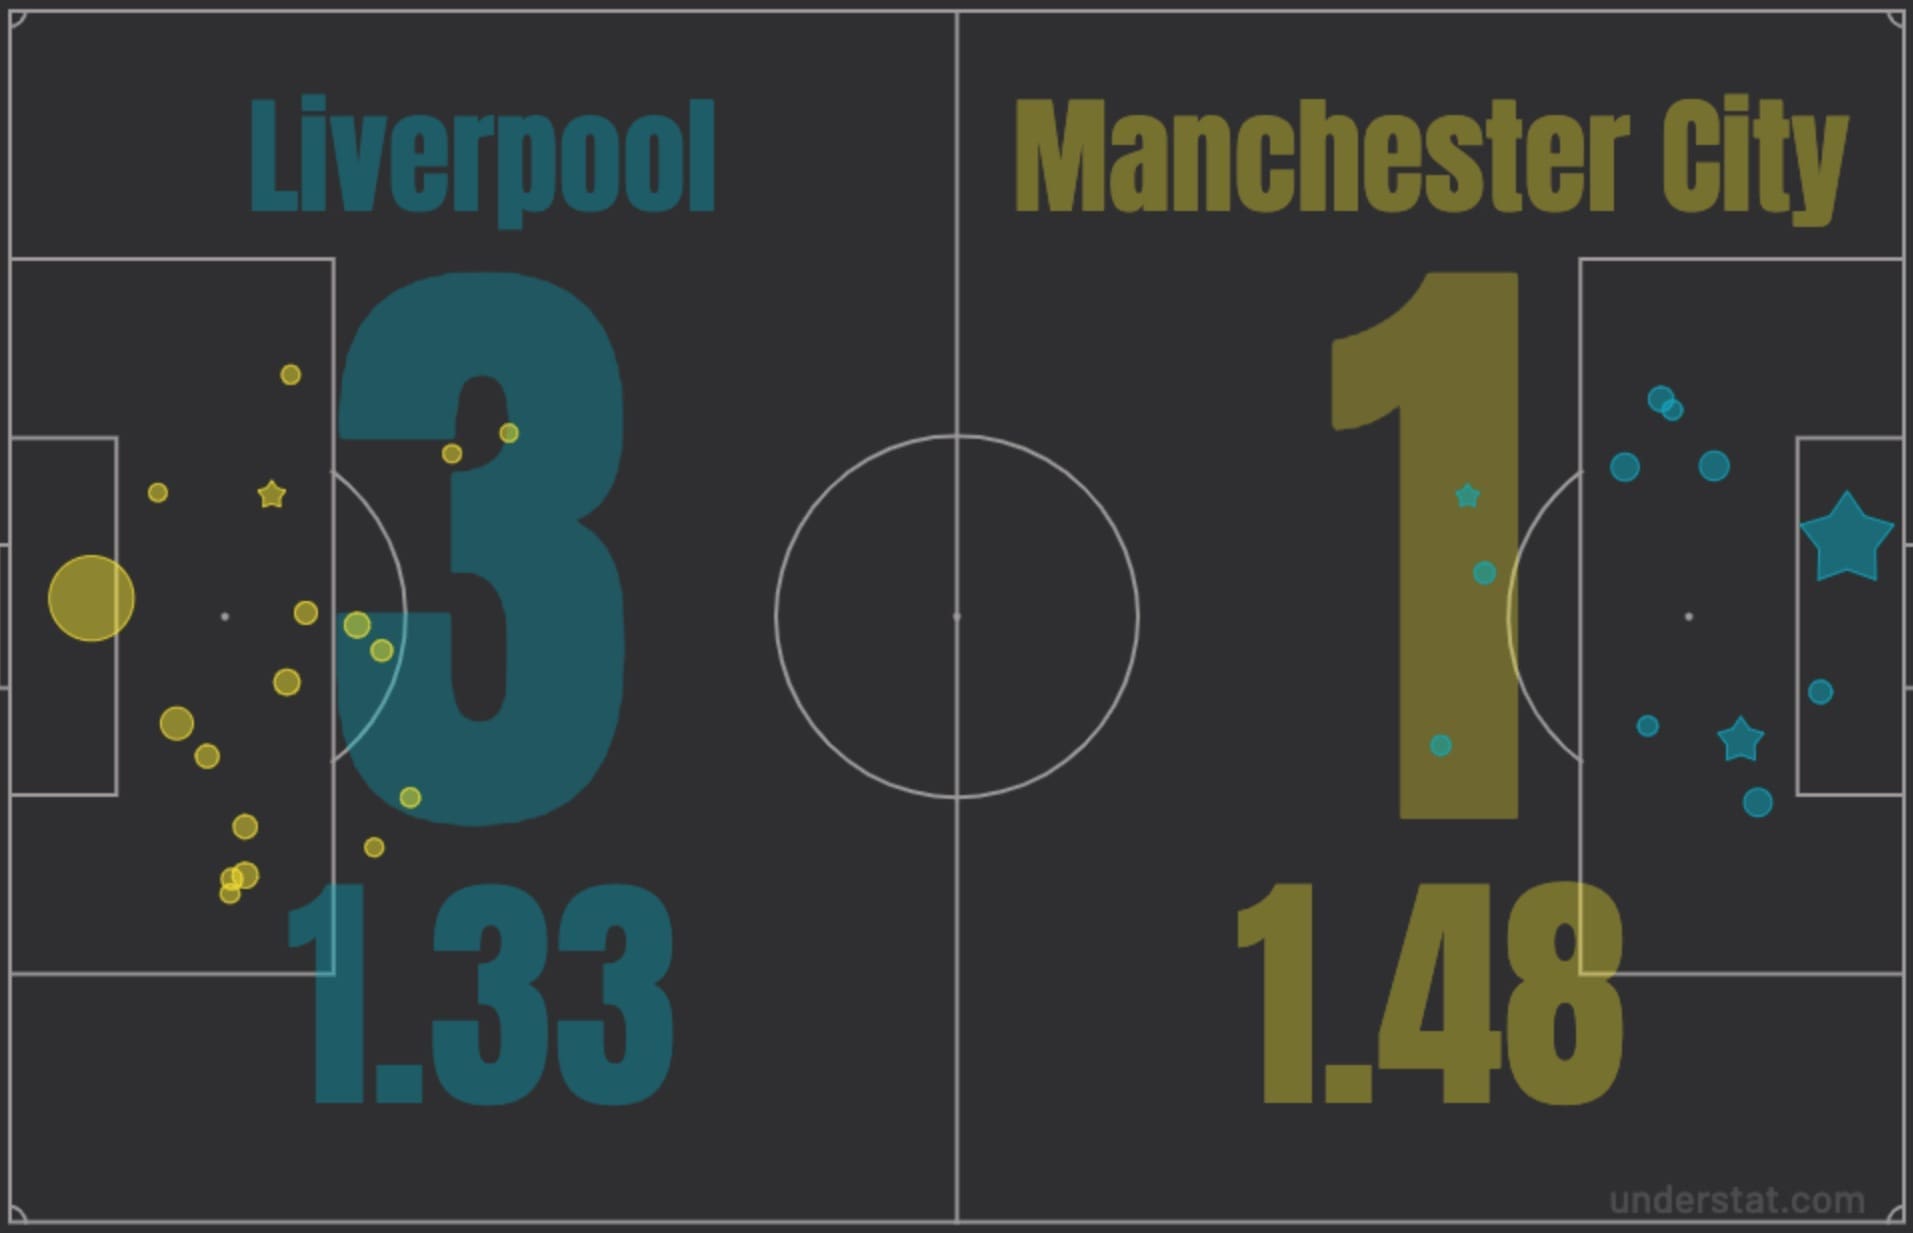
The game was played at its usual pace, with chances coming at both ends. Liverpool ended the game with three goals, despite an xG of 1.33. Man City, on the other hand, finished with just one goal registered even though they amassed a higher xG of 1.48.
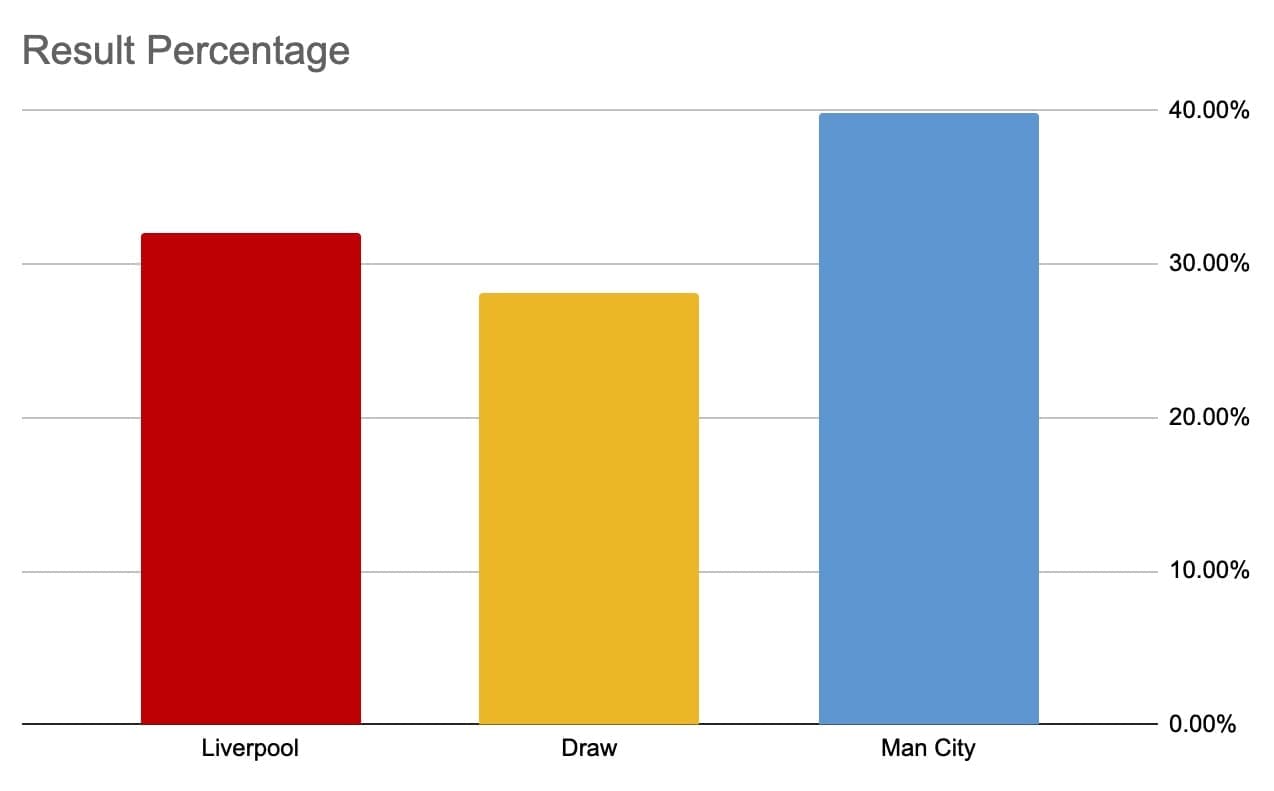
Again, plugging the numbers we can see that the chance of a Liverpool win outright is just 32.06%, making the chance of them not winning 67.94%. That amounts to roughly just one in three times would we expect to see a Liverpool victory and yet, the Merseysiders finished up with all three points.
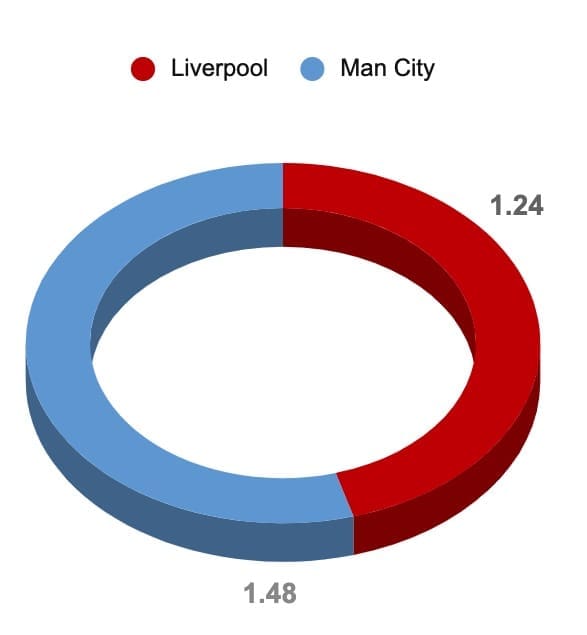
The xPTS demonstrates another sizeable differential achieved by Liverpool. This time The Reds achieved 1.8 points more than expected based on the quality of the shots in the game.
So having picked three of the games that have helped towards Liverpool being a whopping 20.01 points above their xPTS, we can do a quick calculation to see the percentage chance Liverpool had of winning the three selected games. As all three games are isolated and not dependant on each other, i.e. Liverpool winning one match doesn’t affect their ability to win the next, we can just multiply the percentages to reach the desired figure.
Game 1 Liverpool Win % x Game 2 Liverpool Win % x Game 3 Liverpool Win % = % Chance of victory
23.37% x 29.69% x 28.16% = 1.95%
Above we can see and have proved that the chance of Liverpool winning all three matches, based on the xPTS calculations is a startlingly low 1.95%. Despite this, Liverpool took nine from nine as they continued in their pursuit for a long-awaited title.
Closing Remarks
It would be ludicrous to conclude that Liverpool’s (probable) title-winning season is purely down to luck. The club is structured to perfection, with all parts of the club’s hierarchy moving in synchronicity, which is translating seamlessly onto the pitch. On top of this, their manager, leader and mentor, Klopp, has spearheaded a change in football style which now puts them amongst Europe’s elite. The squad is blessed with world-class talent, established and upcoming, all resulting from a slick transfer policy underpinned by finding value. All of this in concomitance with a never-say-die attitude currently makes Liverpool the best team in England.
That being said, to ignore a -20.01 xPTS differential would also be naive. Amongst the domination, we have proved that at times, like any other title-winning team, Liverpool have ridden their luck – more than any other team in Europe this season. Any football fan that chooses to put blinkers on and ignore that fact – supported by pure mathematics – will never be able to truly appreciate the glory if they can’t acknowledge the fortune along the way.



Comments