Trends and patterns are the one constant thing in an ever-changing world. People, dogs, and birds all show trends. One of the primary jobs of data analysis and the use of statistics is to discern these trends and patterns. The MLS in the past few years has shown tremendous growth as a league, developing their players and managers. This all was seen rather beautifully with LAFC who played a possession-based football that even Manchester City’s Pep Guardiola would be jealous of.
It pays dividends to track trends and that is exactly what will occur in this article. In this data analysis, through the use of the data, the statistical trends in MLS will be shown. For this analysis, we’ll be peeling back to the year 2015 season to get a useful context for any patterns or outliers we will observe.
Setting the Reference Guide
Before we continue, we need to establish some basic guidelines and in addition to that, analyze the MLS 2019 season as it is the latest season and represents MLS’ evolution.
Advanced metrics used to analyze recent seasons are not available for the past years so I have done my best to gather as much data – WyScout, FBref, and WhoScored. There will be some gaps in the data as looking back that many years is bound to turn up some inconsistencies. In light of this, I’ll be looking over a few areas, namely – league styles and goal-shot trends.
Without further ado, let’s analyze the 2019 MLS season first. This analysis is particularly important because it is the one where we have the most data and is the successful evolution of a change in the MLS. By getting a defined picture here, we can easily pick up trends when we start showing the previous years.
For the following analysis, we’re going to conduct a PCA (Principal Component Analysis) of the midfielders in the league. The reason for this as the midfield is the one position where the players give a good indication of a league’s playing styles.
What a PCA allows us to do is look at different statistics and find different groups that correspond to different statistics. For example, Bayern Munich’s Thiago Alcantara will record more forward passes and be involved in buildup passing than Manchester City’s Riyad Mahrez who’ll get more dribbles and crosses. It’s a smart way of analyzing statistics and figuring out styles. The purpose of this PCA is to get an understanding of the style of the latest version, complete version of the MLS. This, then, allows us to see the change over the years.
A total of 17 statistics – defensive, attacking, and passing – were used. Here were the results.
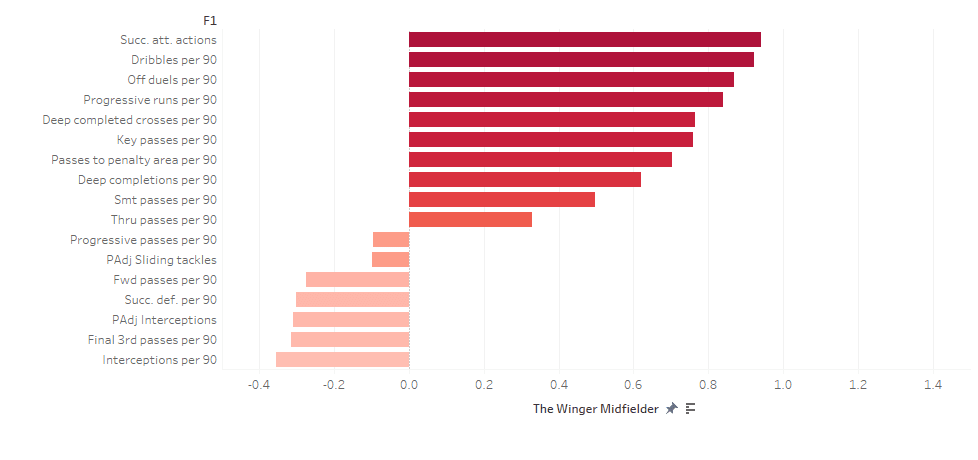
Here we see the first category – the midfielder who plays wider and is involved in the attacking phases. I’ve labelled this midfielder the Winger Midfielder as this midfielder shows traits of a winger. We see this with statistics such as successful attacking actions, dribbles, offensive duels, progressive runs, and deep completed crosses lighting up the most. In essence, these types of midfielders are much more active, are actively taking on their man, and getting many balls in the box through wide and narrow areas.
Conversely, we see other statistics such as final third passes per 90 and defensive statistics showing a negative correlation. This means that these types of players do not put up great defensive statistics or great buildup-play type of passes. This makes sense as they are playing much higher up the pitch and are involved in the ending actions of the team’s attacking play.
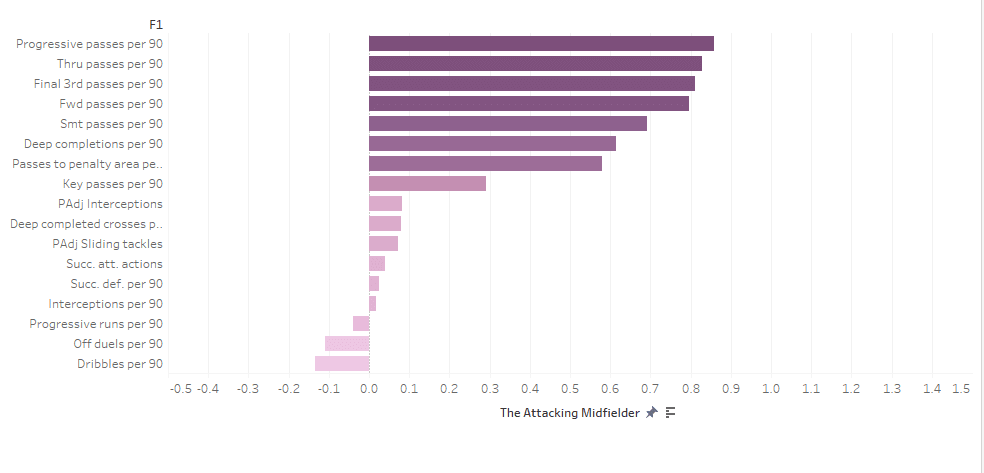
The next category is the Attacking Midfielder. We can see a great highlighting of a great many attacking statistics – the chief being progressive passes, through passes, final third passes, and smart passes. This is the type of midfielder that links the base midfield with the attackers and forwards – helping in attacking buildup play. He is not as attacking minded as the Winger Midfielder and rather occupies the central attacking buildup play.
As such, we see our defensive statistics light up as well – with light correlation – indicating that even while they are attacking midfielders, these types of players are also putting up some defensive effort that is noticeable and more than just pressing.
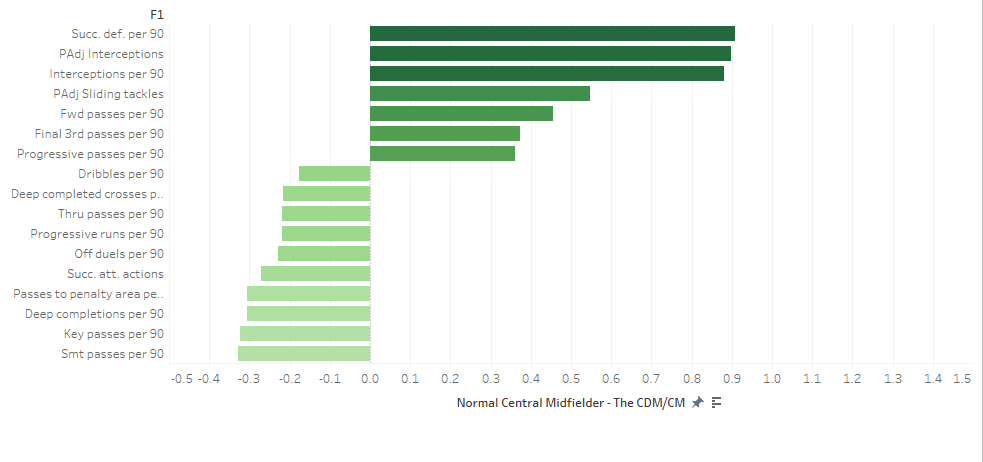
Lastly, we have the normal central midfielder – the normal central midfielder and the central defensive midfielder. This type of midfielder, in the MLS, is characterized by great defensive statistical performances as seen with PAdj interceptions – interceptions adjusted to possession to be fair to all styles of players – and successive defensive actions per 90. Also, we see standard buildup passing statistics being performed greatly in – forward passes and progressive passes highlight these.
These types of midfielders are involved in the base of the attacking play and don’t perform great in the more attacking sense as we see with statistics such as smart passes and key passes being greatly negatively correlated.
So now we have a feel about how the MLS, loosely, is. We’ll analyse later how later leagues compare with this midfield style of the current MLS. For now, it seems that the MLS has become a league where many players are putting up very strong advanced attacking metrics.
In light of this fact, it does us good to analyze the other end of analytics: measuring proficiency. This involves looking at things that players and clubs do that are much more apparent in their involvement in winning and losing.
Charting Proficiency Through the Years
We’ll first start at goals – the most basic metric of a player, a club, and a league. Analyzing it, along with other statistics, can shed our light on what the league has gone through.
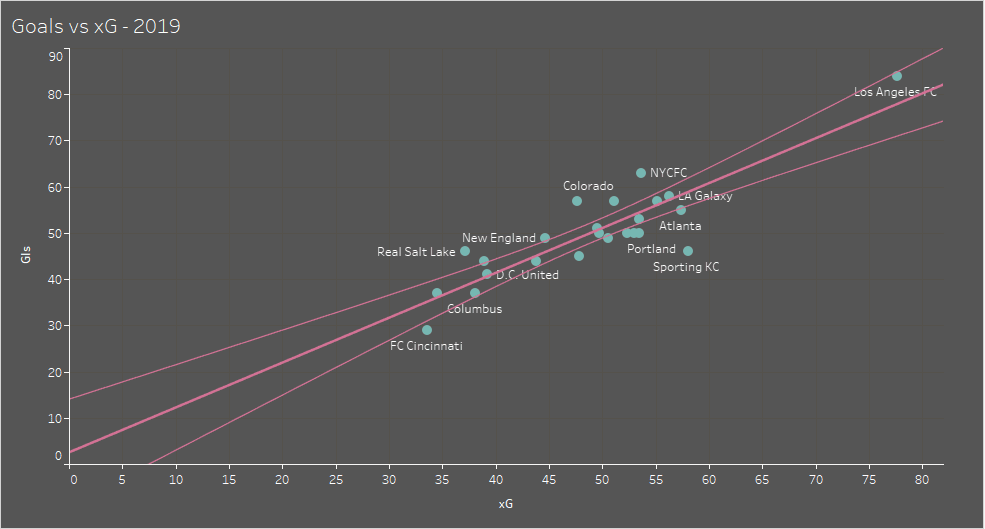
Here we see the plot between goals scored vs the team’s xG for the 2019 season. In addition to plotting, I have done a linear regression shown in pink. A linear regression shows us the correlation between two variables. It allows us to know the strength, the direction, and the equation for the association.
In this case, the linear regression is relatively strong meaning that higher xG equals relatively high goals scored as well. Additionally, it is positive meaning that the higher xG you have, the higher the goals scored. Moreover, the equation – slope – of the line is 0.9706. Let’s break this down.
This number means that there is almost a 1 by 1 correlation between the two variables. Getting an xG of 40 over the season will typically mean that the club scored near 40 goals. However, there is a slight problem with this number. We have a great outlier – LAFC – which separated itself from the pack by a big distance.
Removing this outlier will tell us about how the general clubs performed. Removing LAFC, we get a slope of 0.82. It’s not the same 1 to 1 correlation but its close.
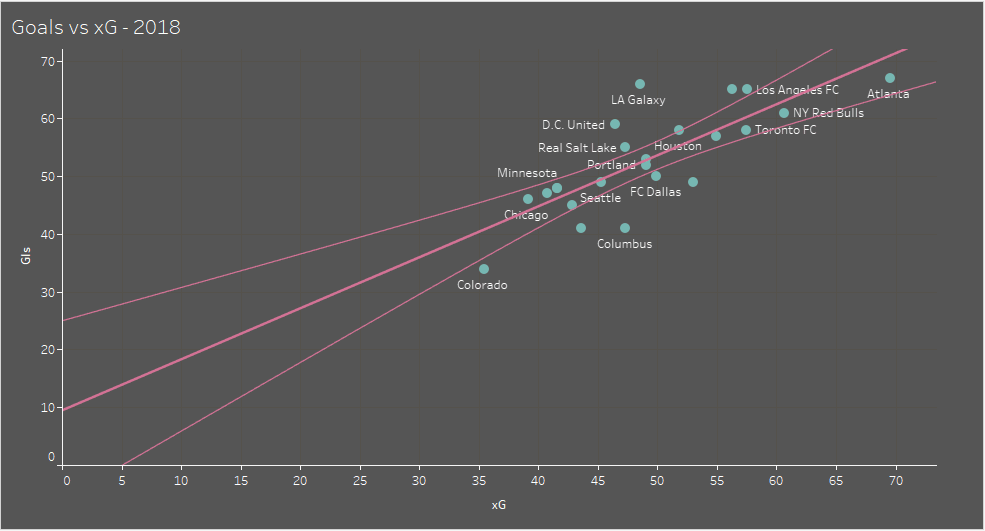
Here we have the same plot but for the 2018 season. This time, we get a slope of 0.85. This is close to a 1 to 1 correlation between goals and xG and is close to the correlation that we saw in the 2019 season.
At first, it looks like the league, as a whole, didn’t improve that much in their goal scoring. However, if we take out the outlier – Colorado – out of the data set, we get a much better picture. The slope, for the 2018 season, drops to 0.76. In context to the slope of the 2019 season without its outlier – 0.82 – shows a great goal scoring improvement in only one season! The majority of the league went from converting 76% of its xG to goals to 82% of its xG to goals!
Was this always the case for every year? Unfortunately, I did not have access to detailed xG/xA data for the years 2015, 2016, and 2017. However, I charted other metrics that allowed me to get to similar conclusions without the detailed xG data.
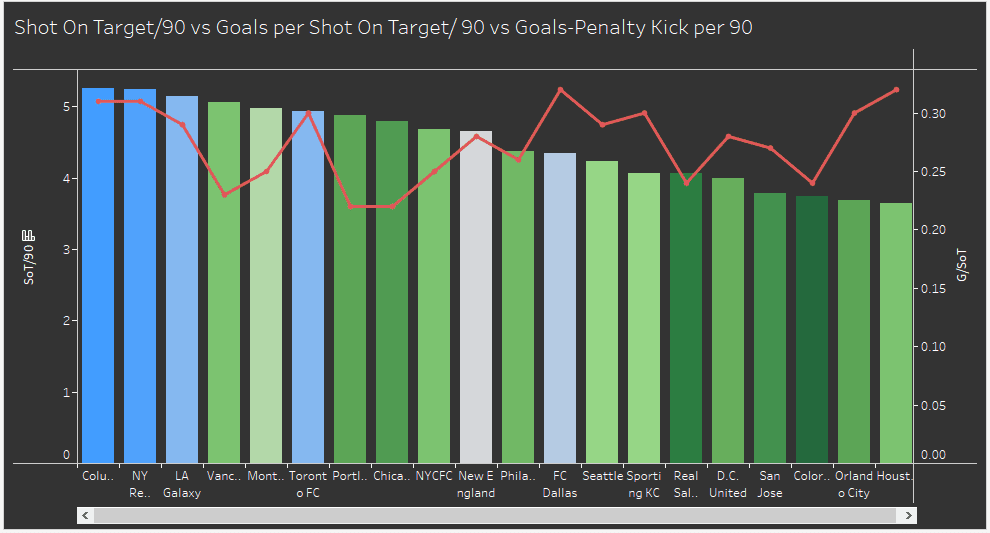
Here is a bar and line plot for the season 2015 that charts Shots on Target per 90 (SoT/90) and Goals per Shots on Target per 90 (G/SoT). The former is shown in the bars while the latter is shown in the line graph. Lastly, goals minus penalty goals per 90 (G-P/90) is shown in the colour with blue showcasing higher numbers while the green shows lower numbers in this statistic. The G-P/90 is an important statistic as it informs us how many goals the team created – with an emphasis on creation. By taking out penalties, we get to know the actual goal-scoring trend of teams.
Here we have a general correlation with shots on target per 90 and goals minus penalty goals per 90 as we see NY Red Bulls and Columbus Crew showcase high shots on target per 90 with their bar graphs being the most blue. This trend goes for the poorer teams as we see with Orlando City recording low shots on target per 90 and goals minus penalty goals per 90 as they have a green colour. This makes sense as the more shots you get on target, the higher your chances of scoring.
What doesn’t seem to be as correlated is the goals per shot on target per 90. The poorer the teams go in their SoT/90 is, the higher the G/SoT seems to be. This is especially the case with Houston Dynamo which records the lowest SoT/90 but the highest G/SoT. While at first counterintuitive, it does make sense if we see how teams operate.
Teams who are recording low SoT/90 are generally not good at developing shots and the final results. Due to this low number, the number of goals will make the G/SoT inflated as they are goals from an already low number of shots. As such, we see that there is an inverse relationship. These teams are not as “wasteful” as they generate few shots already – they have to be clinical or else they’d won very few games!
Let’s take a look at how this improves over the 2016 season.
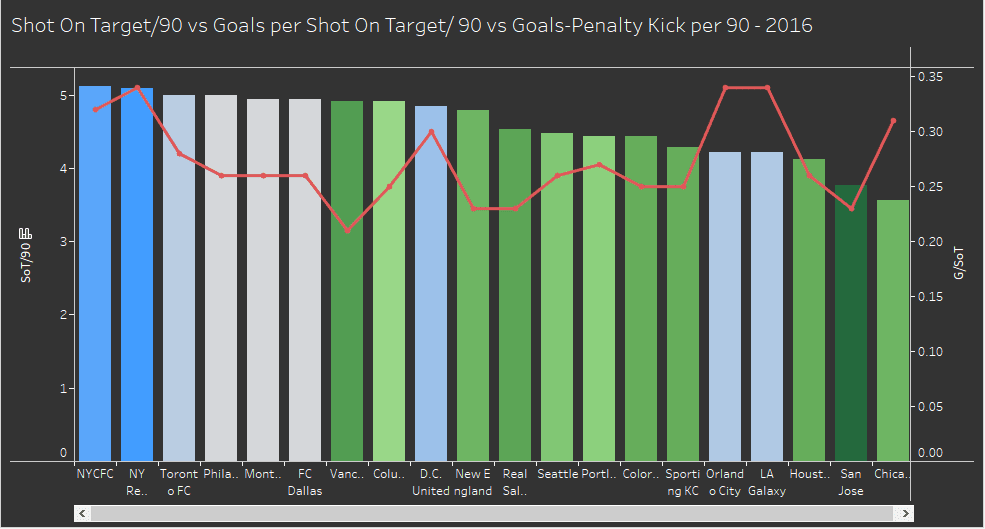
Quite immediately, we see a league-wise increase in the SoT/90 statistic – especially in the middle 50% of the league. In addition, the G/SoT of the league also improves quite a bit. There is still an inverse relationship but it is strengthened overall. Whereas in 2015, SoT/90 greatly informed how many G-P/90, it seems to do less in 2016. We see more teams recording better G-P/90 while their SoT/90 remains at an average level.
Interestingly, we see two spikes at Orlando City and LA Galaxy. These teams recorded fewer shots on target per 90 yet scored many goals per 90 minutes. This is seen as their G/SoT is the highest in the league.
Looking at historical data, we find that LA Galaxy – that season – had American legend Landon Donovan as their forward while Orlando City had no other than formerReal Madrid’s player Kaká which explains a lot as to why these teams were able to perform strongly in their shot-goal data.
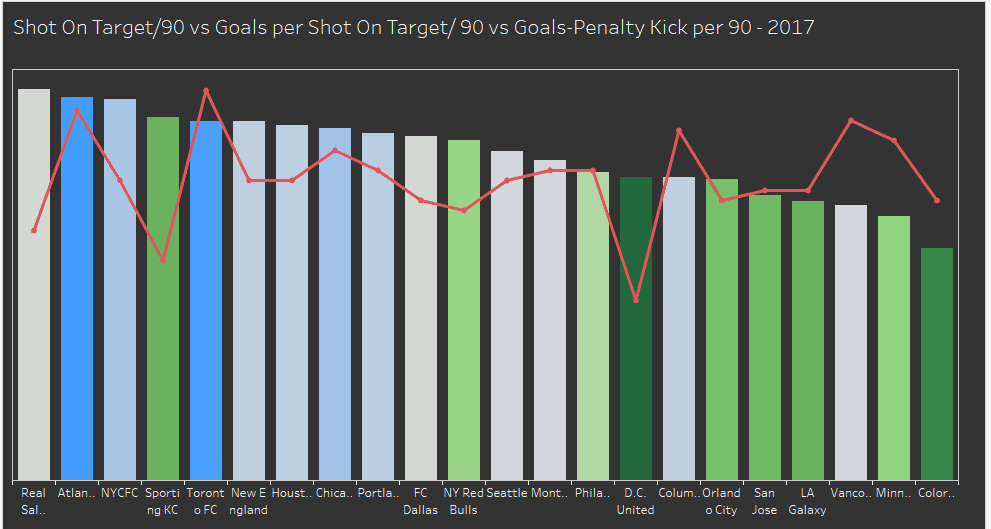
The trend of overperforming on their G-P/90 based on your SoT/90 takes centre-stage. We see many teams that would normally be “green” based on their bar-length turning towards blue. This means that more teams were performing better with their shots – recording better goal statistics. G/SoT does seem to have changed by a large amount however the variability in the data certainly does increase.
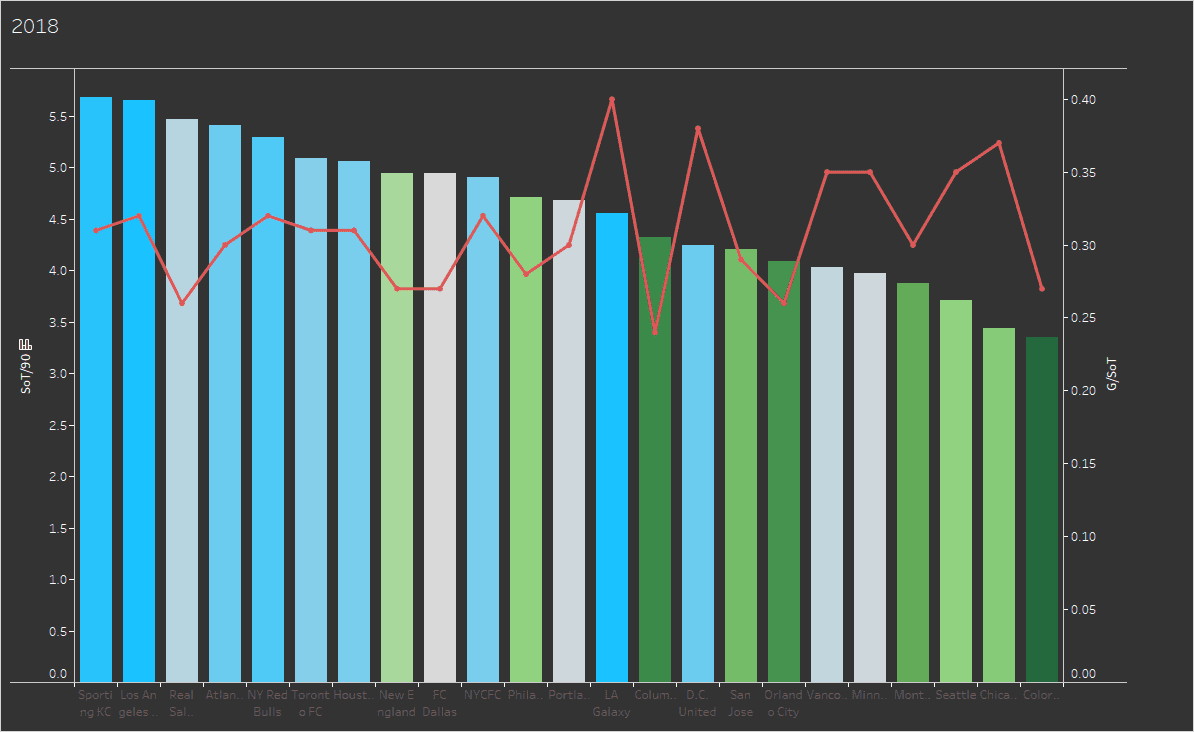
With the 2018 – we see the continued trend of overperforming on your G-P/90. More teams are performing better with their shots on target. What’s interesting is the trend of G/SoT – we see a very distinct inverse relationship. Teams like Toronto FC record near 0.30 G/SoT per 90 while the likes of Seattle Sounders record 0.35 G/SoT per 90.
We also see another trend developing – teams that over-perform in their G-P/90 that are poorer in their SoT/90 generally have better G/SoT. That was confusing so let’s break it down: teams that are scoring more goals than their shot expects them to do are making sure that each shot is more important. In other words, these teams are being very clinical. We see two spikes of this – LA Galaxy and D.C United.
Looking into transfer data, we see that LA Galaxy, in the 2018 season, got none other than Zlatan Ibrahimović. Ibrahimović is the definition of clinical which explains why – despite having average shots on target – Galaxy were able to score many goals per 90. Similarily, D.C United had Manchester United legend Wayne Rooney as one of their forwards which goes a long way of describing their statistical overperformance.
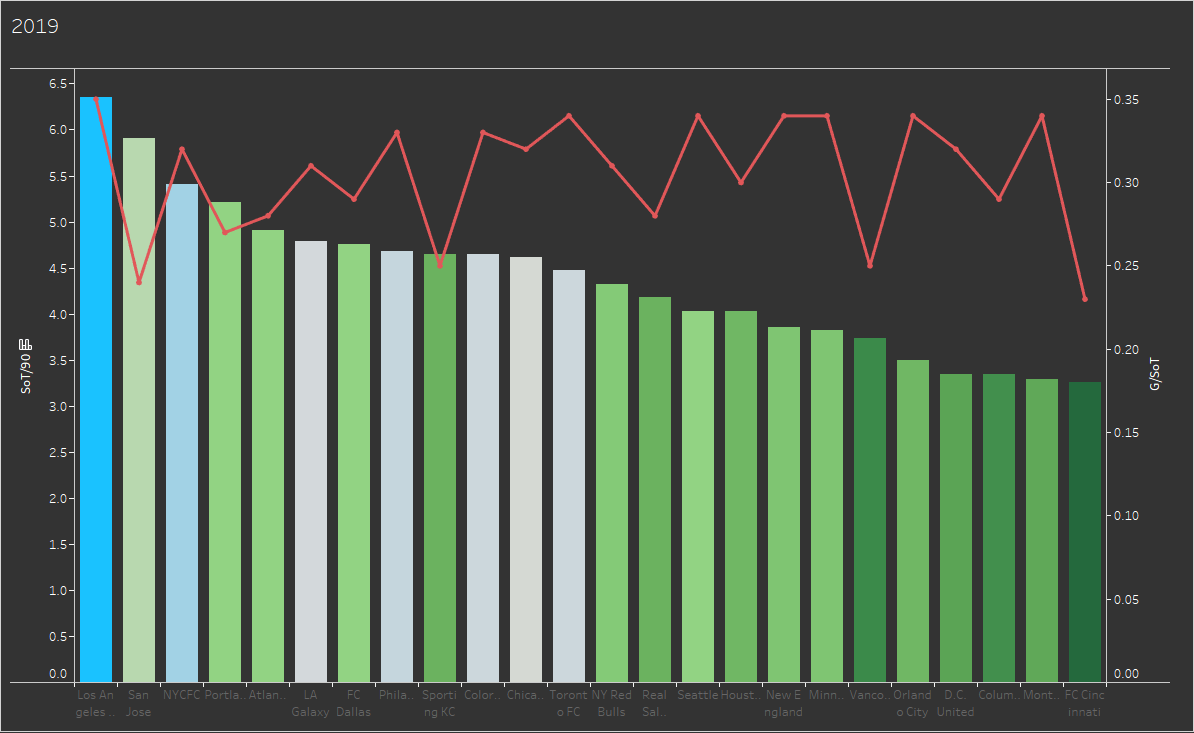
Interestingly, in the context of the data, the 2019 season is more of an outlier. While we saw in 2016,2017, and 2018 overperformances in goal scoring and attacking-wise poor teams being more clinical, in 2019 season we see the opposite to some extent.
First of all, it seems that SoT/90 does not define how many goals a team can score. We see various teams underperforming – shown with green colour – despite putting up higher SoT/90 numbers than in the past as is the case with Portland Timbers, Atlanta United, FC Dallas, and many more. In addition to that, we see massive overperformance on G/SoT for just about every team outside the top five.
Looking at historical data this time reveals very few superstars/world-class finishers among these squads.
While 2019 is certainly a blip – it seems to be a good blip as many of the attacking-wise poorer teams seem to have gotten much more clinical and that could down to be natural talent or good coaching – either option is a good indicator of the how the MLS has grown. Whereas in the past, the teams being clinical was limited to teams with superstars – now the trend seems to be almost universal which is a very good sign for the development of the league. Now, while the poorer attacking teams are not getting as many shots on target, they are making sure to make them count.
While seasonally wise, this doesn’t mean a lot – this ability to be clinical can have massive impacts from game to game aka upsets. Perhaps the best case happens to be with Seattle Sounders. The Sounders sit at 15th in SoT per 90 and did not record a lot of goals. However, their G-P/90 is the highest in the league. It was this ability to be clinical, along with other factors, to defeat LAFC, ranked first in SoT/90 and G-P/90, and pull off the biggest upset.
Looking into styles through the years
So clearly, the way clubs shot and their statistics regarding them has improved over the years. Before it used to improve due to the presence of a superstar but as the league has gone through the years, it has gotten down to scouting, developed talent, and good coaching – all hallmarks of a great league.
This is also reflected in the more raw statistics such as goals scored and assists over seasons.
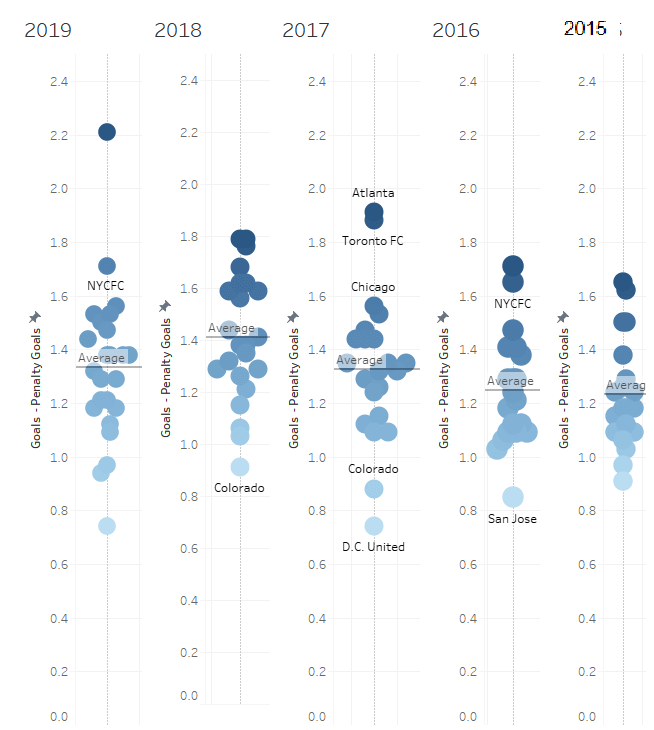
Here we see the goals scored minus penalty goals over the seasons. Comparing the distribution over the years, we see that the distribution of the clubs – save for 2019 – does shift forward for the majority of the clubs indicating that the clubs are getting better and tougher to beat. We see the average going up and up save for – again – 2019.
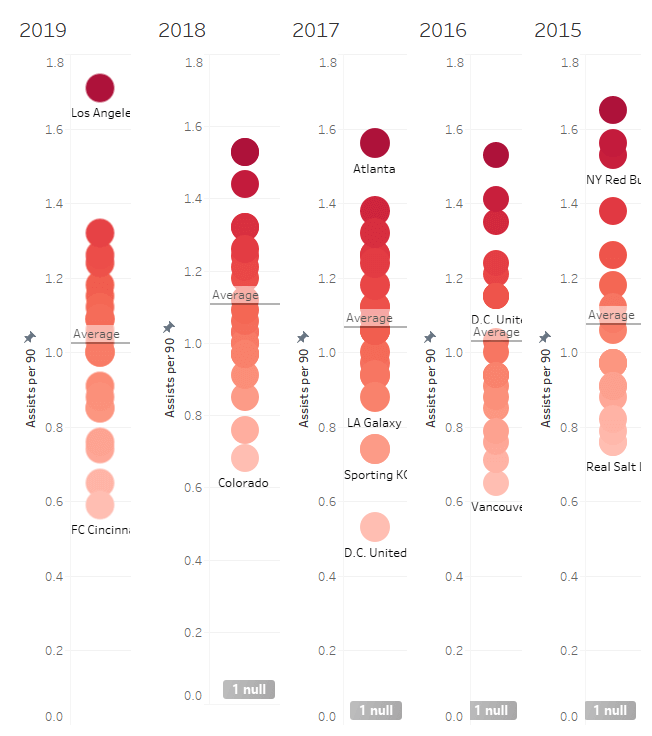
Here we see the assists per 90 over the seasons. Yet again, the average assist is increasing indicating that clubs are also getting better at chance creation for their forwards. Moreover, the distribution shifts upward together indicating that this improvement is happening to all clubs.
To end this analysis, we’ll look at the PCAs of midfielders in LaLiga over the years to see how the style ended.

Here we see a PCA of the 2015 midfielders. There is a limitation here – we don’t have as many advanced statistics. However, the metrics we do have provide a succinct summary of the first type of midfielder. This midfielder is the robust, no-nonsense midfielder – being defensively sound and attempting many long balls.
This type of midfielder doesn’t that play many short passes, takes on his man, nor makes many key passes. This is the type of midfielder that was occupying the MLS frequently. While our statistics are not accurate measures of creativity, negative correlation in metrics such as short passes and dribbles indicate that this type of midfielder was more focused on launching it forwards rather than being involved in intricate pass play – the likes we see with the midfielders in the 2019 season.

Here is the second type of midfielder that the PCA yielded – an attacking-minded, hybrid midfielder. We see this midfielder making many short passes along with defensive actions relatively well. This midfielder also makes key passes while dribbling wasn’t a strong point of this midfielder.
While this midfielder holds the characteristics of the robust midfielder, this player also has a high number of short passes and a good number of total key passes. While these metrics aren’t the strongest in assessing attacking style, they provide a good indication of how midfielders operated – involving in short passes but not amounting anything potent and creative on a consistent basis.
We see the evolution of MLS midfielders. In 2015, the midfielders are relatively straight forward, value defensive solidity, and are not very expansive dribblers. This, compared to 2019, is a complete contrast and shows just how much more attacking, more expansive, and more talented the league has become. In 2019, as we saw with the PCA, midfielders were much more inclined to be more expressive in attack and had high correlations indicating great effort in these metrics.
Conclusion
We have clearly through the extensive use of data and statistics that MLS has changed for the better. Teams are much more clinical, are averaging more shots on target and generally more goals. In addition, the midfield profile of the MLS has changed drastically – from midfielders who added little creativity to two different types of creative midfielders who each add a different aspect to the game.



Comments