2020 was destined to be a great year in football with the Champions League matches getting more refined and the lieu for fourth place in the Premier League getting more and more slippery. In the midst of a great season, the whole world was hit by COVID-19 which caused everything from an outbreak to a global pandemic.
With nothing but time on our hands, it is time to return back to good old America and probe deeper into the MLS. While the European leagues got a lot of attention, Major League Soccer had recently concluded another glorious season and started their 2020 season. However, with the closure of the league due to the pandemic, an analysis of four games is redundant.
However, what can be done is to look at the 2019 season. In this mini-series, I will be looking over the 2019 MLS season and picking the statistically best players. A season full of data and statistics will be analyzed for all spots to find the statistically best players in every position. The aim at the end of this mini-series is to find some hidden gems and repolish some bright diamonds.
In this tactical analysis and data analysis, we will look find the statistically best defence in MLS. In this analysis, I will be picking the statistically best goalkeepers and centre-backs through data.
Formation and Style
It is always hard to pick the best player from a league. Why?
Simply because players play in different styles. Some tactics allow a player to flourish while others keep them pigeon-holed in a tradeoff for defensive stability. Either way, it is always hard to pick the best player. To make this process more rational, I have decided to set constraints on the formation and the type of player. For each article in this mini-series, I will lay them out as so you know what type of player are being looked for.
The general formation is a 4-2-3-1. This is simply because the experience that I’ve had with analysing teams in the MLS, there seems to be a trend for going to a 4-2-3-1, either in attack or in defence or in a transition.
For this article, there are certain characteristics that will be emphasised.
Goalkeepers: Apart from saving shots, I am deciding to pick an aggressive goalkeeper. This is because the general goalkeeper image is now perceived to be in the image of Alisson/Ter Stegen – the goalkeeper will have to be aggressive in his actions (punches, claims, etc). While there are claims for having a possession-happy goalkeeper, recent trends in other leagues have shown that it is best to start out with a goalkeeper who will definitely keep out the goals and then some.
Centre-Backs: Building off from the possession-model which is popular in MLS, the centre-backs need to be comfortable with the ball, have some creative vision, and be good defensively. One centre-back will be more attacking-minded while the other centre-back would be more defensive-minded. In general, both centre-backs will be defensively good and comfortable with the ball.
Additionally, the sample size for the data analyses will be players who have played more than 20 games. This strict sample is so that we are only considering those who have put consistent performances. Some restrictions are made here and there and those will be stated in the analysis.
Goalkeeper
Goalkeepers are the single-most critiqued position in the world. There is no chance for mistakes as a mistake is a goal in that area. Contrast this to the mistake of a striker which simply results in the dispossession of the ball metres away from the goal.
Apart from that, it is also the single hardest position to analyse through data. Simple metrics such as xG and xGA do not provide us with usefulness on the impact of the goalkeeper. Even tactical analysis through photos requires careful analysis of frames and frames of photos. What makes this analysis harder is that the single most important metric for goalkeepers – their ability to save goals – is almost impossible if you don’t have access to advanced analytics from the likes of Opta.
However, I have made a simple version of John H.D. Harrison’s analysis to find good goalkeepers from the bad goalkeepers. But in order to understand the mathematics, we need definitions.
Save Percentage is defined as out of the total shots on target, how many goals does he save? This is as a shot has a chance of becoming a goal so saving a shot from going in is the same as saying that a goal has been prevented.
Expected Save Percentage is defined as out of the total shots on target, how many expected goals does he save? Each shot has a probability of going in and this is simply a metric telling us what should be his save percentage if he actually conceded the goals he should have.
A simple way of understanding the two is through a screamer. The chances of a screamer are low of going in so your expected save percentage for that screamer is high. However, if you concede, your save percentage was zero because you let that shot become a goal. Doing this for all the shots in total, we get a total save percentage and expected save percentage for the season.
So now let’s put all those words in numbers which may simplify these two concepts.
Save Percentage (SP) = (Shots On Target Total – Goals Conceded)/(Shots On Target Total) x 100
Expected Save Percentage (xSP) = (Shots On Target Total – Expected Goals Conceded)/(Shots On Target Total) x 100
Now onto the complicated part. How do we define good goalkeepers with these statistics?
A difference between the actual save percentage and expected save percentage tells us how you performed. A positive difference means that you are conceding less than expected – this is what good goalkeeping looks like. A negative difference means that you are conceding more than expected – this is what bad goalkeeping looks like. Obviously, these statistics aren’t perfect however they are a good estimate.
There is another problem, however. We need to know if the goalkeepers are doing better with easy shots or hard shots. Ideally, we’d want a goalkeeper conceding less with hard shots. That’s ideal so the closer we get to that, the better. To quantify this, we simply use the Expected Save Percentage (xSP). A higher xSP means that the data shows you were expected to save more shots – you are facing easy shots. A lower xSP means that the data shows you were expected to save fewer shots – you are facing hard shots.
One final mathematics we need to understand is to what Goal Prevented is. It is simply how many goals a goalkeeper prevented. It is simply defined as:
Goals Prevented = Expected Goals Against – Goals Conceded
Positive numbers mean that you saved goals while negative numbers mean that you let in more goals.
With all that hassle, let’s finally analyze and see who are the good goalkeepers.
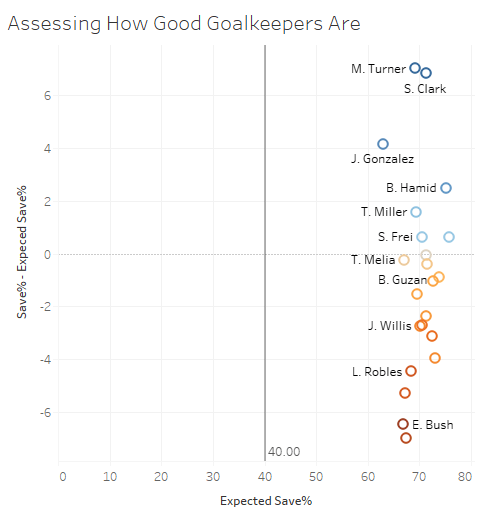
In this graph, (SP-xSP) are graphed on the y-axis while (xSP) is graphed on the x-axis. In addition to that, Goals Prevented is charted as a colouring aspect. Immediately we see the two good goalkeepers: Matt Turner from New England Revolution and Steve Clark from Portland Timbers.
All the MLS goalkeepers are expected to have a high expected save percentages however only Turner and Clark are actually the best at preventing goals. This is backed up by their Goals Prevented. Clark prevented 8.4 goals during the whole season while Turner prevented 8.21 goals. These are huge margins for Revolution and Timbers respectively.
A deserved shoutout is for Jesse González from FC Dallas who is actually facing the hardest shots at an xSP of 63%. However, that margin is too little of a deviation from the average scatter plot. However, he prevented a respectable 5.84 goals.
Having established the two goalkeepers who we want to keep an eye for, now we turn our heads to simpler analysis.
To quantify aggression, our emphasised trait, we will be measuring aggression through land and air.
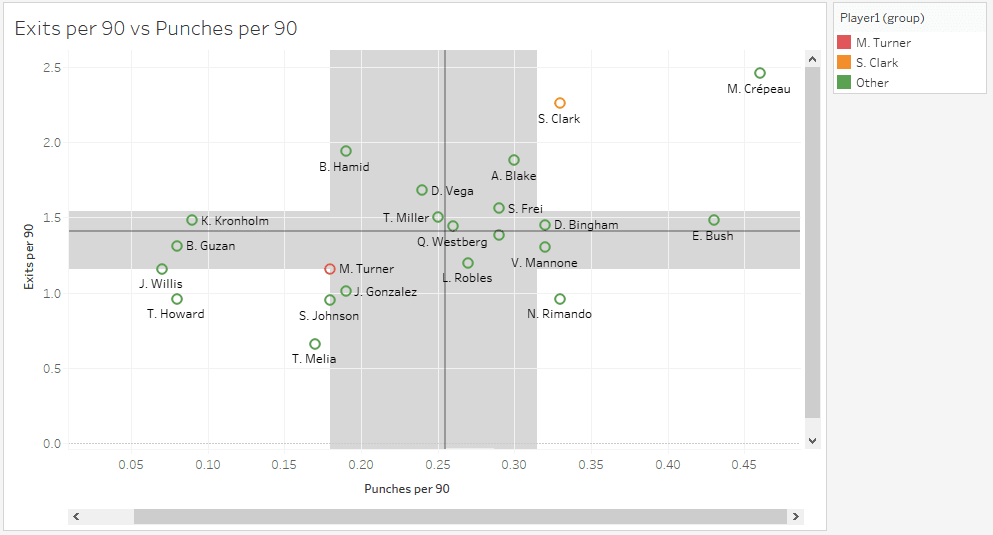
In this graph of exits per 90 versus punches per 90, both qualities that goalkeepers show in the ground duels (and some air duels). Clearly, Clark is the more dominant goalkeeper, punching 0.33 per 90 compared to Turner’s 0.18 per 90. Clark also has a better success rate, 33% compared to Turner’s 25%. Clark is also much better at exits per 90, coming out to be 2.26 compared to Turner’s 1.16. Clearly, Clark is better at controlling the situation on the ground.
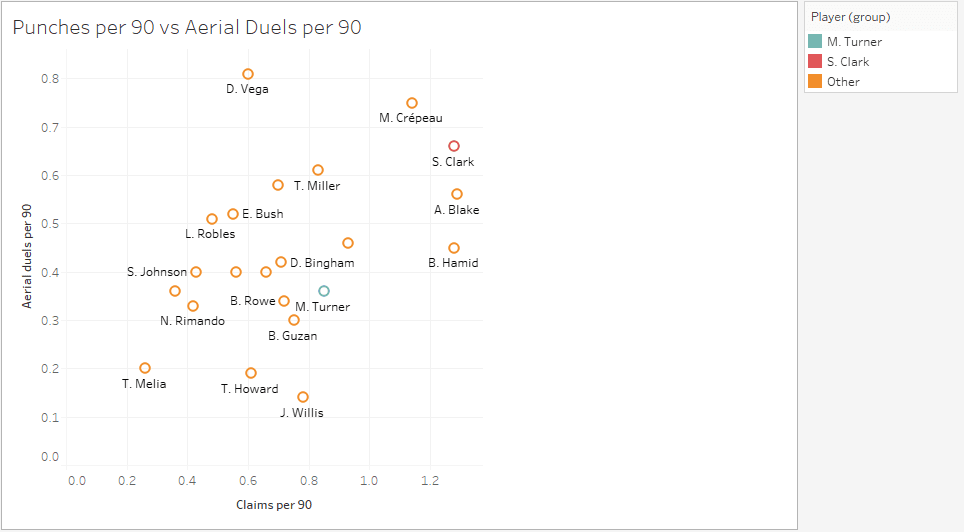
Here we see the aerial translation of aggression: aerial duels and claims per 90. Clearly, Clark triumphs Turner by recording 0.66 aerial duels per 90 and 1.28 claims per 90 compared to Turner’s 0.36 aerial duels per 90 and 0.85 claims per 90. Turner does record a better success rate at aerial duels, at 87.5%, but with a low aerial duel number, it does not make a significant difference.
In conclusion, the statistically best goalkeeper in the MLS for the 2019 season is Portland Timbers’ Steve Clark with the best goal-saving abilities and a statistical dominance in-ground and aerial duels and situations.
Centre-Backs: Attacking Centre-Back
Picking the two best centre-backs from a whole league is hard, as the process will show. So many qualities judge a player – some of which he/she can and can’t control. Moreover, as this is a strict data analysis, we are missing out on some of the tactical components. To be fairer to playing styles, which also differ, one centre-back is going to be more defensively focused while the other will be more attacking focused.
An important note on methodology needs to be stated: interceptions and tackles are not going to be the defining factors and in actuality, many different defensive factors will be considered in defining our defensive centre-back.
After many analyses and graphs, I arrived at the following four final candidates: Matt Besler, Eddie Segura, Leandro González Pírez, and Reto Ziegler.
Here are some graphs as to why they ranked highly out of all the centre-backs.
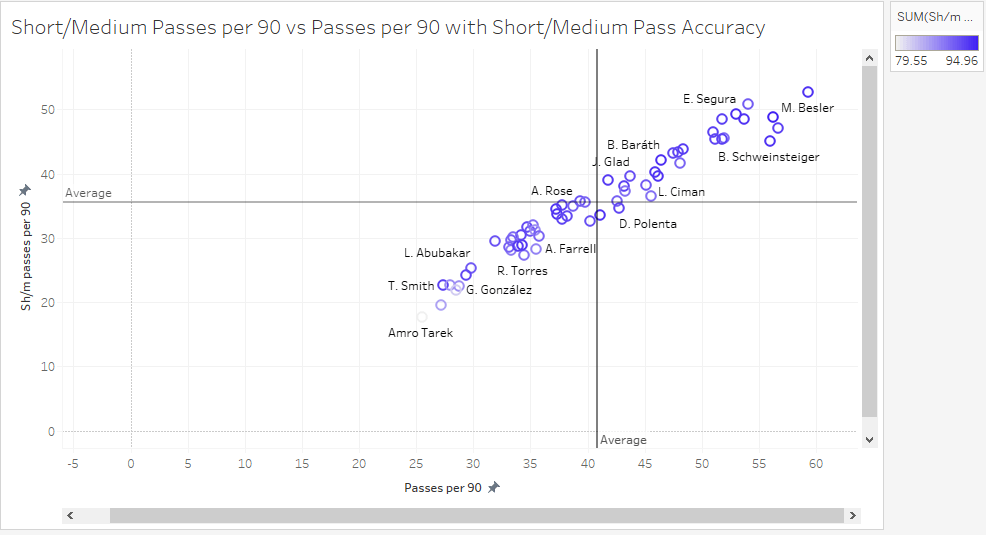
In this graph, we see Besler and Segura recording high passes per 90 and high short/medium passes per 90 respectively. Embedded near the top are also González Pírez and Ziegler. Clearly, these four centre-backs are not only recording a high volume of passes but a high value of them are short/medium passes. This indicates that they are suitable for a possession-game model which is what was required.
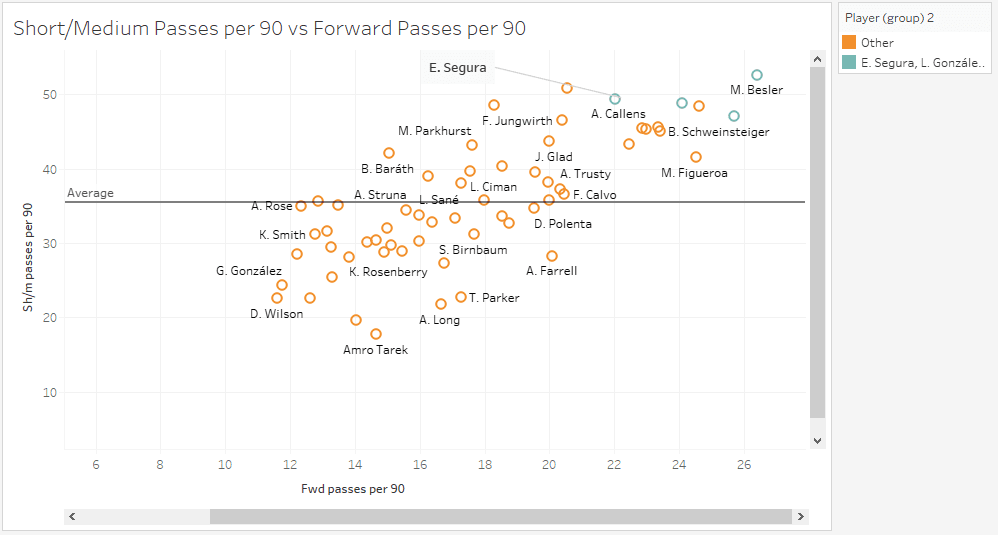
Here we see Besler, González Pírez, Segura, and Ziegler shown in green. Yet again, Besler marks himself out as a more voluminous forward passer per 90 while Ziegler and González Pírez come close Besler in those statistics. Segura is the least voluminous forward passer per 90 however he marks himself out with slightly better short/medium passes per 90 when compared to Ziegler and González Pírez.
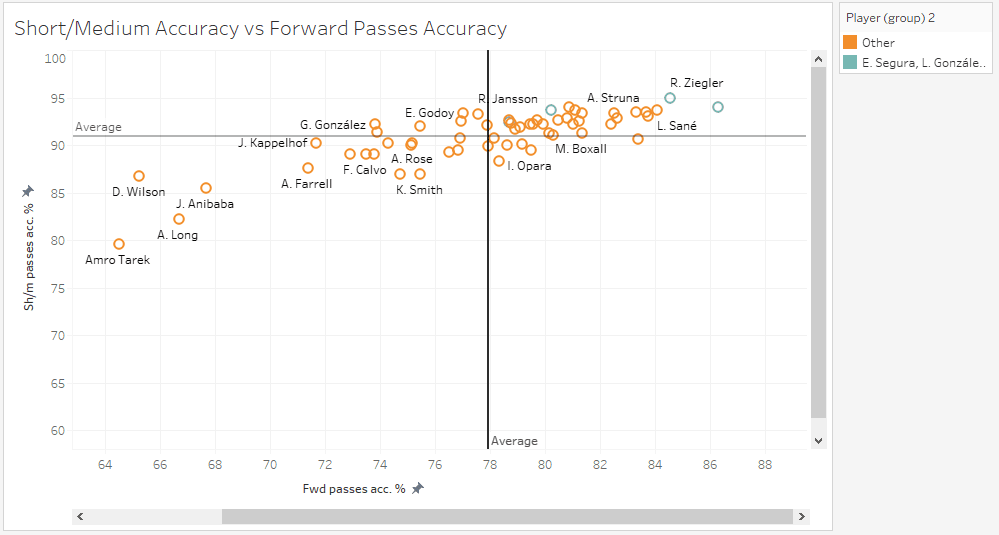
Here we see the four albeit with some more variation. The farthest most dot is Segura who marks himself out as the most accurate forward passer in the league while also being joint-accurate short/medium passer with Ziegler. Gonzalez is the third visible dot while Besler is near the average hidden by the other dots.
This is another good sign as we want our centre-back to be one of the best in the aspect of attacking and passing. For that to be the case, one has to be accurate in his forward passes and short/medium passes which is what we see in our four centre-backs.
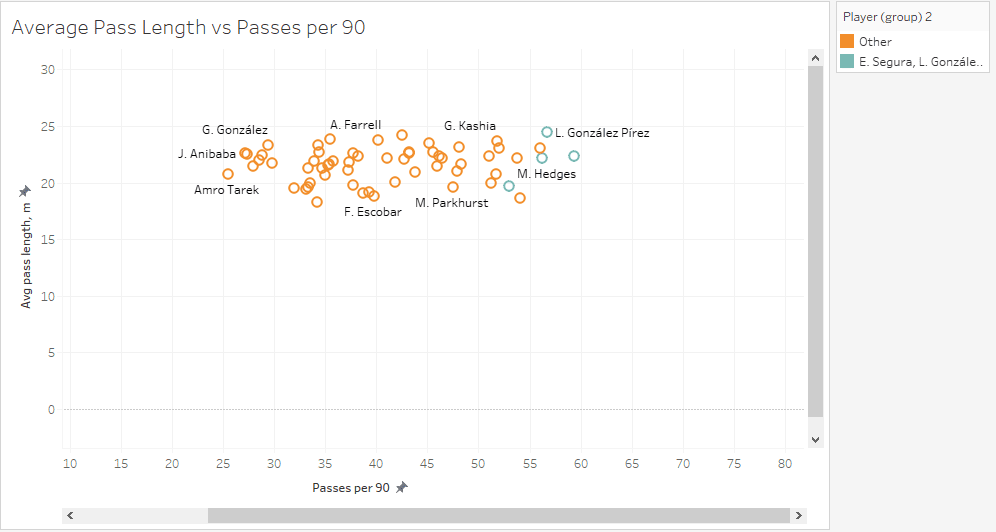
Finally, we look at their pass lengths. The lowest green dot is Segura which signals to us that he is the most proficient at playing short passes that are more in line with our possession-model. Gonzalez is a more long-distance passer while Ziegler and Besler align themselves on the average passing length.
Now we have clearly established that these four centre-backs are among the best at possession-football with their marked and fairly consistent statistics. To pick the best among these four centre-backs, we now must analyze each one among the small group carefully.
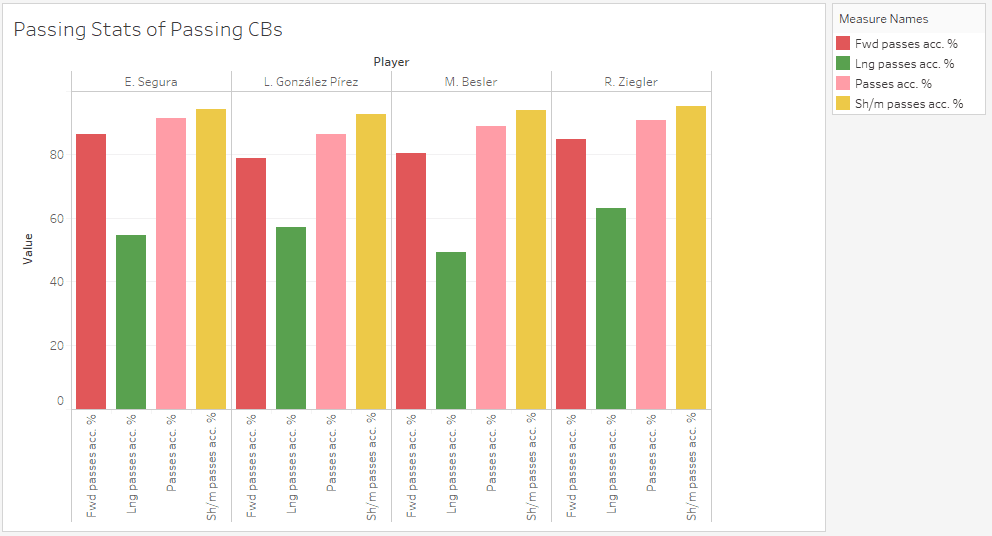
In this graph, we see that Segura records higher accuracy rate in forward passes, passes, and short/medium passes. Even though he is slightly behind his passes per 90 metric, a discrepancy of a few passes is not enough grounds to dismiss his accuracy rate as being from a sample. In this graph, we can see the first discrepancies that will lead us to pick or single centre-back. Clearly Segura is doing excellent in his accuracy for his passing and is complementing that with a higher than average passing frequency.
To finish off our analysis for the passing centre-back, we will analyze the defensive statistics between them to decide our centre-back. This is because it is important to still retain an element of defensive solidity – regardless of their attacking characteristics.

In all these statistics, we see Segura and González Pírez being the most consistent out of all the centre-backs. In addition to that Segura normally lies near the average for all these statistics while Gonzalez performs better on Aerial Duels and Defensive Duels per 90 and does average on the percentages won for each metric.
These metrics are only some portion of the profile of these centre-backs. We must probe deeper into their defensive analytics to glean the final player.
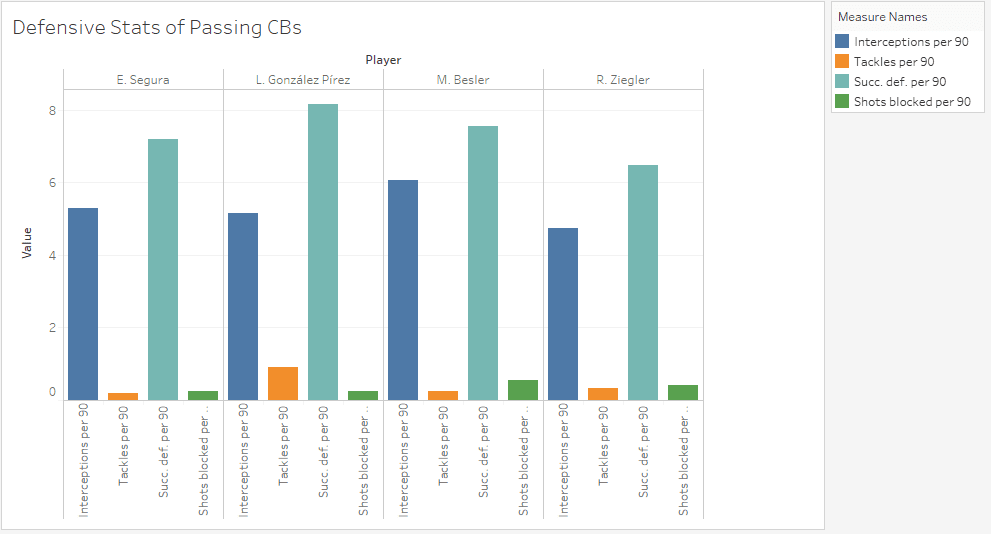
There is much more variation here. González Pírez clearly defends better as he has a better successive defensive action and tackles per 90 than any other centre-back. Besler succeeds in interceptions per 90 and shots blocked per 90. However, as many others on Total Football Analysis and other analytics websites have pointed out, interceptions and tackles have to be taken with a “pinch of salt” as different defensive systems create different defensive metrics.
Observing all the analyses and graphs, we can claim that statistically, Eddie Segura was the best-attacking centre-back in the MLS last year. With voluminous passing, an accuracy that none can rival, and solid defensive abilities, it makes perfect sense why LAFC regard Segura so highly.
Centre-Backs: Defensive Centre-Back
Now onto the defensive centre-back. There is a note to be attached: I am not looking for swash-buckling, all grounds raring defensive centre-back. Instead, we will be using the data available to find an intelligent, defensive centre-back. With that out of the way, finding the statistically best defensive centre-back is quite arguably a harder job than the finding the best attacking centre-back as defensive statistics are affected a lot by the styles of the team. An aggressive, attacking team will post not as impressive defensive statistics while a defensive team will post more interceptions, tackles, etc.
With that in mind, it becomes critical to analyze various aspects of the defensive statistics to get the most complete view. Outliers from each analysis will be noted and the final list of defenders will be stated at the end. From there, closer inspection will occur of the final defenders.
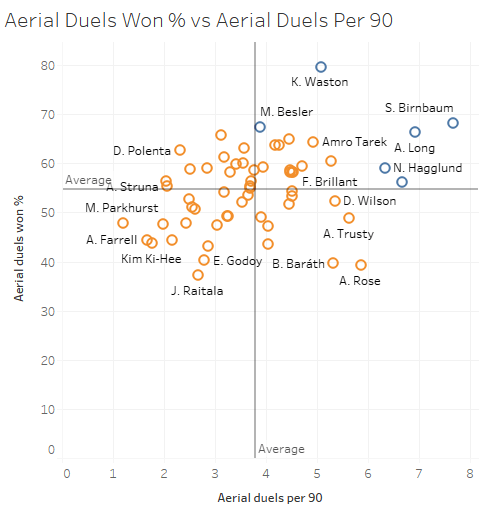
Starting off our analysis, we first analyze aerial defensive actions. An ideal centre-back would record a high success rate but also record relatively high aerial duels. While we cannot achieve ideal centre-backs, we do find much more outliers than expected in terms of the per cent won and as such, we will highlight the best in blue and mark them for further inspection.
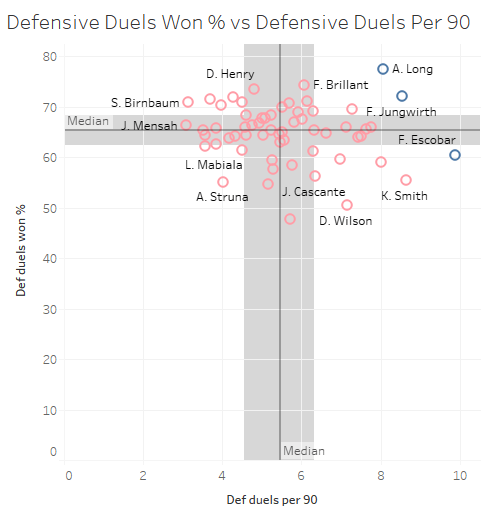
Following the trend, we now analyse the defensive duels per cent won versus defensive duels per 90 minutes. As a good centre-back, we want our defenders to record a higher than average defensive duels with a high success rate. Three notable defenders are marked here for their high defensive duels per 90 and high success rate.
Another important metric to analyse is the success rate for defensive duels and for aerial duels. This allows us an avenue to analyse the more successful centre-backs in air and ground situations in a more complete view.
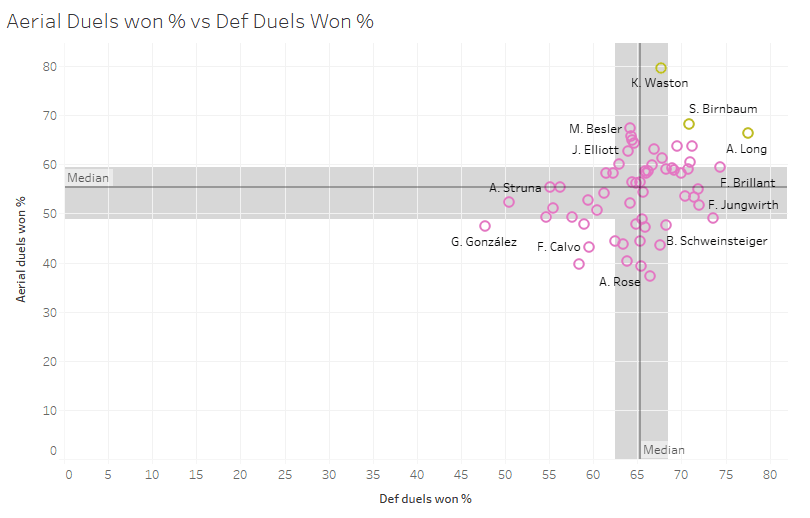
Here, three centre-backs automatically jump out and as you’ll have noticed, some names here have been seen in the previous graphs.
That is the purpose of these numerous analyses: to glean the players who appear as outstanding in various statistics. These three centre-backs indicate that they are not only strong in ground duels but also in aerial situations. This is a good thing to have as uncertain centre-backs can let in more shots and goals than a team would want. Strong success rate suggests that these centre-backs are less likely to lose these types of duels which places defensive solidity in the back-line.
While we have talked about the caution in interpreting interceptions and tackles, it still merits to have a look at an analysis of interceptions.
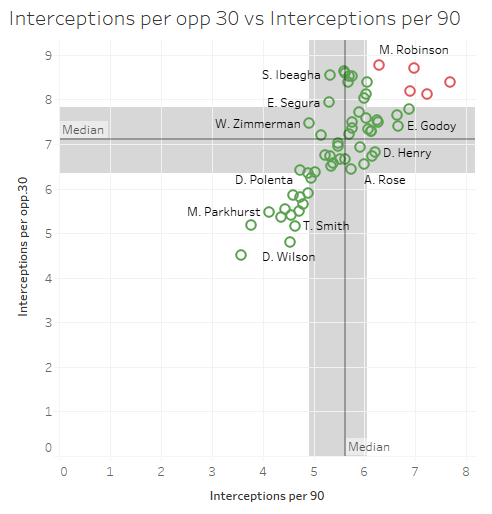
Here we have interceptions per opp 30 – the interceptions a player has for every 30 possessions for the opposition – versus the total interceptions per 90 minutes.
Higher interceptions per opp 30 suggest a more aggressive centre-back as the centre-back is making more defensive actions for 30 possessions. This statistic is a good indicator of the aggression in a player and graphing it alongside interceptions per 90, we get to know our outliers who are defensively active and more so on average.
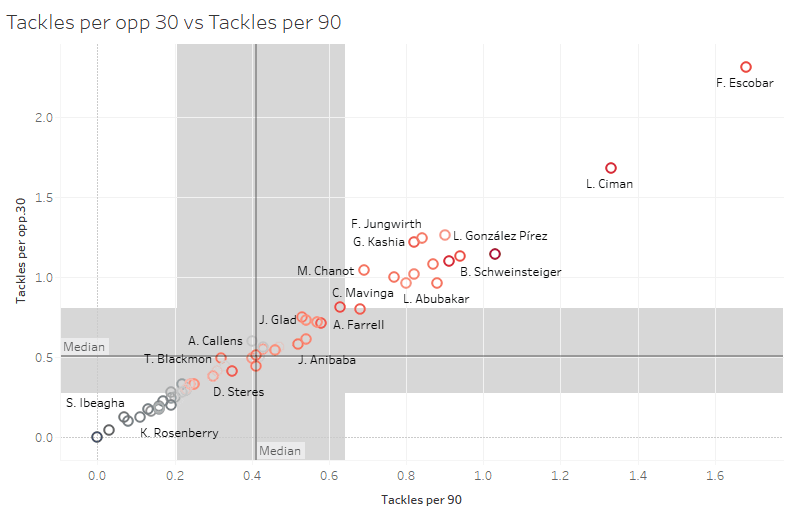
Here we graph tackles per opp 30 vs tackles per 90. In colour, we see the tackle success rate for these defenders. We can see various outliers with varying statistics for the two metrics. In this case, the amount of outliers tells more about the league than it does by the individual centre-back – many MLS centre-backs and teams have aggressive defensive tendencies.
However, this does not amount to being great defensively as tackles and tackles opp 30 often disregard scenarios where a centre-back attempts a tackle and fouls the player. For our purposes, we do not want defenders who foul a lot. However, it is hard to glean that from this visualization. For that, we have to turn advanced defensive metrics.
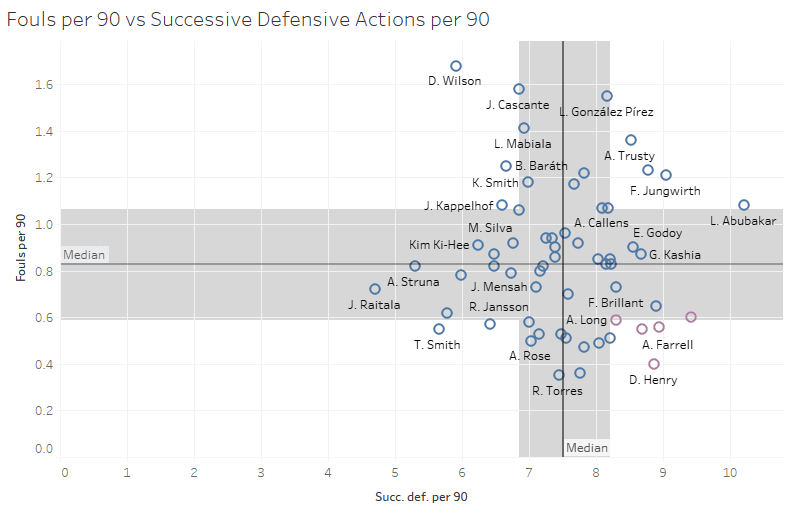
Here we have fouls per 90 vs successful defensive actions per 90. This visualization not only tells us the more error-prone centre-backs but also the more successful centre-backs in general. For our ideal centre-back, we want him recording high successful defensive actions per 90 – which means he is defensively sound and proficient – and low fouls per 90. This focuses our actions to the lower-right of our graph.
The outliers we see here must be regarded in high importance as fouls and successful defensive actions are down to the player’s controls. Even accounting “tactical fouls” – fouls made to stop centre-backs – the fouls per 90 metrics still remains reliable as tactical fouls only make so many fouls over a whole season. As such, this analysis is important as it is one of the few analyses that tell us about the player’s defensive abilities directly.
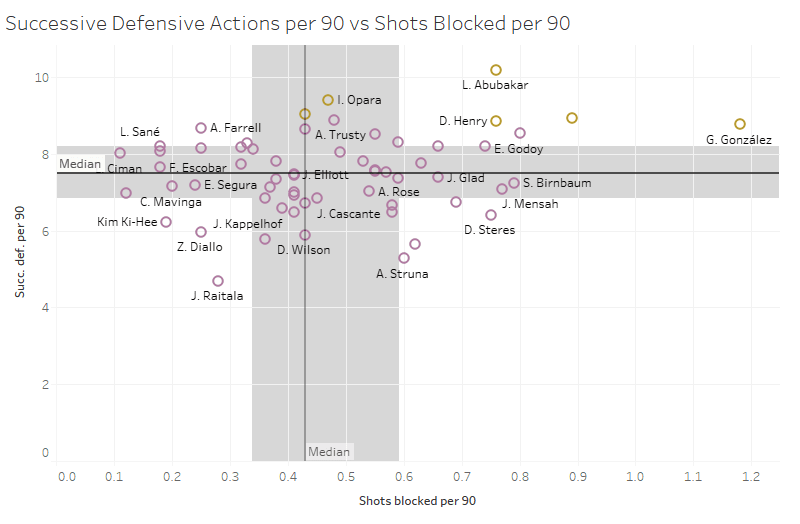
Finally, we are analyzing successful defensive actions per 90 vs shots blocked per 90. This analysis tells us more about the more “heroic” defenders however it is still important to consider this visualisation as it adds another spoke in the wheel of centre-backs.
The ideal centre-back would block slightly above average while being successful in defensive actions. The reason we want a slightly above average statistic in shots blocked is that a defensive team often lets in more shots which result in inflation in this statistic among the centre-backs. As such, looking for the best performance in the shots blocked per 90 isn’t the best means to identify and analyze centre-backs.
After all the analysis, we get to our final 11: Giancarlo González from LA Galaxy, Doneil Henry from Vancouver Whitecaps, Lalas Abubakar from Colorado Rapids, Aaron Long from New York Red Bulls, Franco Escobar from Atlanta United, Kendall Waston from FC Cincinnati, Steve Birnbaum from D.C United, Florian Jungwirth from San Jose Earthquakes, Andrew Farrell from, New England Revolution, Ike Opara from Minnesota United, and Jalil Anibaba from Nashville SC.
Now we conduct a deeper analysis among these eleven centre-backs.
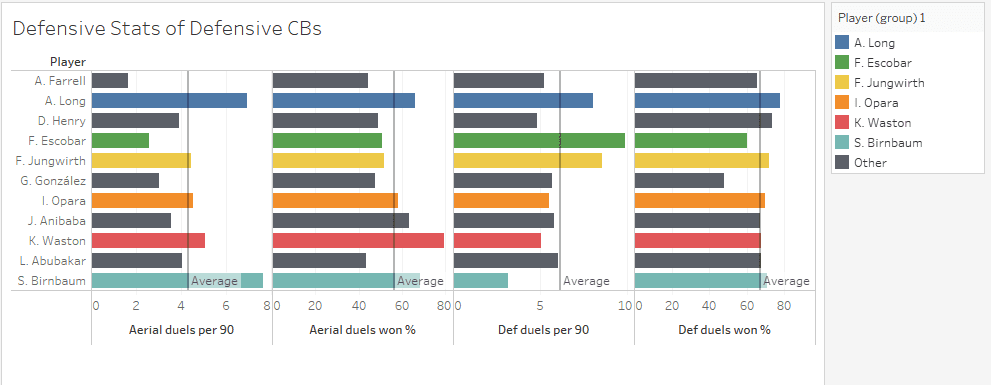
Here, aerial duels per 90, aerial duel success rate, defensive duels per 90, and defensive duel success rate. Strong performances in this sample are highlighted with colours. Birnbaum is very strong aerially while Long is exceptionally strong in aerial and defensive duels. Escobar is especially strong in defensive duels while Waston is strong aerially. Finally, Opara, while not being strong exceptionally, he consistently records near or above-average statistics.
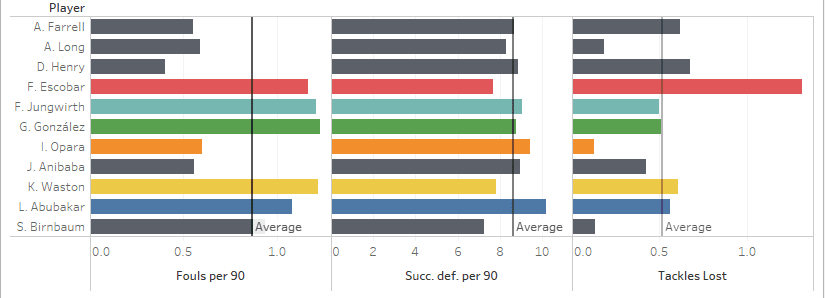
Here successful defensive actions per 90 and tackles lost are analyzed in the small sample. Abubakar is the best in the MLS in successful defensive actions per 90 while Opara is second best. Escobar loses the most tackles per 90 while Opara records the least. In terms of Fouls per 90, Waston, González, Jungwirth, Abubakar, and Escobar are the most erroneous. This immediately takes them out for consideration for the spot as we don’t want erroneous centre-backs.
To finish up the analysis, we will analyse the passing statistics.
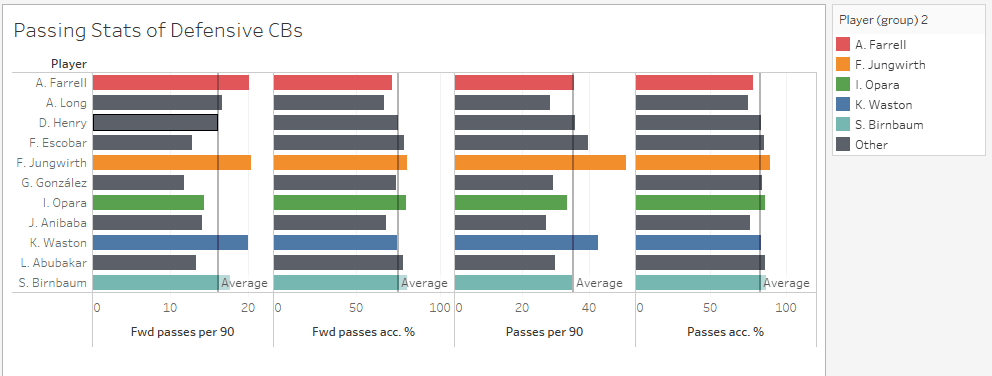
Jungwirth and Farrell record the most forward passes and passes per 90 while Birnbaum and Opara remain consistent in these statistics. Waston is strong in passes per 90 and consistent in other metrics. Little by little, there is a stronger case for Opara building.
Not only was he strong defensively, but he also wasn’t the most erroneous and lost the fewest tackles. Now, he shows a solid range in passing metrics.
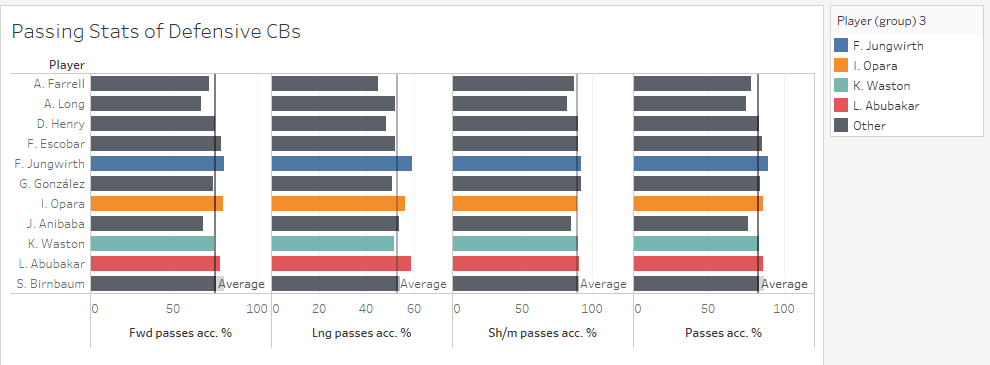
Finally, we analyze the accuracy rate. Jungwirth and Abubakar are strong long passers while Waston and Opara remain consistently high in the accuracy metrics.
After all the analysis, the strongest and defensively solid defender seems to be Opara. Not only does he rank consistently high in almost every defensive statistics but he also has a good passing range to complement his defensive solidity. There is a reason why Opara was named in MLS’ Best Eleven for 2019. His defensive skills and his veteran knowledge is certainly a good asset for any backline to have.
Conclusion
In conclusion, our current backline consists of Portland Timbers’ Steve Clark as the goalkeeper and LAFC’s Eddie Segura and Minnesota United’s Ike Opara as centre-backs in MLS’ statistically best squad for the 2019 season. Our data analysis has proved that these players were the best for their respective positions for the MLS last season.
There is a note to be made here. This does not mean that these players are the best players in terms of their world-class quality. These players have shown some of the best underlying statistics in the 2019 season of the MLS.
This is not the finality – further tactical analysis may be required to see if the data test corresponds with the “eye” test. However, analysing every centre-back in MLS does pose its problems. This article allows one to narrow their scouting down where more advanced tactical concepts may be analyzed.
The next instalment in this mini-series will cover exclusively on full-backs. From there, we look forward to the defensive midfielders, the attacking midfielders/wingers, and striker.


Comments