Turn back time to a decade ago, when time seemed to stand still for Manchester United. Winning trophies was an insatiable habit, adored by the fans and hated by everyone else; these were the golden years.
Alex Ferguson had cultivated world-class players across multiple generations, through the use of a sublime academy programme and a first-tier recruitment strategy. It was this policy overseen by Ferguson that allowed the squad to transition seamlessly, inexpensively and most importantly not become so brittle that one bad signing would imbalance the starting eleven.
So when Fergie signed off with his final Premier League trophy on 19 May 2013, what was to follow? An inevitable dip in form was expected, but a half-decade decline was incomprehensible for even the most hardened sceptics.
Manager choice, passion, fear are all words that have haunted Man United since the departure of their zeitgeist, but what is really to blame for the huge jump-off the 20 times league champions faced?
In this data analysis, we look back across the past decade at Man United’s transfer policy and how this has altered through the bad times and under the new Ole Gunnar Solskjær revolution.
A global overview
Firstly we take a look at the recruitment strategy Man United have implemented over the past decade, starting from the 2010/11 season. Below is a map displaying each country Man United have purchased a player from, with the colour shade dictated by the level of spending from each country. Note this shows the nationality of the team purchased from not of the player.
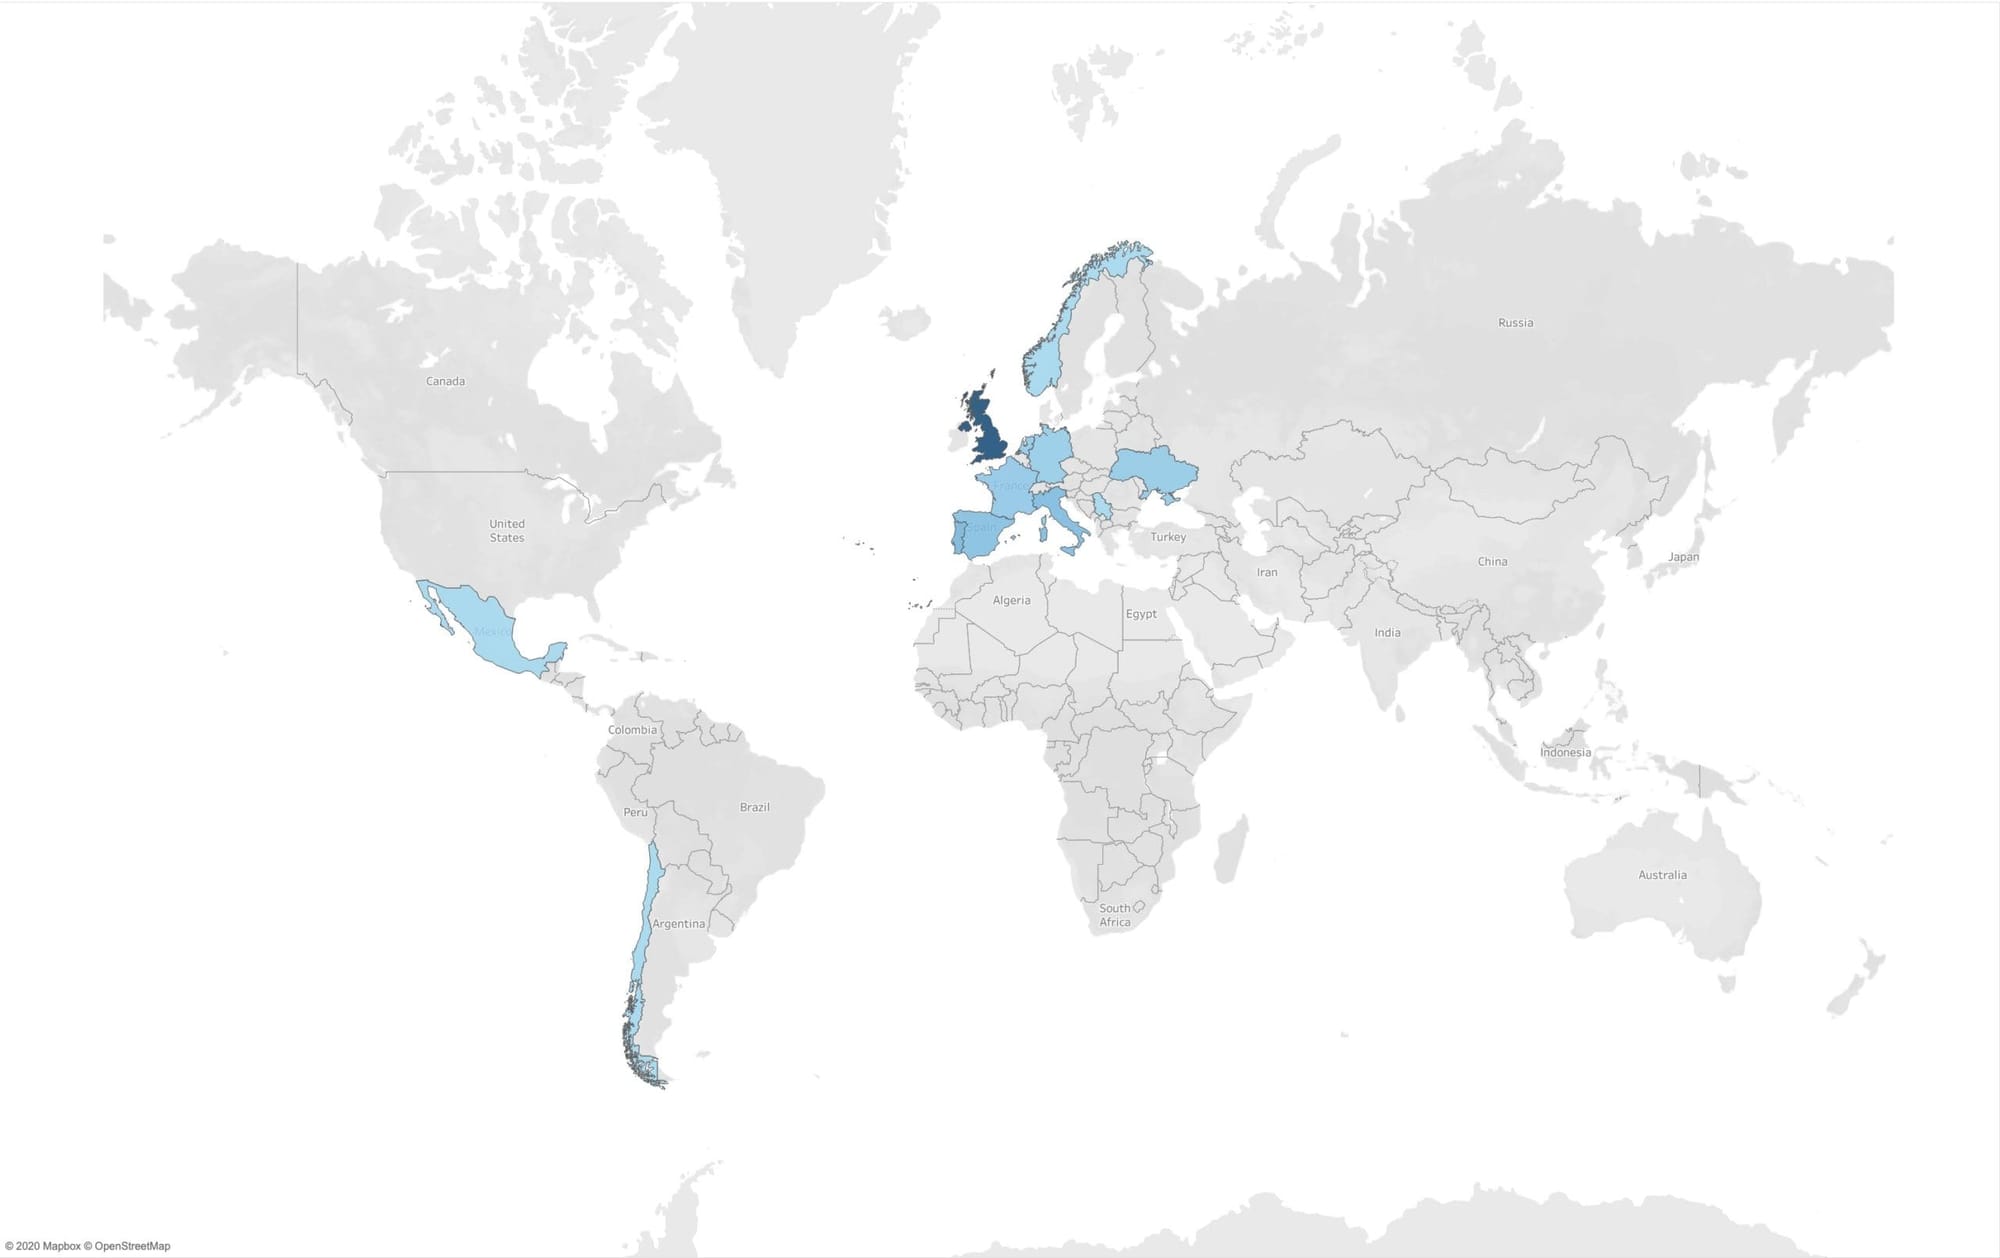
What immediately jumps out is United’s preference to purchase from clubs in Europe. Out of a total £1.1billion spent since the 2010/11 season, £991million has been spent on the continent. Of that amount, £549million has been spent on transfers from teams in the United Kingdom.
This shows us that Man United have always preferred to buy established players playing in more competitive leagues. This is to reduce the risk of the player failing to adapt to the Premier League standard but as we can see, this comes at a cost. This is reinforced by their average spend per player reaching a whopping £26million. Both signings outside of Europe totalled just £11.7million in comparison.
An interesting analysis of this data shows that in the Ferguson era, United’s average spend per player was £13.7million, compared to his predecessors who average £32million per player. Obviously, the transfer market has exploded in recent seasons skewing the figures slightly, and this data doesn’t include Ferguson’s entire tenure makes a difference. However, as an indicator, it shows United have been less able to find great value in the market following the 2012/13 season.
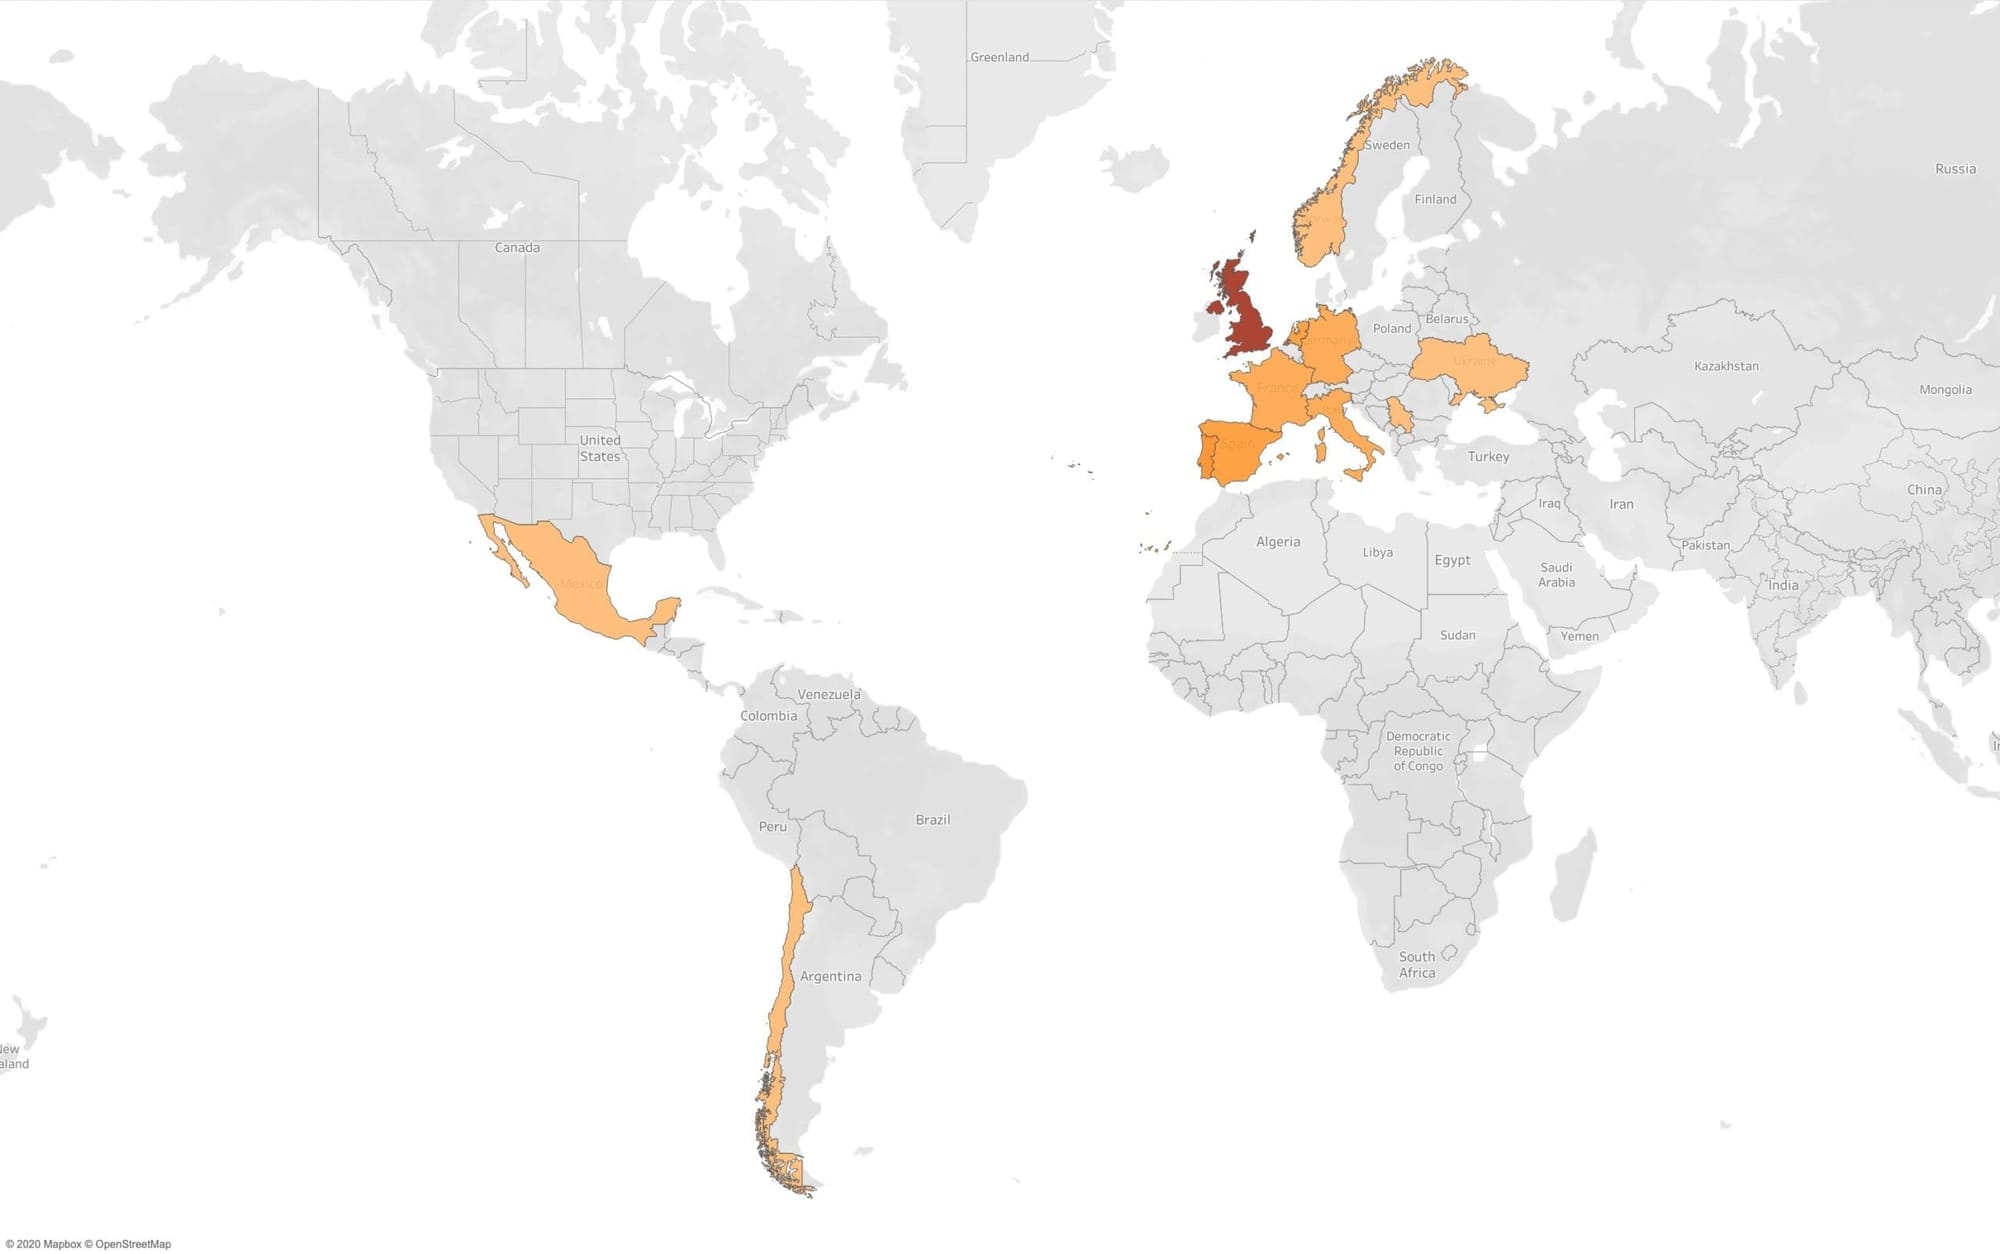
Above is a graph that instead shows the frequency of players bought from each nation, which as you would expect is very similar to the transfer amounts spent. What is interesting is the lack of interest United have in players from Africa and Asia. These are enormous resource pools and look under-utilised from the North-Western club.
The strategy in place, from these graphs, appears to have been – and still remains – to purchase players who have played in Europe with some level of proven adaptability to new surroundings. It’s not to say United aren’t scouting players in the countries they’ve not purchased from, more, they are not willing to take the initial risk, instead, waiting a few extra years and entering the food chain at a later point in the knowledge they are paying a premium.
The data shows us that 16 players have been purchased from the UK, five from Portugal, four from Spain and three from Germany and France. These countries all have fiercely competitive leagues amongst the best in the world. There is no coincidence United have dipped into these markets. With their spending power, they can afford to pay the premium for players who have already competed at the highest level.
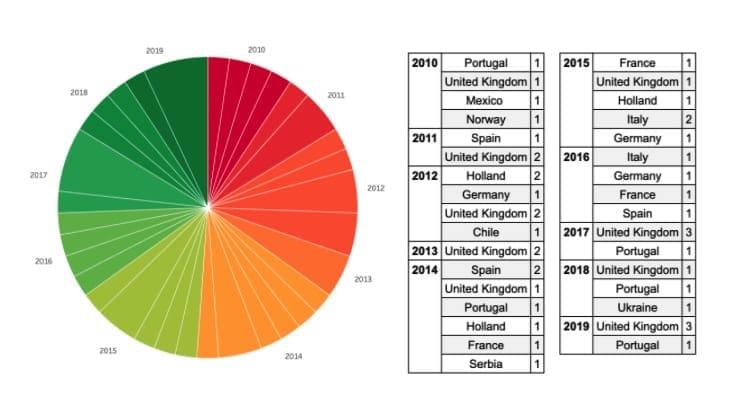
Above is a pie chart showing each year’s spending habits. The colour indicates the year and each segment split proportionally into the number of countries purchased from. What quickly stands out to me is Man United’s years of decline in the post-Ferguson era.
From 2013/14 onwards, United start purchasing players from a range of locations in an almost unselective manner. In the 2014/15 season, for example, the Red Devils purchased seven players from six different countries. In terms of squad disruption and balance, this methodology would clearly affect the onfield performance.
Another interesting period of time is the José Mourinho and Solskjær era. From 2017 onwards Man United look to have obtained more control in the market; purchasing fewer players from a more concentrated geographic location. Of the 11 players purchased since 2017, seven are from the UK and three from Portugal. This period of time shows to me that United are attempting to rebuild the squad chemistry by creating a balanced dynamic using a selective purchasing methodology.
Overall in this analysis, we’ve seen that Man United use a fairly refined transfer target pool, which hasn’t really changed even through the worst of times. Their signings over the past decade have been limited to clubs within European confines, with the intention of a higher level spending leading to a more immediate impact on the pitch.
So, with the overall policy not changing drastically, that leads into the next section where we look at how the players signed have impacted in their following season.
A disappointing year?
The graph below shows each new signing’s impact in their first season. The graph looks at playing time (minutes) and measures it against their expected goals and assists. Therefore, it is limited to the more attacking players, however, I have included the defenders for completeness. The colour of the markers indicates the player’s position and the size is dictated by transfer fee.
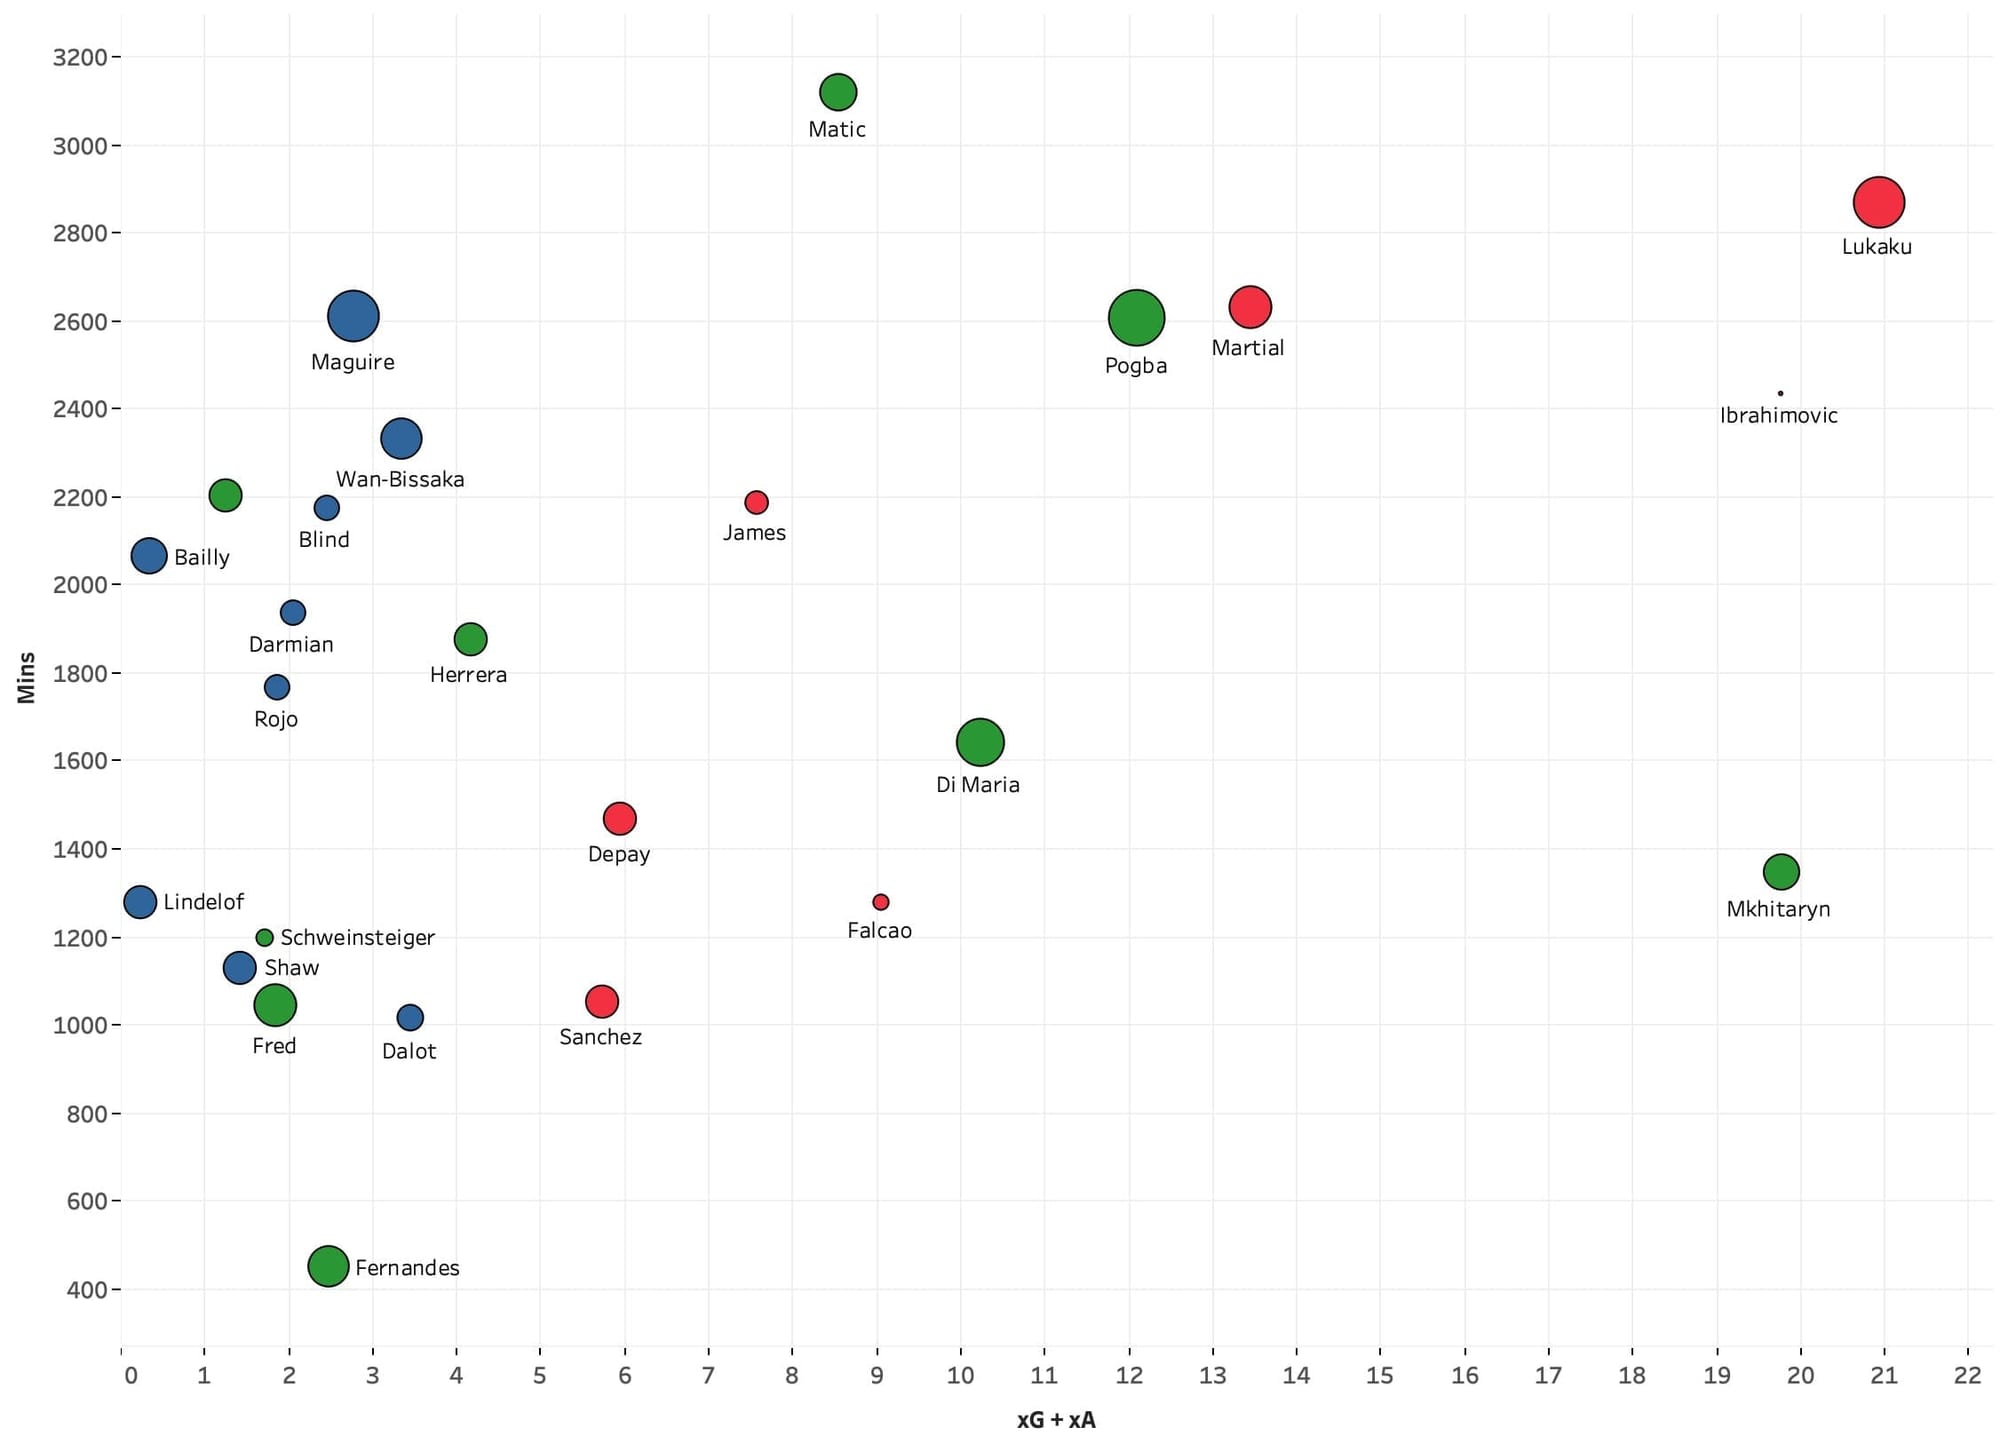
Romelu Lukaku, now with Inter, is the most successful attacking signing. He achieved a combined xG and xA of 20.94 in his first season with the Red Devils, playing 2,869 minutes.
Henrikh Mkhitaryan, now owned by Arsenal, was a surprising player on this graph. His first season was classed as a disappointment for the Reds, who quickly wrote off the Armenian as a flop. This is indicated by his game time (1,347 minutes), however, his impact was still notable. The Armenian finished the season with a combined xA and xG of 19.76 all despite being on the periphery, which is impressive.
Zlatan Ibrahimović, now of AC Milan, is no stranger to standing out. The Swede’s statistics in 2016/17 were sublime for United considering his fee of £0 (salary excluded). A combined xA and xG of 19.76 in his first season makes him one of United’s better value deals.
Alexis Sánchez and Memphis Depay were two exciting transfers for the Red Devils each costing around £30million a piece. We can see above, however, that the pair – in separate seasons – failed to make the impact expected of them, achieving a combined xA and xG of 5.73 and 5.95 respectively. Putting that into context, the pair were outperformed by holding-midfielder Nemanja Matić in his first season.
The final observation is Daniel James. The youngster played 2,188 minutes in his first season but achieved a combined xA and xG of just 7.53. Whilst this can be put down to inexperience and youth, with large potential to improve. The Welshman will need to begin adding to these numbers if he is to avoid becoming one of the ‘what could have been’ players we have already listed.
We’ve seen from this graph that an immediate impact is expected when Man United come calling. As a new signing, you have to hit the ground running, otherwise, like many on the list above, you are handed a return plane ticket hastily.
This may appear harsh and perhaps overzealous, however, as we saw from the selectivity of the transfer locations, Man United put a lot of work into picking players where adaptability risks should be minimal. On top of this, they pay the premium for that reduced phasing-in time, meaning any shortfall in performance has a greater chance of coming from technical or mental deficiencies not picked up from scouting.
Time of Change
Since Ole took over at the wheel, there’s been a rejuvenation amongst the fans. This has been spearheaded by the increase in exciting football played on the pitch, which is directly linked to Solskjær’s squad rebuilding job that he’s been quietly orchestrating.
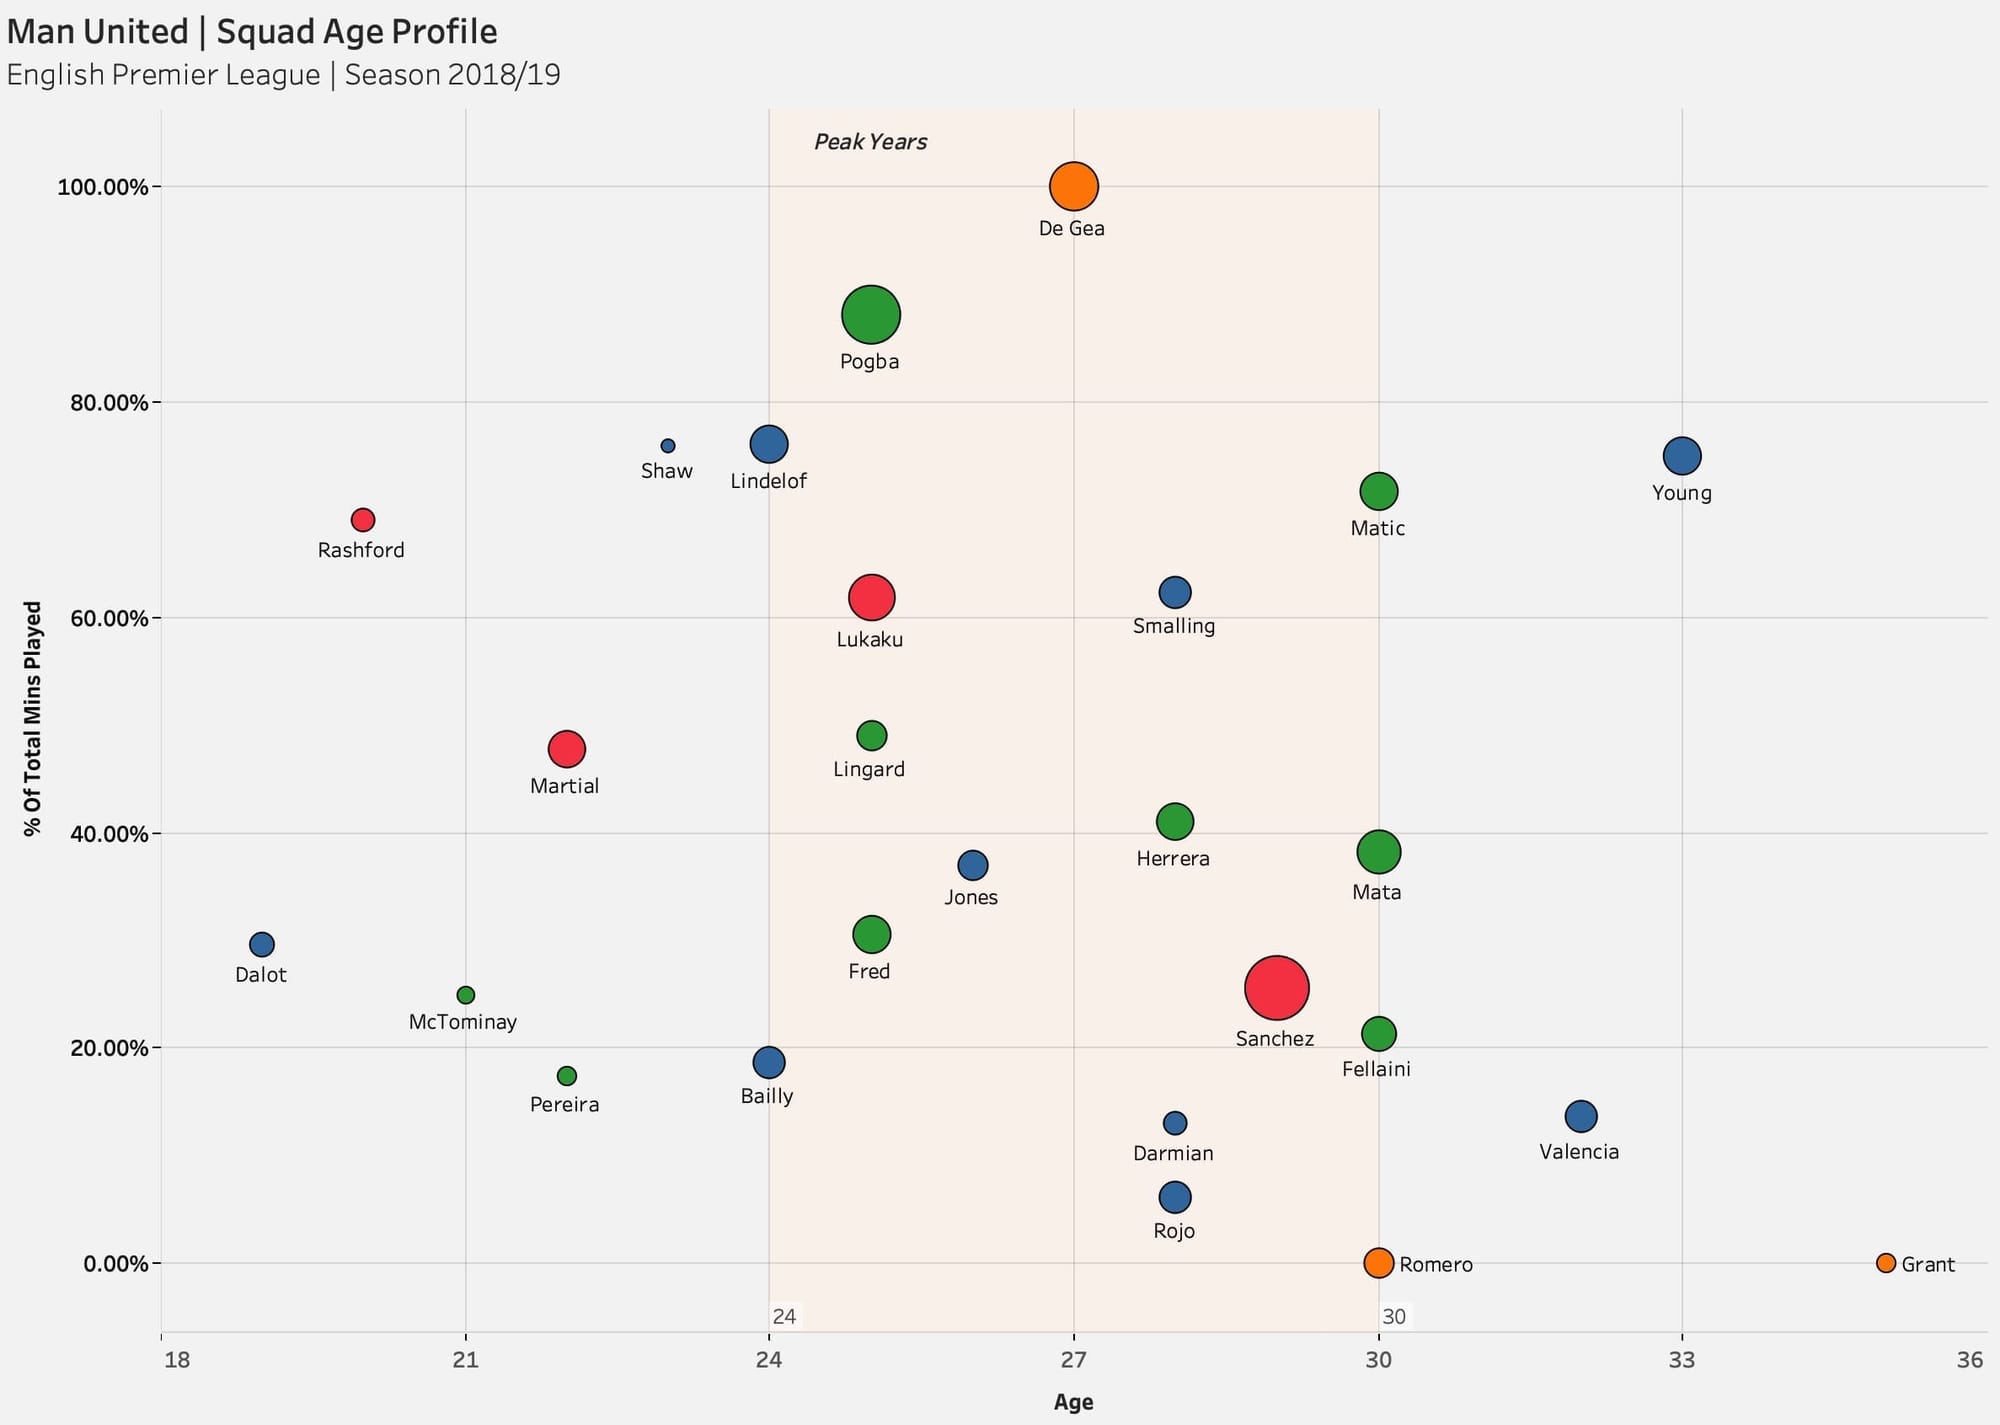
Above is a Man United squad profile at the end of the 2018/19 season. We can see the chart doesn’t make for great reading. The colour of the markers indicates the player’s position and the size indicative of their salary.
The first thing that stands out is the number of players on large salaries who barely feature in the starting lineup. In particular, players such as Marouane Fellaini, who played just 21.29% of Premier League minutes, earning around £100k a week. Sánchez is another burden to the squad profile, playing in just 25.58% of Premier League minutes, on a salary of £350k p/w.
Another observation is the squad balance. Man United at this time have just four attackers, two of which are under the age of 24 years old. This lack of depth has meant, despite their talent, Marcus Rashford and Anthony Martial have been heavily relied on, playing in 69.09% and 47.72% of minutes respectively.
Conversely, Man United own a large number of midfielders and from their playing time, we can see there’s no indication of what is the best combination of these players. The same can be said for the defenders. Again, there’s an abundance of defenders owned, so depth isn’t a problem, more there’s no clear understanding of who is the first-team selection.
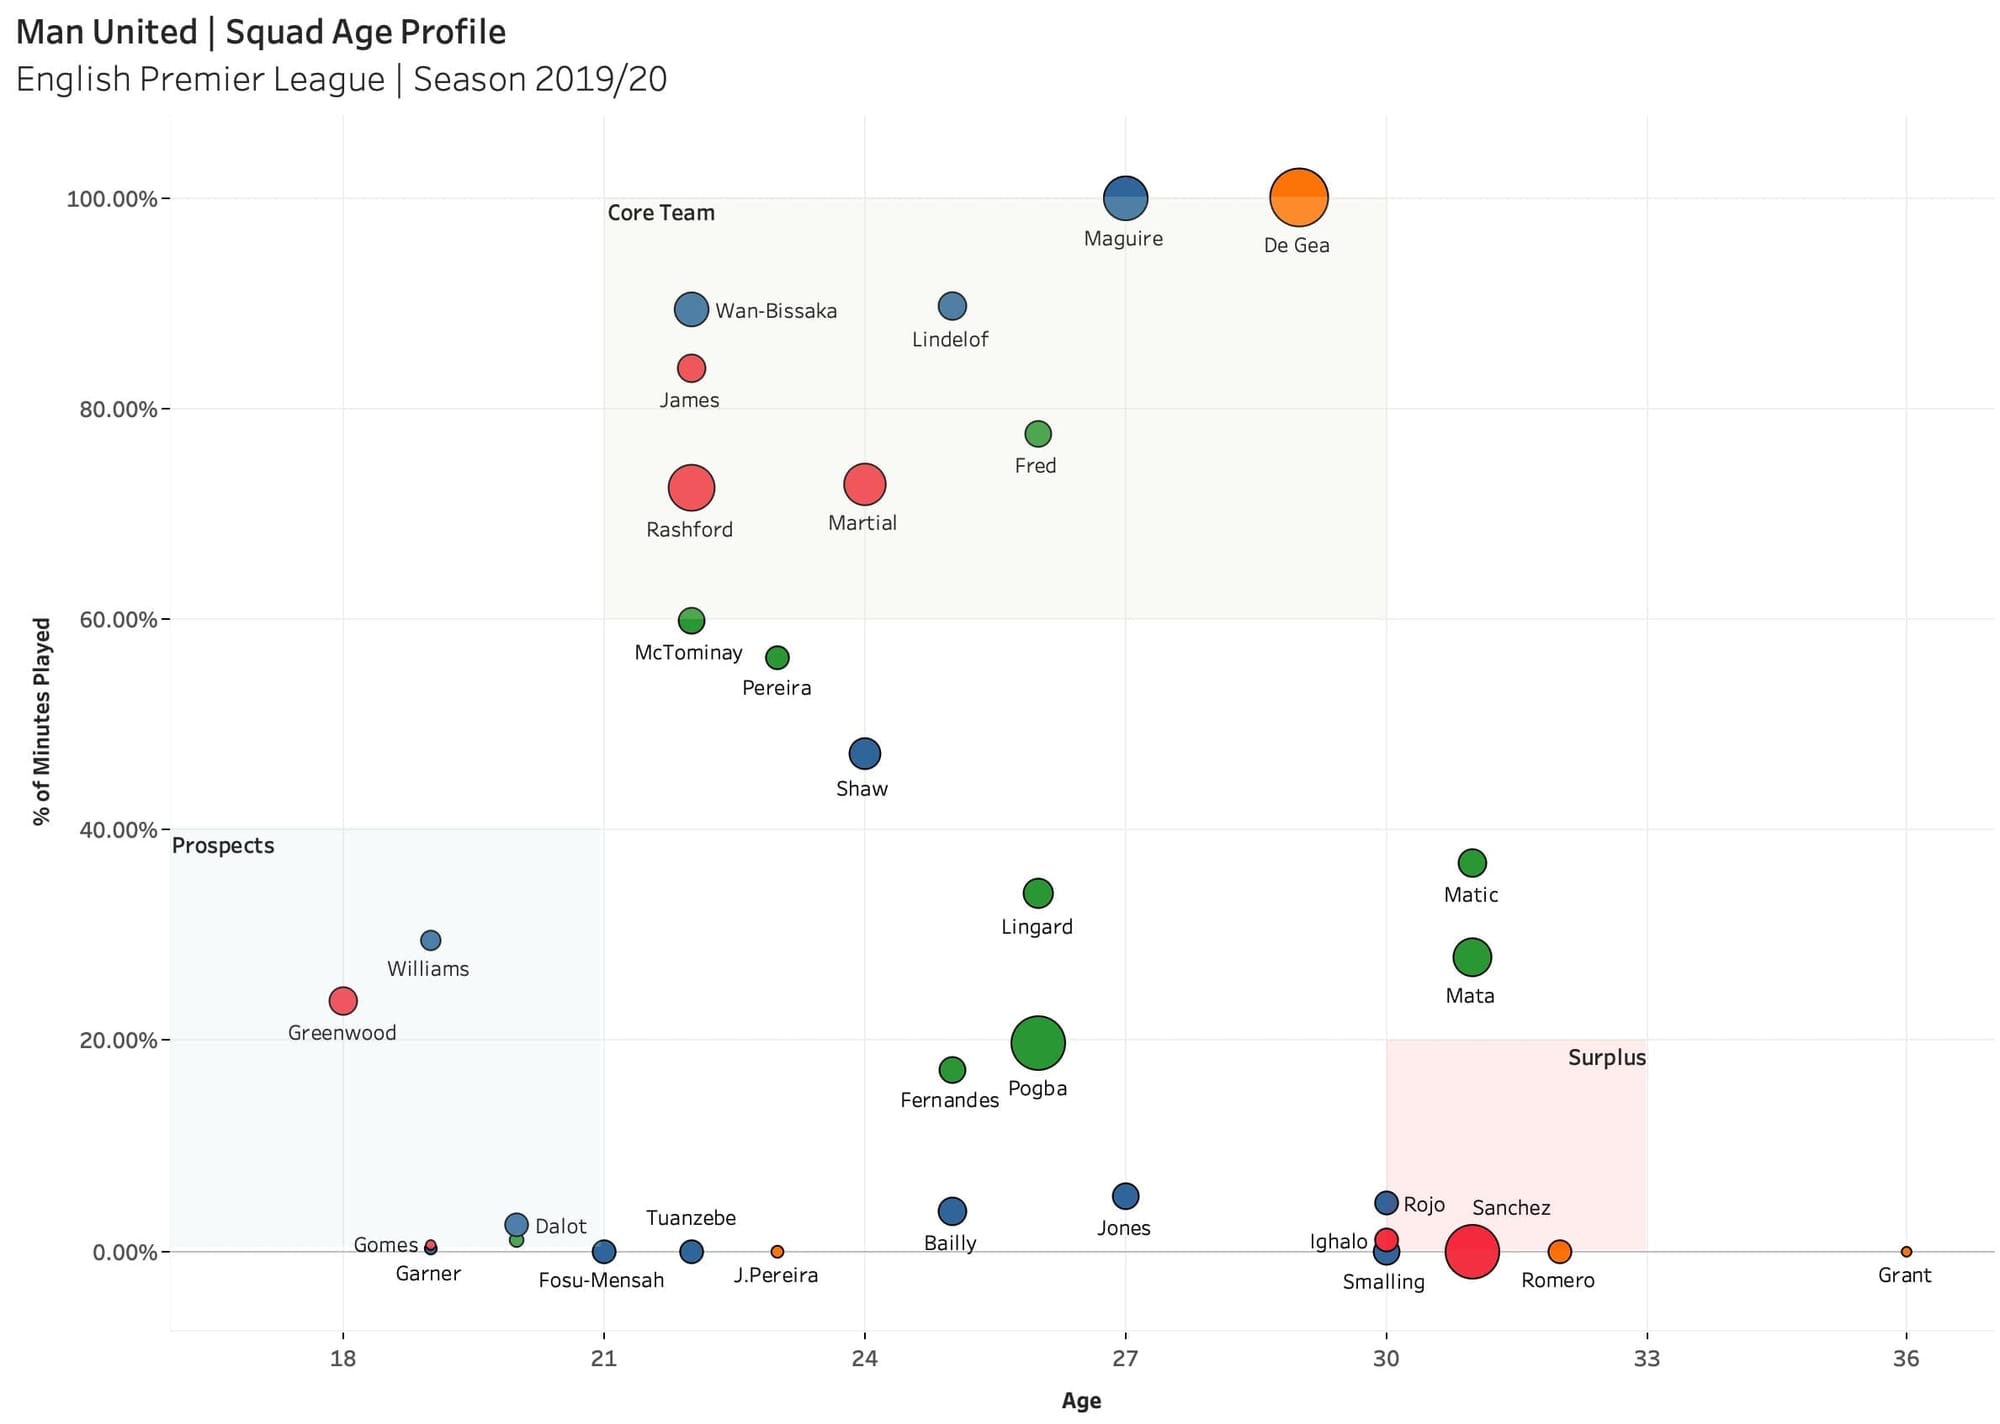
Now if we compare the profile to this season, we can see a positive transition has been undertaken at Man United under the guidance of Solskjær.
Firstly, there’s a clear idea of the first-choice defenders. We can see that Aaron Wan-Bissaka, Victor Lindelöf and Harry Maguire have cemented themselves as first-team players, each playing in over 80% of Premier League minutes.
We can also see that consistency in the attacking contingent, with Rashford, James and Martial all now within peak years and playing the majority of minutes for the Red Devils. These positions are also now well supported by prospective youngster Mason Greenwood and veteran loanee Odion Ighalo.
The 2019/20 season has a much better balance about it. First-team players are on the right contracts, playing the appropriate amount of minutes and the majority of first-team falls within peak athletic years.
The areas that still require addressing are the overpaid players who are not featuring often enough to warrant their wages. A decision needs to be made on Sánchez, whose place in this squad now looks very insecure. Paul Pogba is also a great player, who is not playing frequently enough. Injuries have been a problem for the Frenchman this year, and if a summer move never materialises, next season the central midfielder must start contributing in minutes (at least) to the United team. This would also solve United’s scattergun midfield by creating a consistent first-team selection.
There is still an imbalance of defenders within the team. United have some lower-paid prospects coming through, meaning Marcus Rojo, Phil Jones and Chris Smalling as at this stage of their careers, appear surplus to requirements. I would expect to see at least one of these players exit the club in the near future to free up space on the payroll.
The graph below summaries the change in the tide for Man United. The line graph shows the total transfer sum spent each year by United and compares it to their goals scored and conceded within the season.
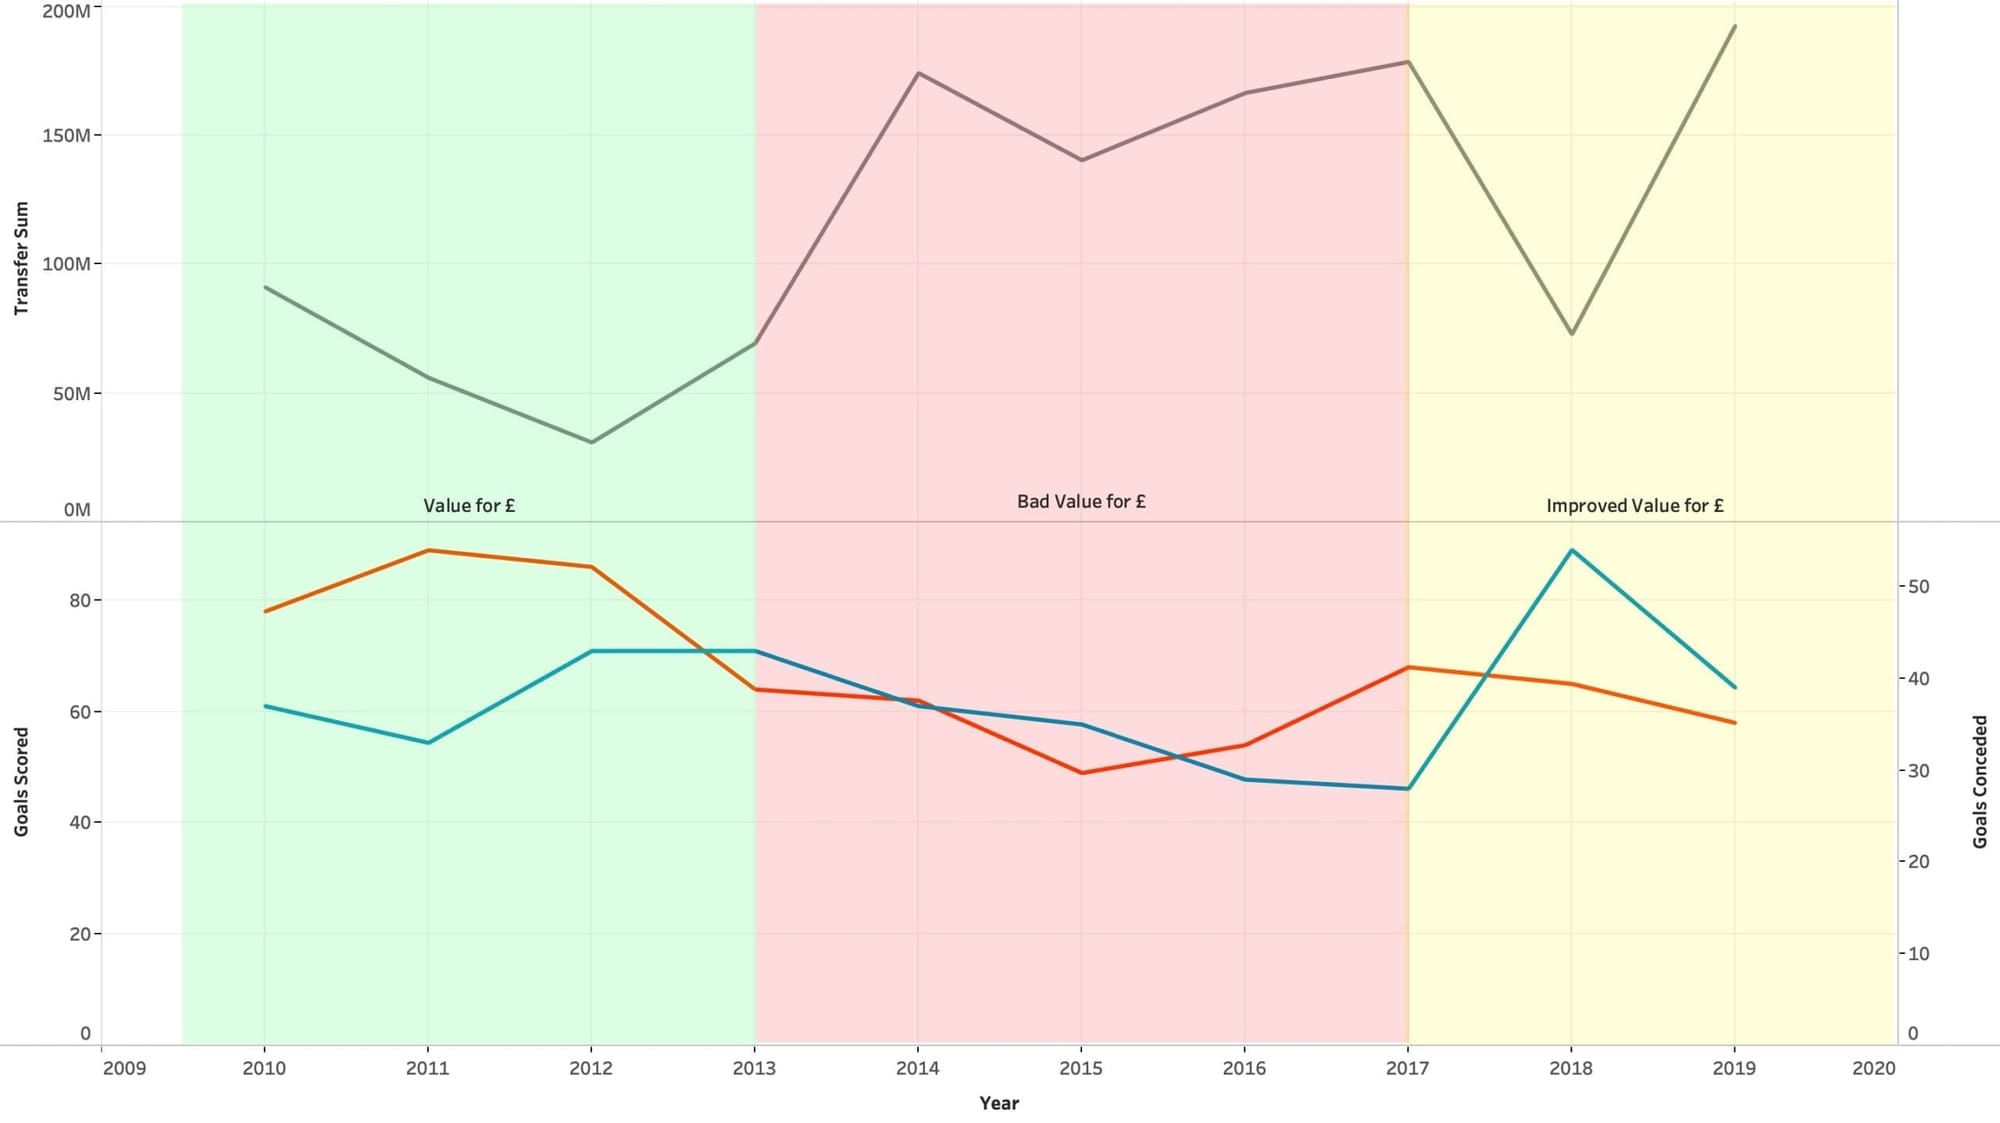
We can see in the early years of the decade Man United were making the correct choices. Their transfer bill was relatively low in terms of the return they were getting on the field. In 2011/12 for example, Man United spent just £30.98mill and scored 82 goals that season in the Premier League.
Following Ferguson’s departure, we can see things start to go awry. In 2014/15 for example, the Red Devils spent £174mill on transfers yielding them a return of just 62 goals whilst conceding 37.
The yellow section highlights a turn of fortunes under new guidance as previously discussed. United are finding better value in the market, on average not spending as much, whilst returning better on-pitch results.
So what have we learned?
Firstly we’ve learned that over the past decade, Man United’s transfer policy from a geographic standpoint has not altered that much. They are continuing to spend higher amounts on premium players to reduce the time required to make an impact on the field. That said in recent seasons, United have refined their policy by bringing in a lower frequency of players to account for squad chemistry. Rather than purchasing from multiple leagues in one window, Solskjær and his team are hand-selecting one/two players who will adapt quickly into the first team with little disruption.
We’ve also seen that in the back end of the decade, active steps have been taken to rebalance the playing squad. From the squad profile comparison, we’ve seen a clear idea of who United value as first-team players and who are now on the periphery. Salaries have also been restructured to represent this, with the frequently featuring players (in general) being paid smaller sums.
That’s not to say the job is done, however, as this analysis has pointed out a few areas that still need addressing in the squad before the balance is perfect. What can be said though, is that United are really making positive strides towards a quality first-team, supported by a good blend of prospective youngsters and experienced veterans. With another few successful transfer windows, who’s to say what’s next for this team.



Comments