The NCAA Men’s Soccer 2023 season is in the books, with Clemson winning a second national championship in three years.
With a full season of data available on Wyscout, we’ve created a database with over 25,000 values, both directly from Wyscout as well as custom metrics, that offers a complete seasonal database for every Division I men’s program.
You may recall our three-part series NCAA data analysis in July and August of 2023.
We used data to interpret styles of play, included a guide on implementing data analysis within an NCAA program and picked our preseason team to watch.
We followed that up with an article on Creighton University, giving an inside look at their use of data in route to a College Cup appearance.
This analysis is modelled after that initial post.
Using this massive database with complete season data for all 211 NCAA D1 teams, this analysis will examine performance metrics and each program’s attacking and defensive tactics.
NCAA D1 Men’s Soccer Performance Based Statistics
Let’s start with the performance-based statistics.
In this section, we’re solely concerned with goals, goals against and the expected values in each category.
We want to first compare xG and xGA to get a sense of each team’s attacking and defensive performances across the season.
Starting with the expected goals rather than the ones that counted on the scoreboard may seem counterintuitive.
After all, the actual goals are the ones that determine the results of games.
We’ll start with the expected goals for and against because we want to assess the calibre of each team’s chance creation and denial.
This takes away the advantages of a team with fantastic individual goal scores and gives a better idea of a team’s performance when the players up top haven’t pulled their weight.
Expected data levels the playing field to give an idea of the quality of the chances created throughout the season, both for and against.
Looking at our first graph, which plots xG and xGA, the top performers will be at the top right, while the squads with low xG and a high xGA are at the bottom left.
We immediately see the incredibly balanced and convincing seasons enjoyed by Duke, Akron, Marshall, Portland and Clemson.
They represent the top combination of goal creation and defensive stoutness.
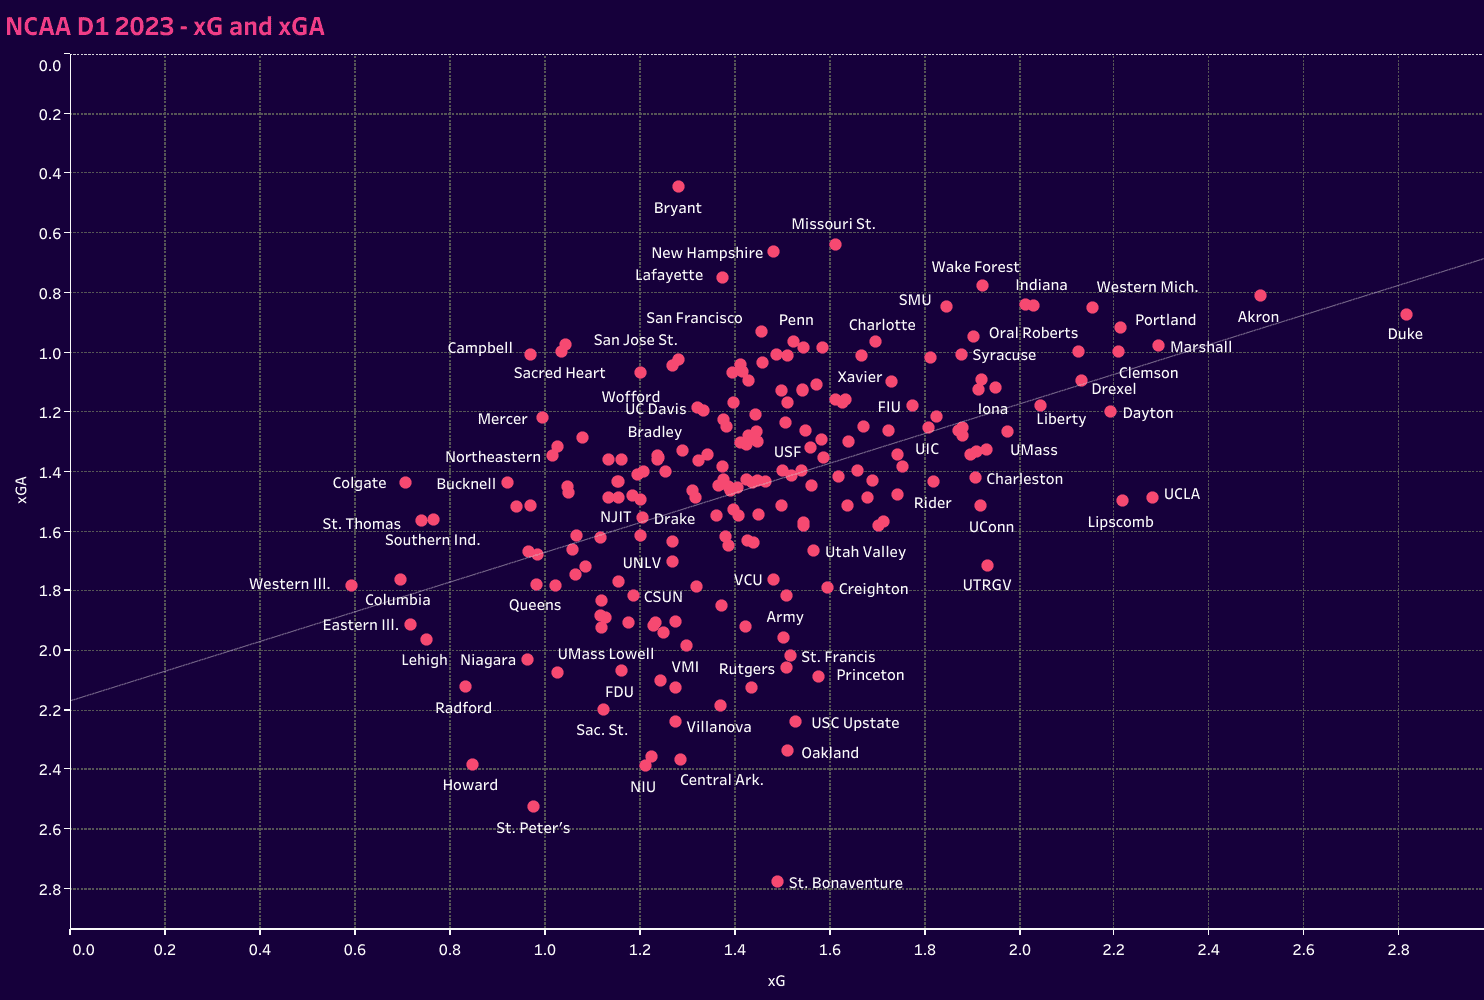
Bryant had a remarkable season defensively, as did Missouri State, New Hampshire and Lafayette, representing the mid-majors proudly.
Wake Forest and Indiana also enjoyed strong defensive seasons, while UCLA and Lipscomb were a bit more susceptible defensively but enjoyed a prolific attacking output.
Turning to the goals and xG graph, we get a sense of which teams followed up—excellent chance creation with balls in the back of the net.
Right away, Duke stands out from the pack, sitting right on that trend line to show that they finished off the chances they were expected to.
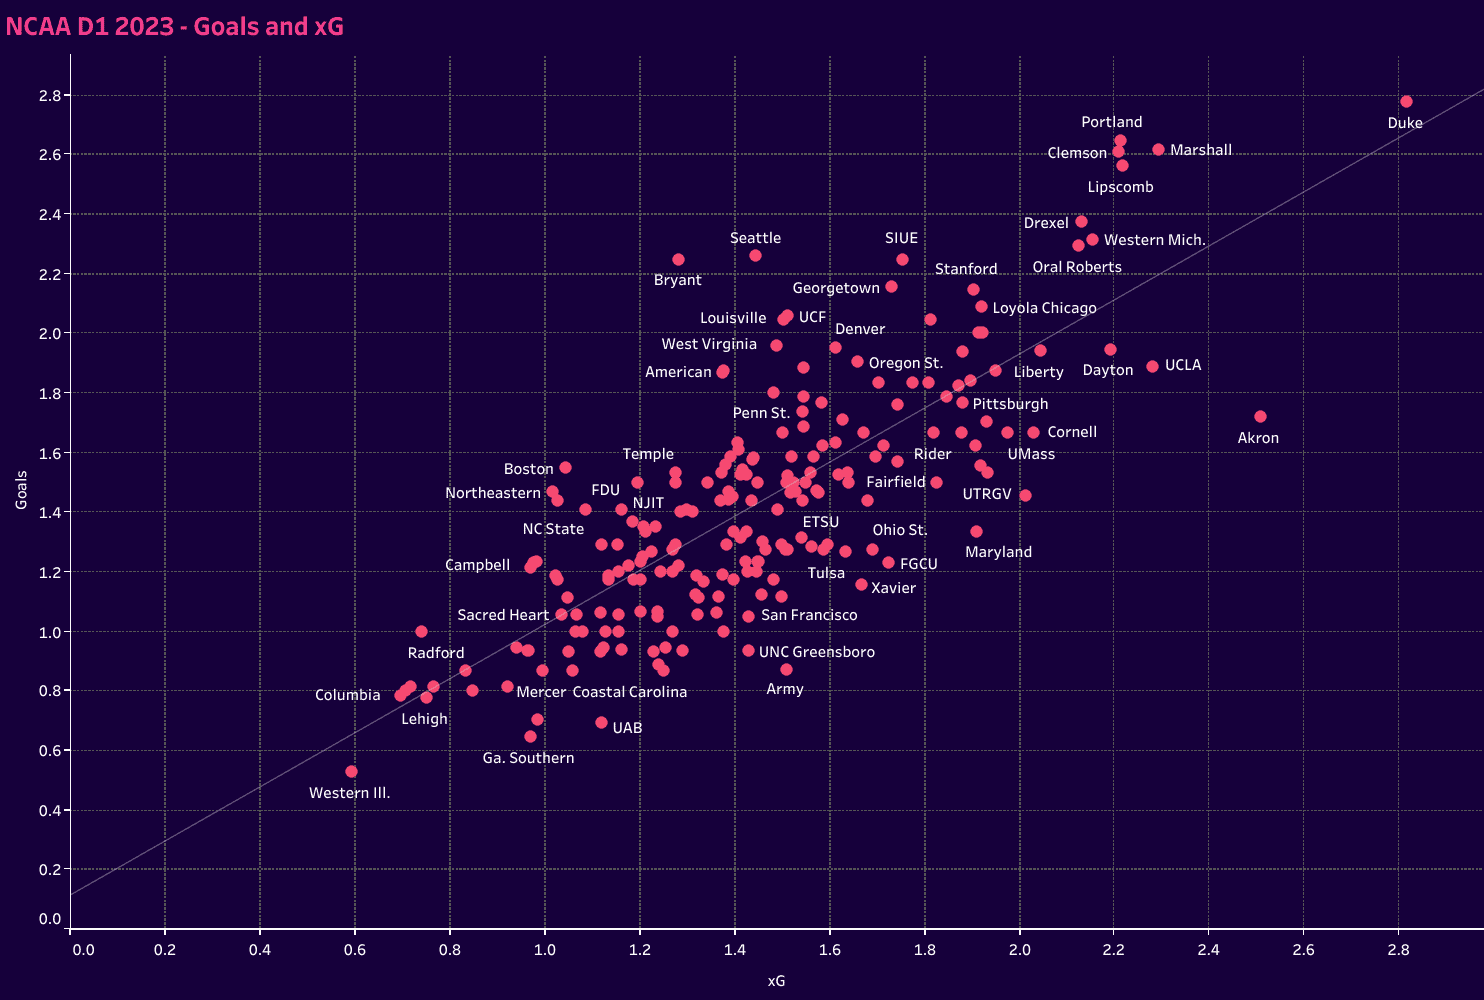
Portland, Marshall, Clemson and Lipscomb are clustered well above the trend line, showing that they outperformed their season xG considerably.
Bryant, Seattle and SIUE didn’t register as many goals per game but again showed the quality of their finishing by registering goals P90 that far exceeded their xG.
Below the trend line, we have teams like Akron, Maryland, UNC Greensboro and Army who struggled to capitalize on the chances they created.
Turning to the defensive metrics, the closer to the bottom left a team is, the better they were defensively.
Bryant was absolutely fantastic this season.
They allowed just six goals in 20 games, coming out to 0.297 goals allowed per game.
Universities like New Hampshire, Missouri State, Akron, SMU and Indiana follow them.
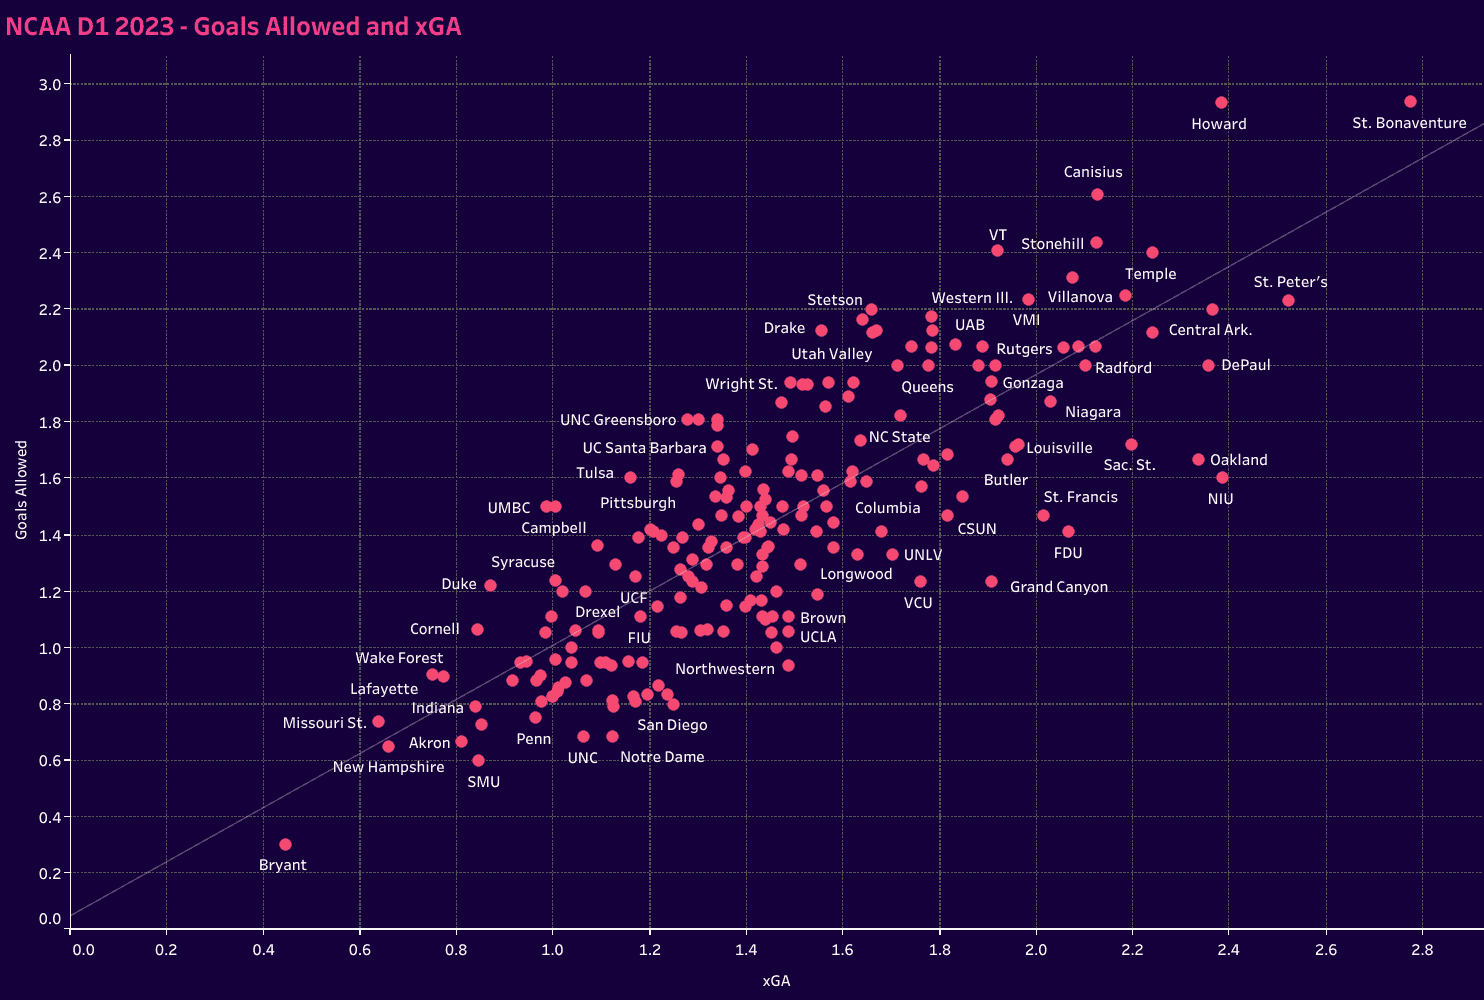
The teams that sit above the trend line were a bit unfortunate to concede more goals than expected.
Whether that’s the quality of the finishing against them or goalkeeping issues, they found themselves on the wrong side of the trend line.
In contrast, Penn, UNC and Notre Dame had the good fortune of allowing fewer goals than the calibre of the chances conceded.
Inverse to the teams above the trendline, this could be due to an opponent’s inability to put the ball in the net or goalkeeping heroics.
NCAA D1 Men’s Soccer Data on Attacking Tactics
There are so many statistics we could have used in this section.
The current draft of the spreadsheet goes up to column DO in Excel (119 deep), most of which concerns attacking actions and patterns.
With so many options, we had to narrow our focus.
We’ll look at some of the basics, such as possession, 1v1 attacking duels and a couple of pass types.
This is also where we’ll use one of the custom metrics.
But first, let’s start with a simple breakdown of positional attacks and counterattacks, each on a P90 basis.
This chart gives us a sense of each team’s attacking tendencies.
We have a mix of very balanced teams, including Portland, Seattle, Xavier, UCF, and Virginia Tech.
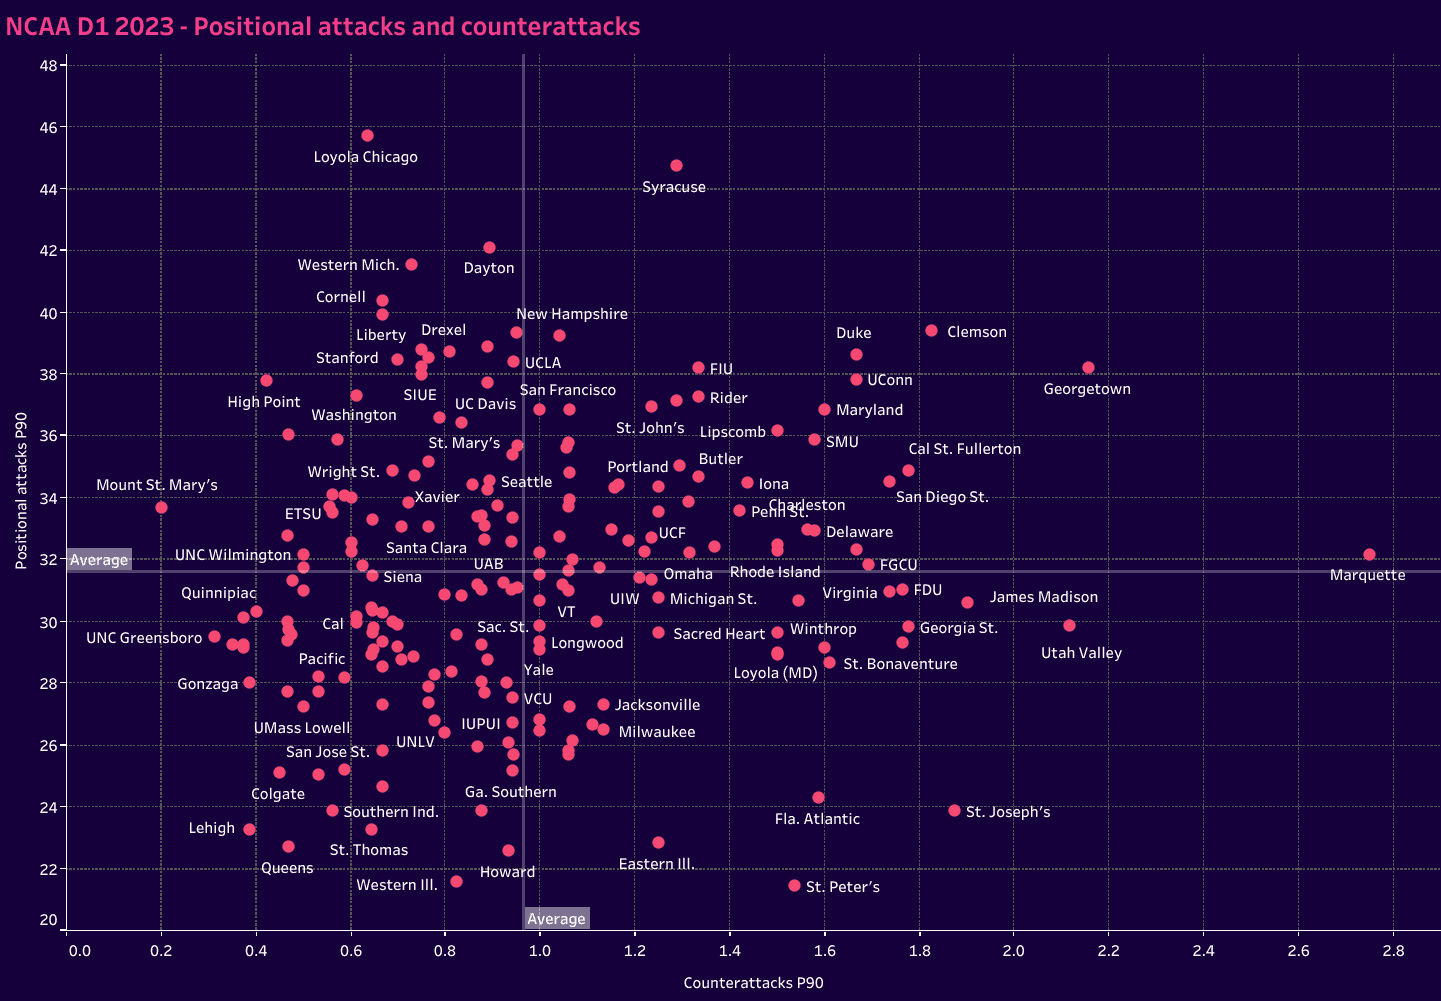
But we also have a mix of teams that are highly slanted towards one or the other.
Marquette is an interesting case because they still register the average number of positional attacks P90, but they are far and away the most counterattack-oriented team in college soccer.
The programs at the bottom of the chart are much more likely to use counterattacks to push forward rather than positional attacks, especially those that skew more towards the bottom right-hand portion of the chart.
The top left represents the teams that are less likely to counterattack and more likely to use positional attacks and dominance in possession to push the ball up the pitch.
Loyola Chicago, Dayton, Western Michigan, Cornell, Liberty, Drexel and Stanford fall into this category, as do High Point and Washington.
That top right gives us the teams that are more balanced in approach and more likely to hold the attacking initiative in matches.
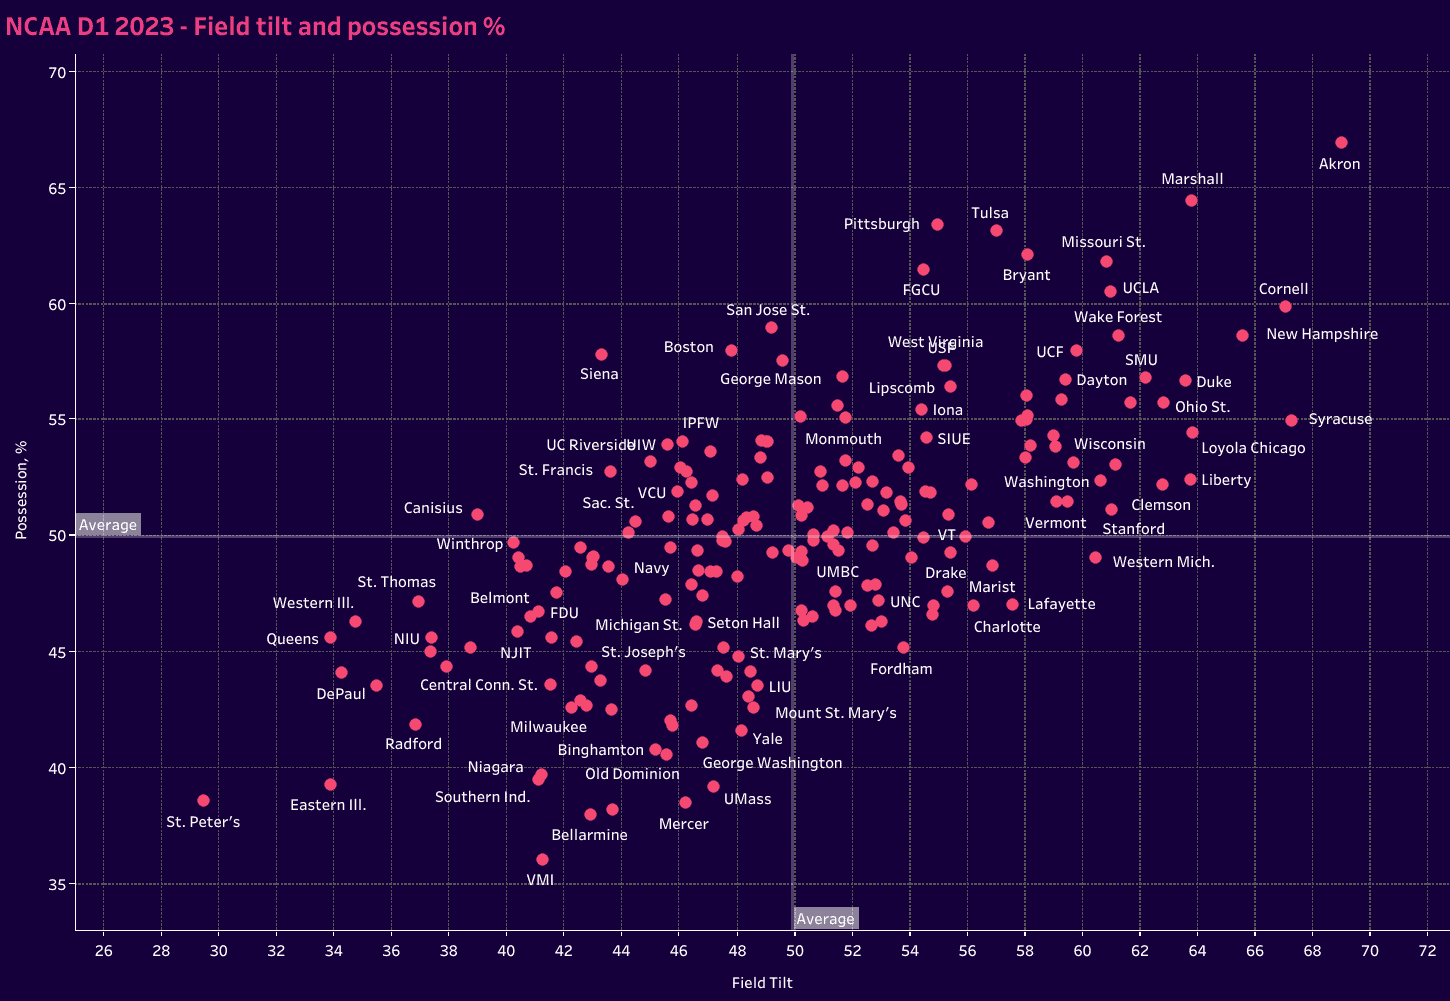
The next graph gives us field tilt and possession percentage.
The latter is a common tactic and easy enough to understand, but field tilt requires an explanation, especially since this is not an official Wyscout metric.
The mathematics behind the computation focuses on touches in the box, which is how Creighton University created its field tilt metric, which we covered in the earlier mentioned data analysis.
Typically, field tilt is a measure of touches in the attacking third, but the idea of measuring dominance through touches in the box is more appealing.
Looking at the graph, Akron was the clear standout, leading NCAA D1 soccer in both categories.
Marshall, Cornell, New Hampshire and Syracuse are the next most prominent schools, followed by a larger cluster.
In terms of how teams progressed up the pitch, the following two charts look at progression through the dribble and through passing.
Let’s start with dribble progression.
This next chart looks at offensive duels P90 and match tempo, which measures the number of passes a team completes per minute.
The higher the match tempo stat, the quicker a team moves the ball.
The top right quadrant gives us an idea of the teams that enjoy both quick ball circulation and dynamic individual ability.
The bottom right will lean more heavily on individual duels, and the top left features quicker ball circulation but with less dribbling.
For the bottom left, a better sense of how the teams play is better gauged by the balance of their positioning within the quadrant.
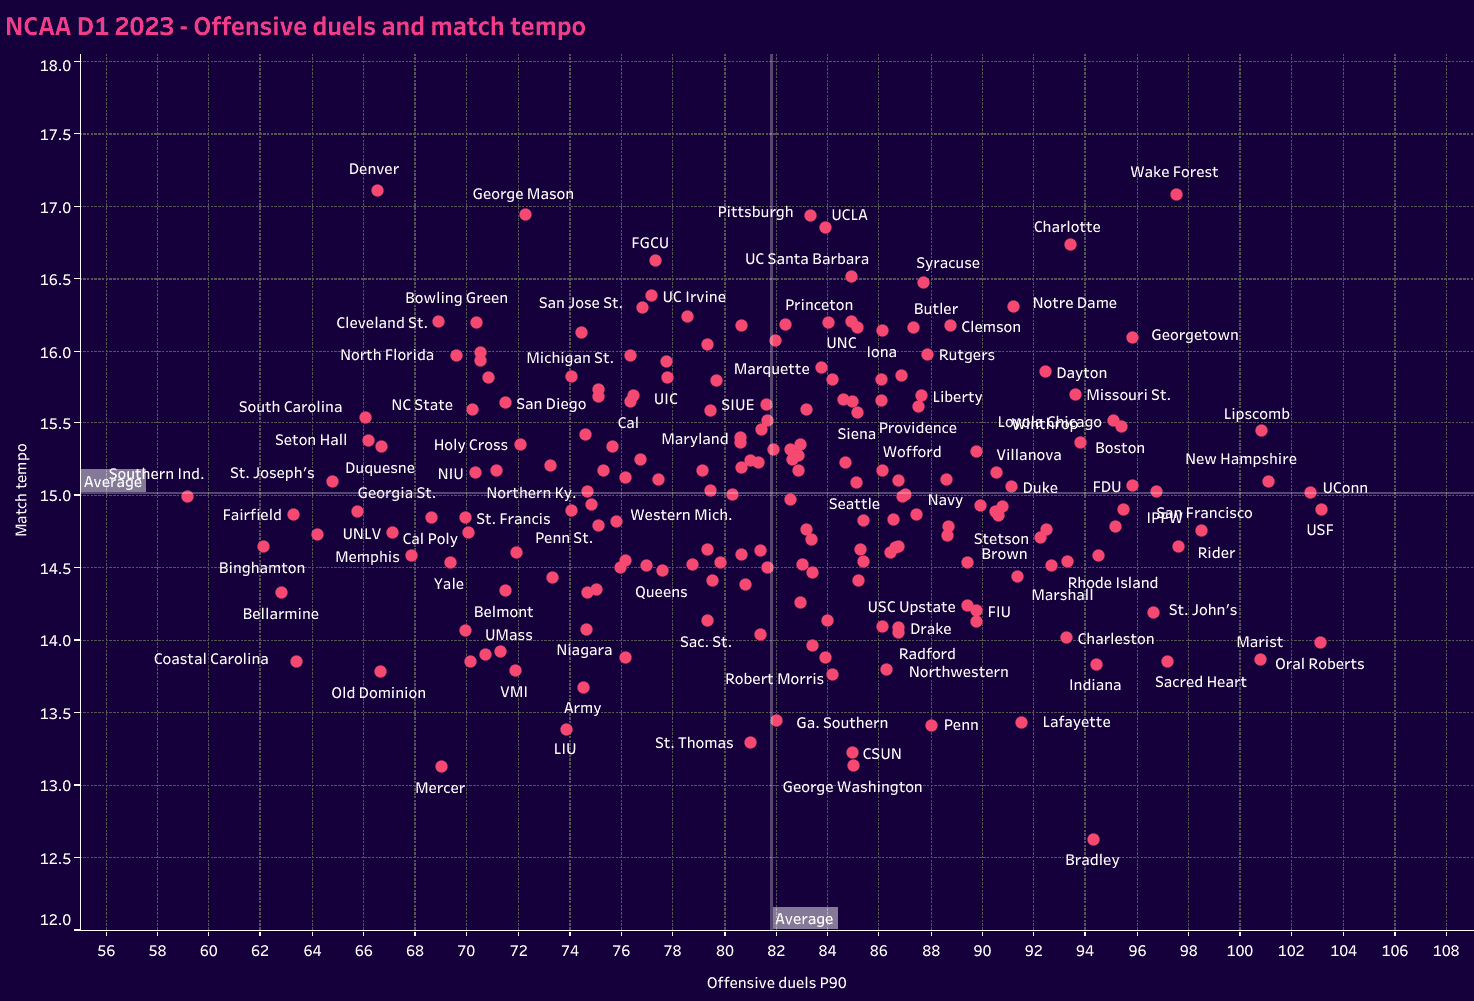
Wake Forest, Charlotte, Notre Dame and Georgetown best exemplified quick ball circulation and dynamic individual ability.
Each of the other quadrants has a few outliers that are somewhat distant from the pack.
Overall, this graph gives a gauge of the speed of play within each program and how likely they are to use the dribble for progression.
The final chart in this section focuses on passing.
Since we have possession statistics, we won’t look at passes P90.
Instead, we’ll look at the ratios of long and progressive passes to total passes.
That’ll give us a glimpse of each team’s tendencies in possession.
A long pass is intuitive, so know that a progressive pass is judged based on the length of the pass relative to different parts of the field.
The closer to one’s goal, the longer the pass has to be.
Wake Forest is certainly the outlier in this chart, easily outpacing the competition in ratio of passes to long passes but also being one of the teams near the top of the progressive passes category as well.
They sent one long pass for every 15.66 passes played and one progressive pass for every 6.7 passes.
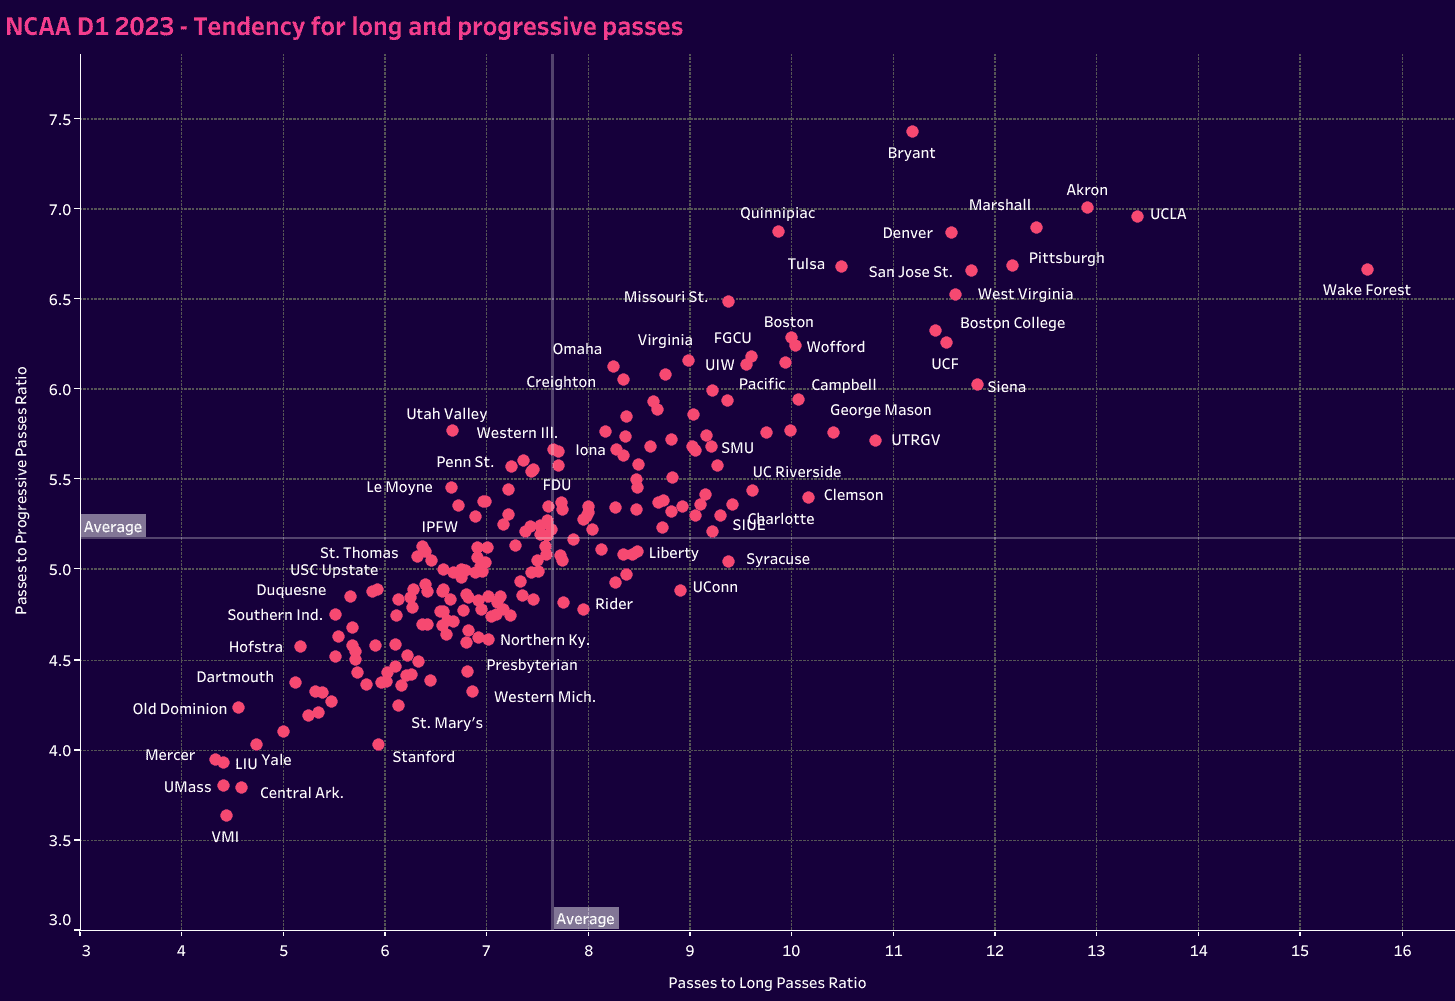
Other than Wake Forest, there is a steady climb up the chart from teams that are more likely to use the long ball to progress up the pitch to the teams that are more likely to systematically break down opponents with short and intermediate passes.
The teams are far less scattered than in previous graphs, giving a fairly clear idea of each team’s preferences in possession.
NCAA D1 Men’s Soccer Defensive Analysis metrics
Finally, we have our defensive metrics.
Part of this will follow from the first section, where we analyzed xGA and goals allowed.
Keeping the opponent from scoring is the number one objective when defending, so we will look at each team’s effectiveness in denying goal-scoring opportunities.
We also want to identify how they press.
Which teams are likelier to use a high press and quick counterpressing as their primary defensive tactics, and which teams are likelier to drop off and absorb space before recovering the ball in their half of the pitch?
The first graph plots shots against P90 with xG per shot allowed.
Look at Bryant at the top right of the graph.
Their season statistics are incredible.
The further a team climbs to the top right of the grid, the fewer shots they are allowed to take and the lower the opponent’s shot quality.
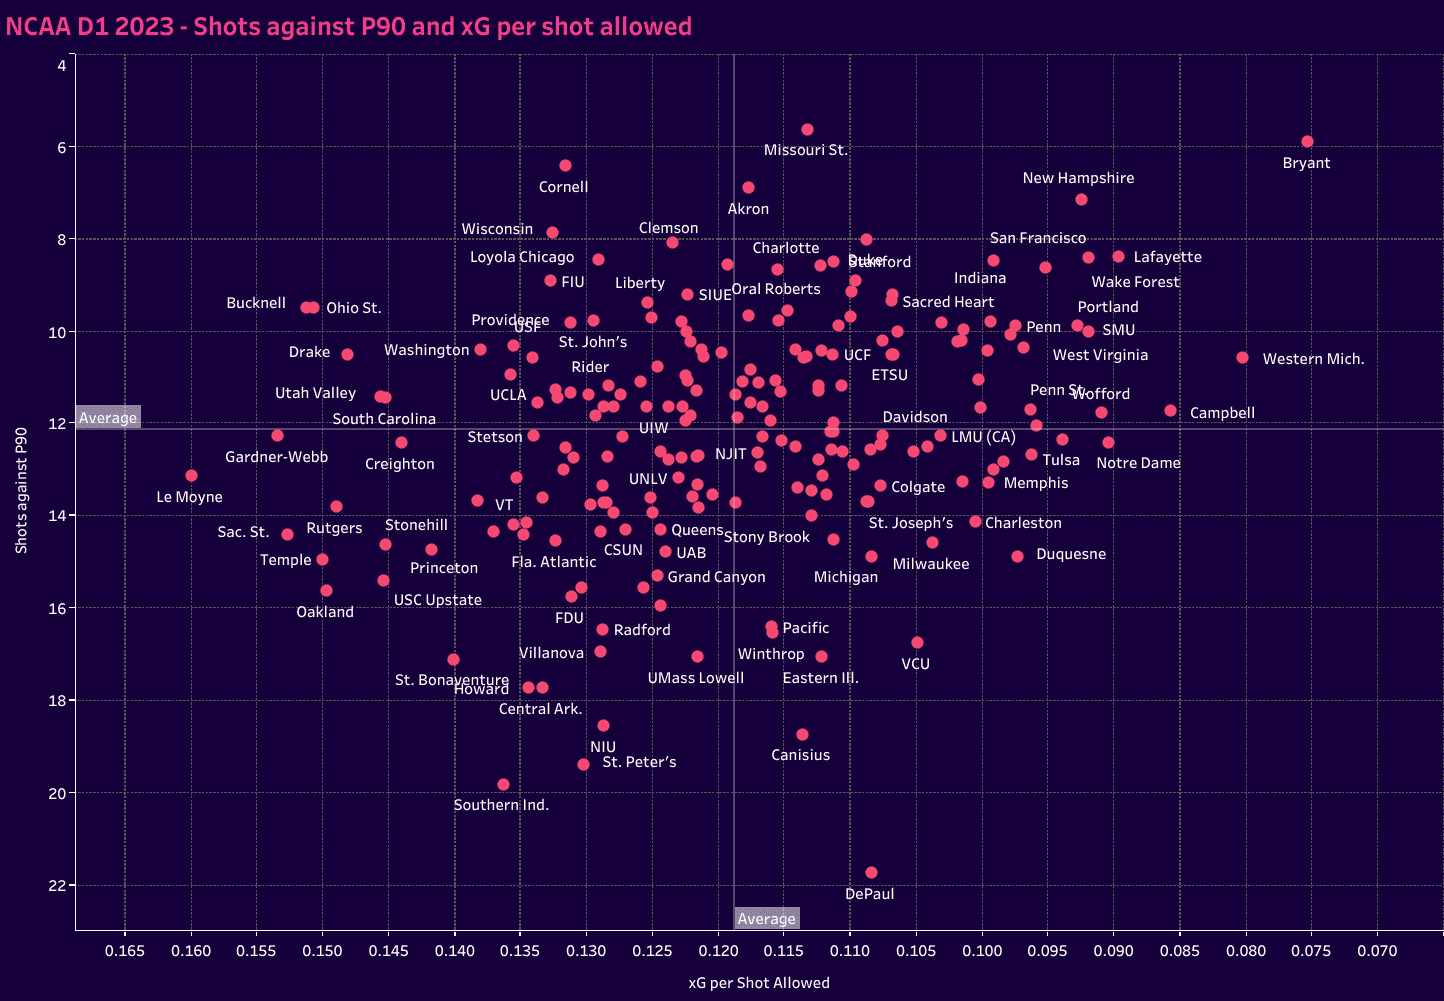
Unsurprisingly, the top right quadrant is littered with top-ranked programs and national tournament contestants.
They represent the top defensive programs in the nation.
But how do they manage these numbers? The same programs that occupied the top right quadrant in the previous graph are somewhat scattered.
A couple of notes are that they range from teams with an average to more intense PPDA (passes per defensive action) and tend to have average to above-average performances in the high recoveries category.
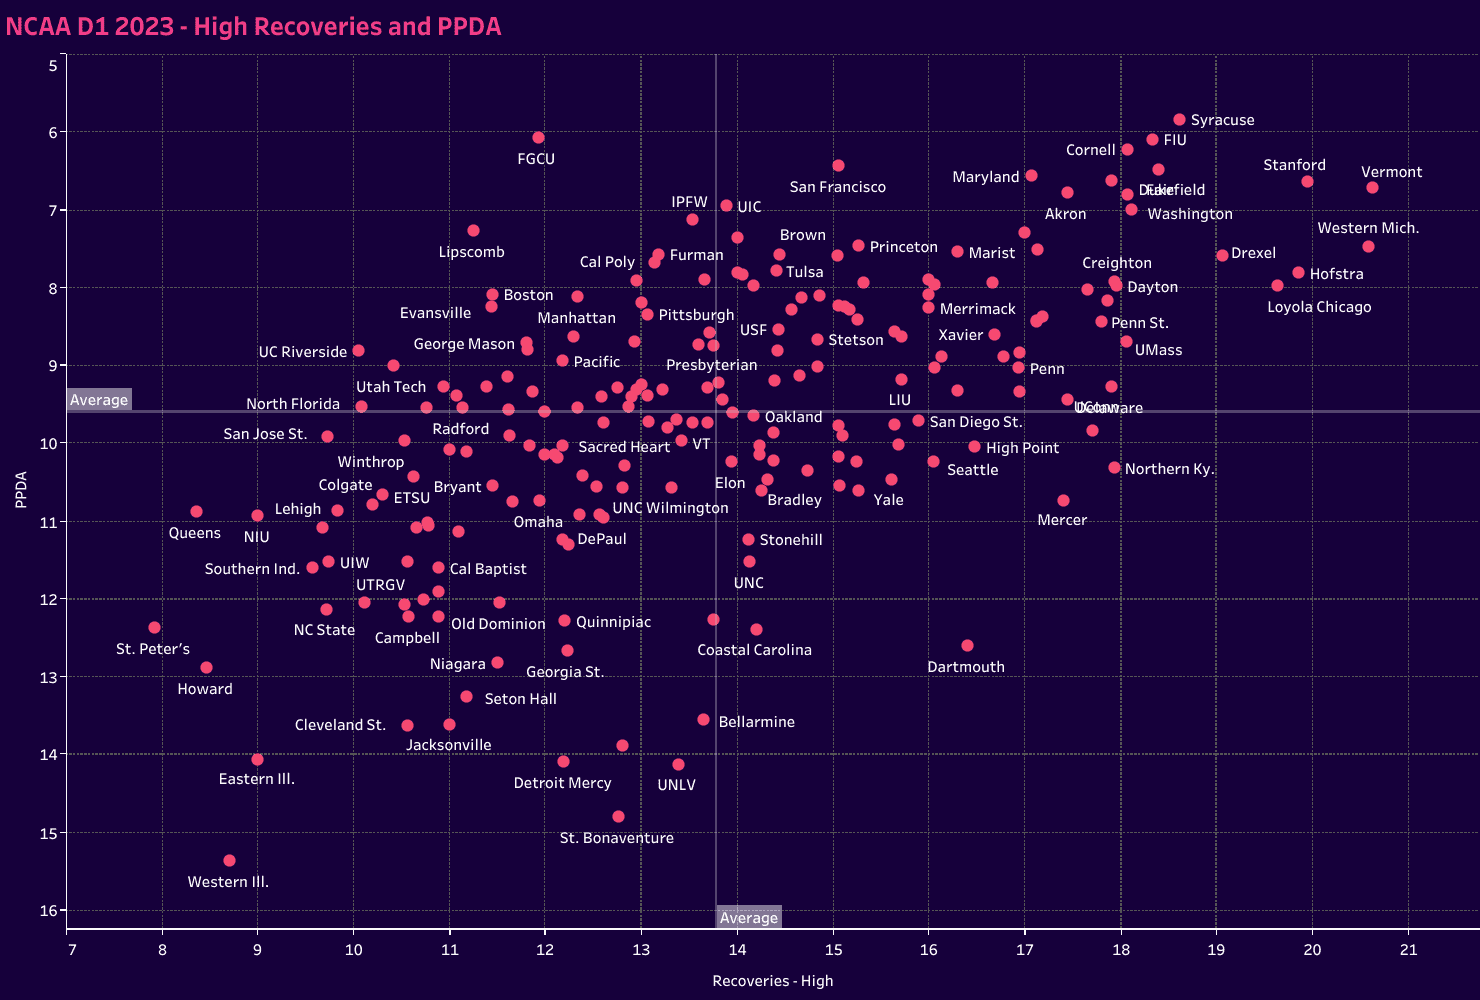
Both Bryant and Sacred Heart fall in the bottom left quadrant but are close enough to the median in each.
Stanford, Western Michigan and Duke represent programs with an aggressive high press and counter-press.
Turning to the mid and low recoveries, we see most of the top-performing programs in 2023 are on the left side of the chart.
More recoveries in the middle third, as opposed to the defensive third, and typically average to well above average recoveries in the middle of the pitch are staples.
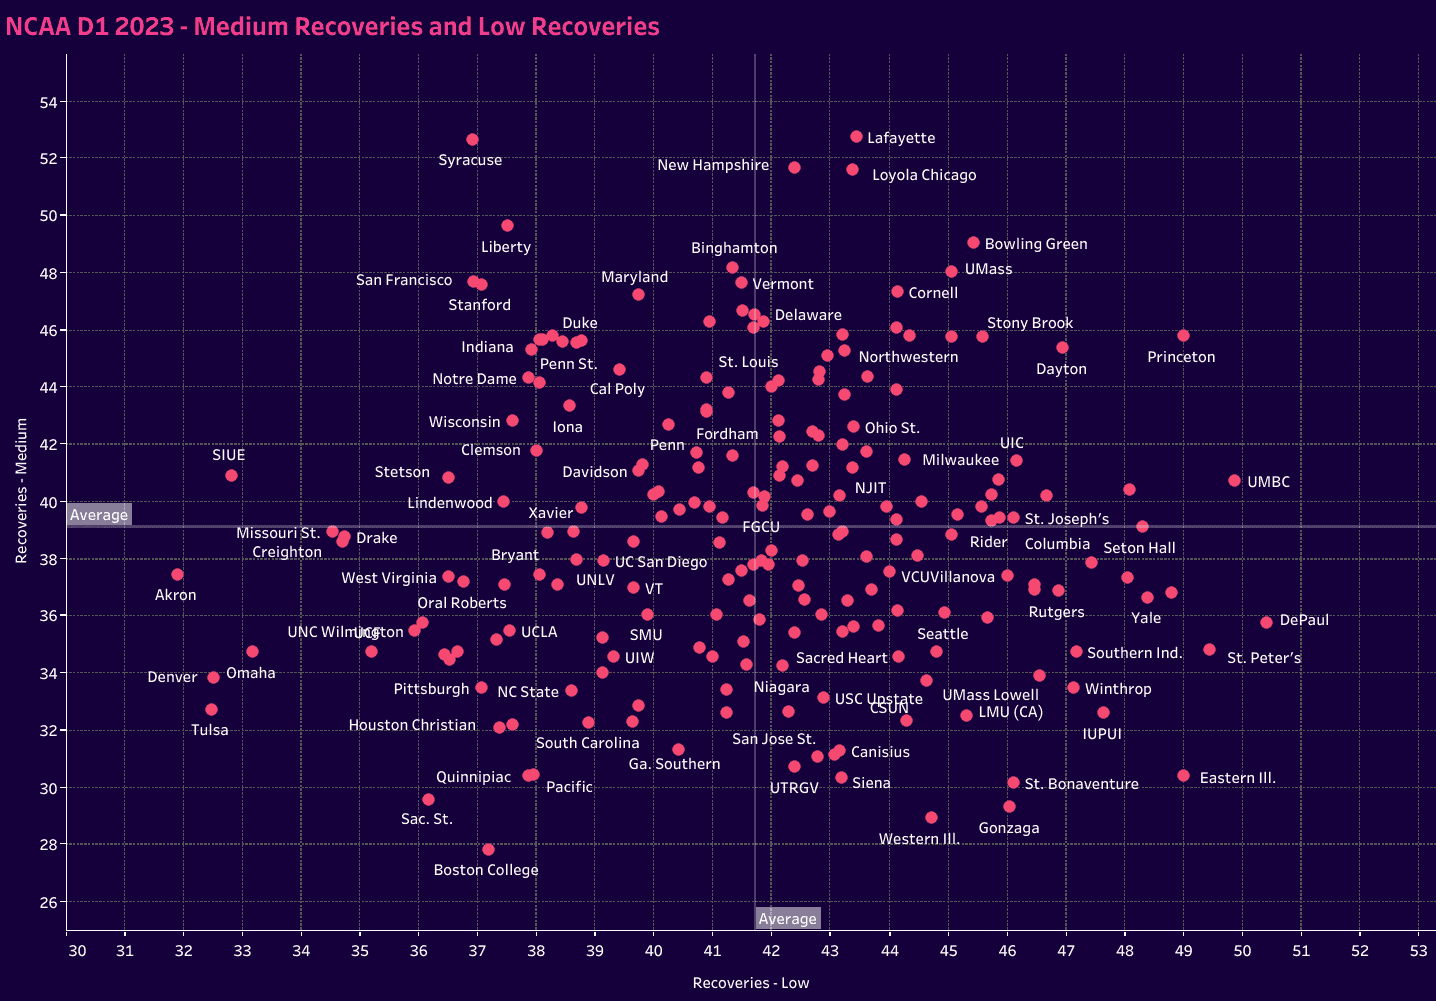
Whether it’s better tactics leading to higher performing teams, more talented individuals allowing for more intricate and aggressive tactics or a bit of both, there is certainly the correlation that top teams recover the ball higher up the pitch.
Conclusion
The 2023 NCAA D1 men’s soccer season is complete, and so is the MLS draft.
Players will move on from NCAA soccer to the professional ranks, dreaming of a dream start to their professional careers and lining up against players like Lionel Messi and the host of former Barcelona players who have joined him at Inter Miami, plus Emil Forsberg, who joins NY Reb Bulls from Bundesliga powerhouse RB Leipzig this January.
Much like the original series, this article is designed to show team performances through data and provide insights for the coaches at each program and prospective players.
For recruits, this is a great way to gauge whether your style of place fits with the programs that are recruiting you.
For coaches, it’s an opportunity to understand how to grow from 2023’s performances.
Whether the coaching staff is long-tenured or there’s a newly assembled staff, these concrete numbers give an idea of the team’s current state and can help pave the way for a productive spring season that better prepares the squad for the fall of 2024.
Data is a means of assessing how well the game model was implemented and determining what changes are needed before August.
As mentioned, the spreadsheet these numbers come from is a combination of complete season data from Wyscout and custom metrics that better connect multiple data sources.
For any coaches who are interested in incorporating data analytics or understanding how their program fared last season, reach out.
We have also compiled the 2023 NCAA D1 women’s soccer data analysis.




Comments