Oxford United have gone slightly under the radar in securing a playoff place in EFL League One. Finishing above big spenders Sunderland and Ipswich Town, manger Karl Robinson has knitted together a side overlooked with the success of Brentford, to get their shot at the Championship. Despite the sales of Shandon Baptiste and Tariqe Fosu to data-driven Brentford in January, Oxford finished fourth, just two points outside the automatic promotion places. The sales didn’t seem to derail their charge and in this recruitment analysis, we will use statistics and data from Transfermarkt to highlight the success of their dealings in the transfer market. By shining a light on the ins and outs at Oxford we will get a better understanding of their recruitment and transfer strategy to evaluate how Oxford managed to compete even with losing some of their star players.
The ins and outs
The first part of this analysis will look into the transfer activity of Oxford, before highlighting the target market and finally the current squad. This section will look into the players signed and sold while comparing the cost of each transfer as well as highlighting the average age. Before going into detail around the statistics and recruitment of Oxford, it must be made clear that any player returning from loan was not counted as a new arrival, as well as players loans who had expired, did not count towards the departures.
In the first graph we look to highlight incomings from the last five seasons.
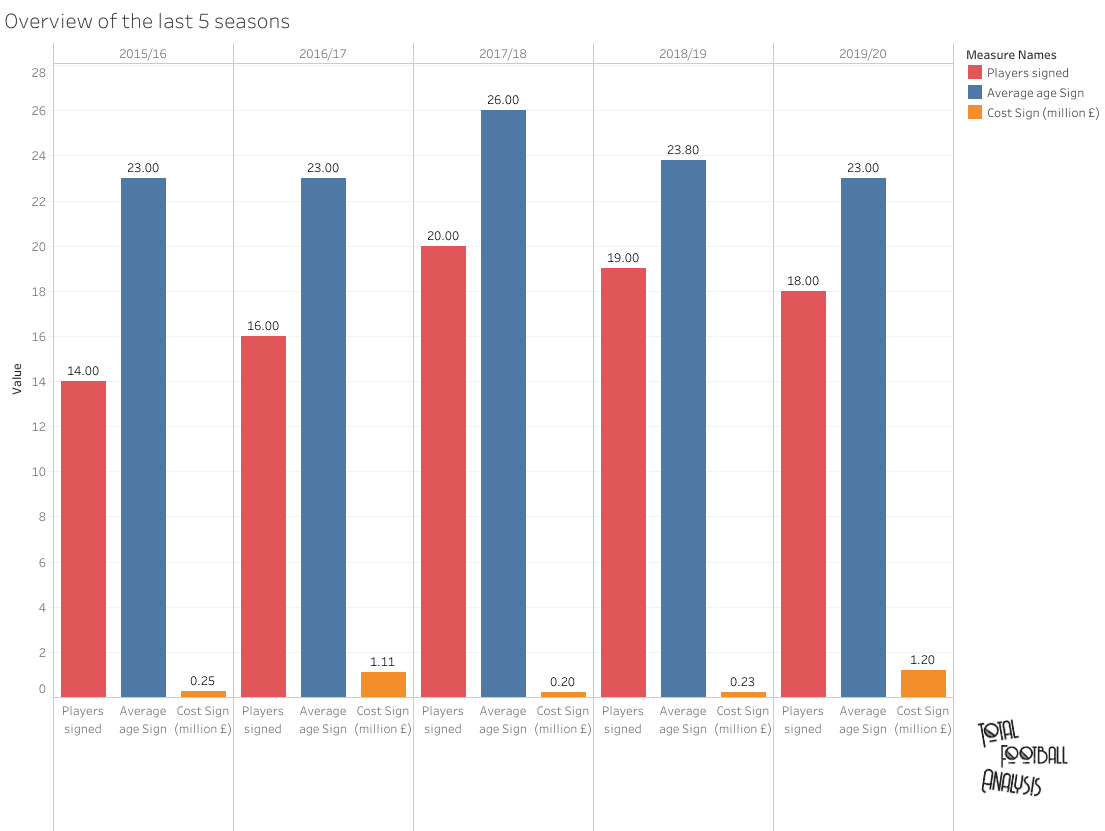
What stands out straight away is the average age. With four of the five seasons between the average age of 23 and 24, the emphasis is certainly on players approaching their peak years. Of the overall 87 signings made in the five seasons, the average age was 23.76 with 17.4 signings on average per season. Attracting players who are on the lookout for first-team football dropping down from the higher divisions has certainly been a strategy of Oxford’s.
Oxford’s spending has shown to be low in comparison to the funds generated through sales. With a collective spend over the five seasons of 3.04m, compare that to 13.07m brought in, Oxford have been smart in identifying low-cost signings with the opportunity for resale value. However, what is clear is that the two seasons with the largest spending, 2016/17 and 2019/20, have come the same season as their largest sales, highlighting the willingness to reinvest in the squad, although not on one signing but spread out over a couple of key additions.
I must note that Marcus Browne signed on loan in two consecutive seasons and does count towards both totals in the seasons for 2018/19 and 2019/20. Additionally, the cost for both Ryan Ledson and Kemar Roofe is undisclosed, so each player was given the average cost of 250k given the other fees paid by Oxford.
Now we will highlight the trends in sales. First of all, the high sales in three of the five seasons explain the cumulative value highlighted earlier. This has led to these seasons generating over two million in profits with at least one individual sale of over a million.
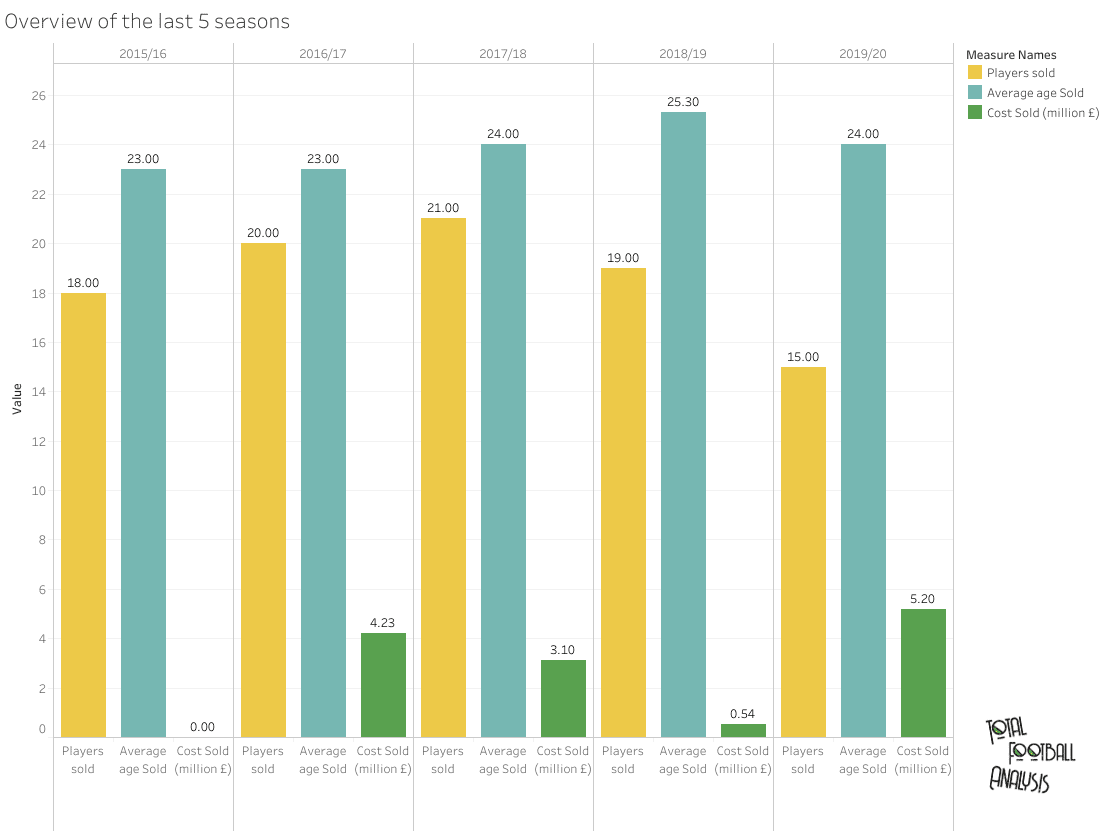
Overall Oxford made 93 sales over the five seasons with an average of 18.6 per season. The average age for these sales was 23.86, only slightly up on the signings with the 2018/19 season the biggest individual difference of 1.5. I must note that players who previously went on loan were counted as separate sales to when they left permanently if they were in different seasons.
Of particular interest is the rise in the average age of sales. This, in particular, comes down to less young players moving out on loan to sides in lower divisions. But crucially there is also an emphasis on Oxford retaining their better players for longer before selling with less financial pressure given the big sales in previous seasons.
It is important as well to highlight the profits made on individual transfers as seen in the graph below. The graph showcases the fee Oxford paid for these players in comparison to the fee they received.
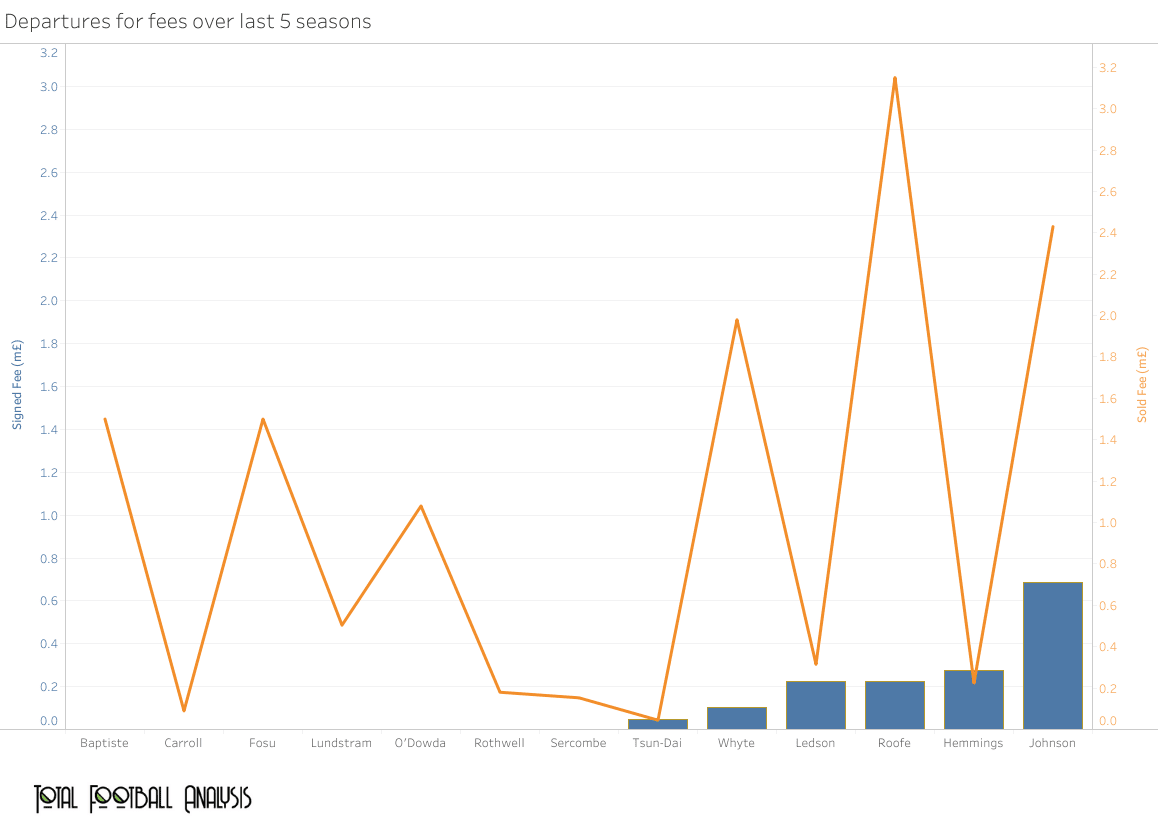
A common theme is the large number of players signed on free transfers who then commanded fees. All of these players also moved to clubs who were either at the same step as Oxford or above. This is similar for all the players on this graph, baring one which is Kane Hemmings, the only player to record a loss and move to a lower division.
The transfer of Fosu stands out, given the player was signed on a free just six months earlier, to then sell him on as part of a combined fee with academy product Baptiste (Reported fee for this deal was 3m, both players given a sold fee of 1.5m). As well, academy graduate Callum O’Dowda, sold for over a million to a side in a higher division another example of a player who potentially could be more valuable in the future.
Players such as John Lundstram, Joe Rothwell, Ledson, Roofe, are examples of the unique market targeted by Oxford. All four were young signings either brought in on free transfers or minimal fees, from EPL sides. The opportunity of game time best described by Lundstram upon joining stating he ‘needs a full season out there playing 30-odd games’ attracted these players to reject likely better contracts at their current clubs in search of first-team football. With all four players selling for profits, Roofe commanding the biggest fee of 3.15m, this strategy highlights Oxford’s success in targeting the young market with high resale value.
With only Hemmings dropping to a lower tier of those who commanded a fee, this next graph highlights the destination of all 93 of Oxford’s sales in the past five seasons.
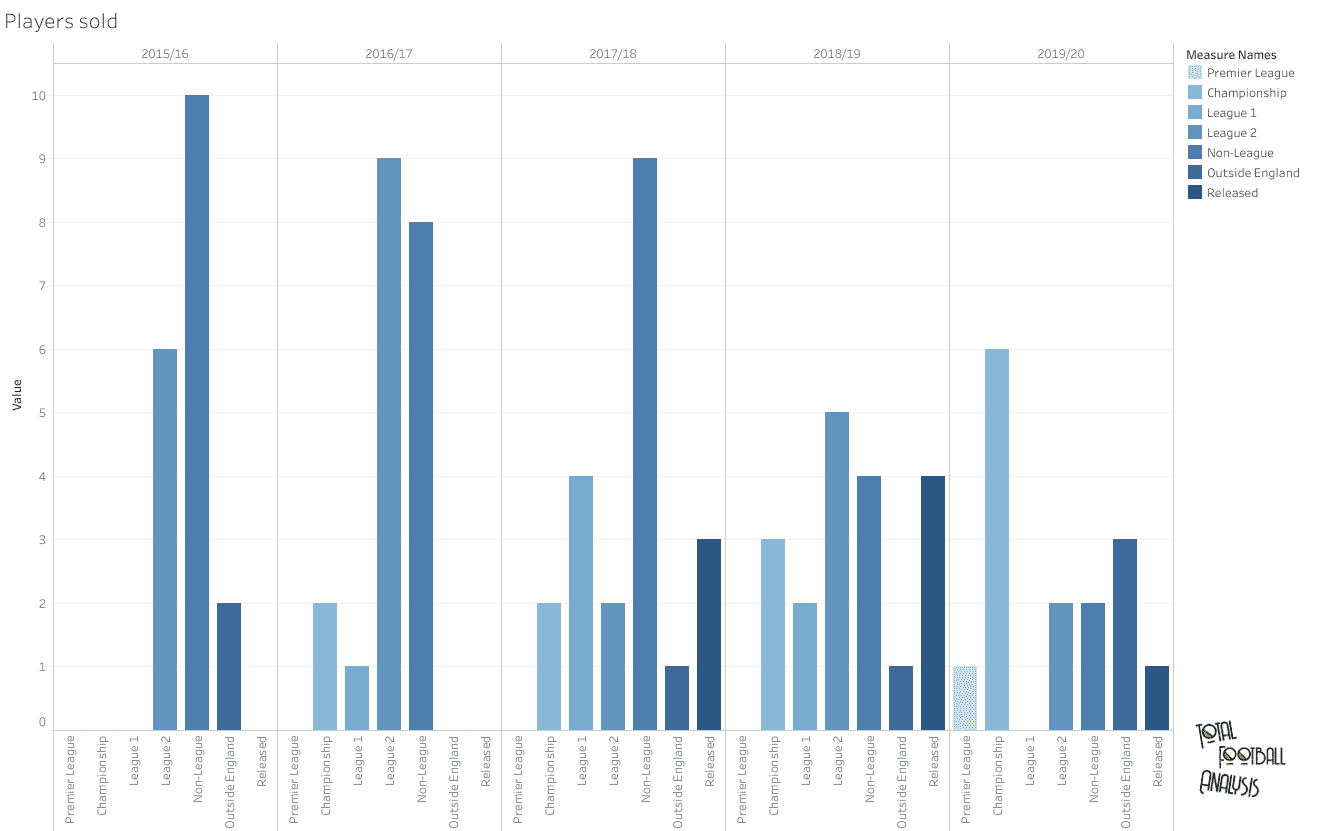
What is important to notice is that as the club became an established League one side, the number of sales to the Championship rose to 13 in total with an average age of 22.7. With the sales as mentioned attracting interest from the higher divisions, this has allowed Oxford to command larger fees for the quality they are producing alongside their progression on the field.
It must also be noted the high number of players moving to League 2 and non-league are made up mostly of those gaining experience in loan deals to local sides in and around the Oxford area. Certainly, the drop off in this area in more recent seasons, highlights the first-team opportunities given to these young players which we will highlight later.
The target markets
In the second part of this recruitment analysis, we will highlight the target markets Oxford have recruited from. By looking into the divisions in which Oxford have focused most prominently, we can look to identify the possible transfer strategy which has been implemented with such success over the last few years. First we will identify the leagues Oxford targeted most, before looking into the cost of said incomings, Identifying the reoccurring theme as to the type of transfers Oxford make.
In this first graph we will look at the divisions Oxford targeted for signings in the past five seasons.
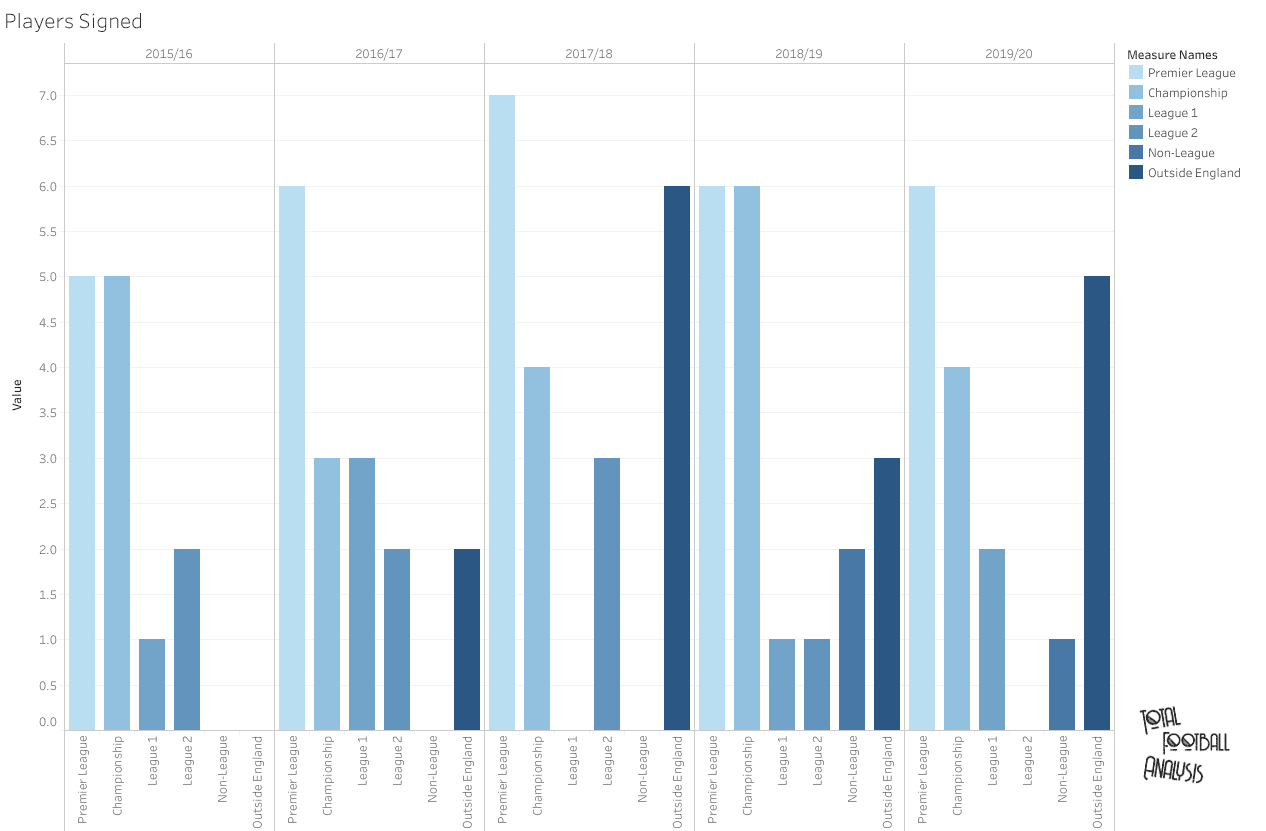
This graph shows Oxford’s strategy of recruiting from EPL sides with 33.3% (29 signings) of all of Oxford’s transfers in the past five years coming from the top tier. Oxford have additionally signed 22 from the Championship (25.2%), 17 from outside England (19.5%), 7 from League One (8.05%), 6 from League Two (6.89%) and 3 from non-league (3.44%).
What is also important to highlight is the spike of recruitment from outside of England in 2017/18 including the signings of former Barcelona midfielder Xemi and Celtic defender Fiarce Kelleher. A definite switch in the recruitment strategy given the difference to the season after with only three from abroad, including two from Northern Ireland in Gavin Whyte and Mark Sykes.
As well as highlighting where Oxford targeted, it is also important to consider the type of deals they favour most over the last five seasons.
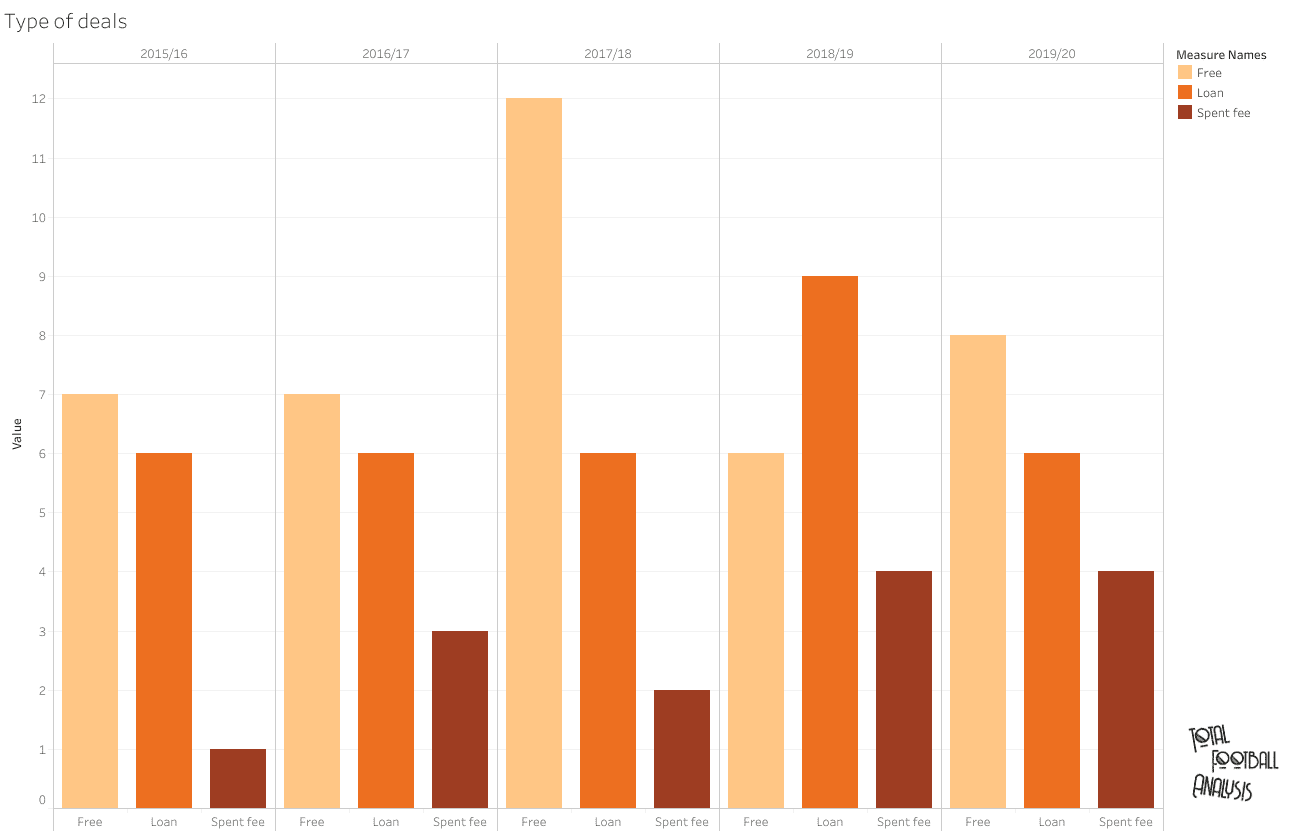
As you can see above the type of deals have been split into free transfers, loans and finally any transfer that involved a fee. Any players who moved up from the under 23 or under 18 side have not been included.
The obvious standout is the high number of free transfers in 2017/18, which goes in accordance with not only the highest number of transfers from outside England as discussed earlier, but also this season had the highest average age of the five. As the majority of these players left the following season, you can see the reliance on loans increases with 2018/19 the only season where loans overtook free transfers.
Out of the possible 87 signings, 33 were loans with 18 from the EPL. 39 were signed on a free transfer with 14 signings involving a fee. However, there is a clear increase in the number of transfers involving a fee. With the club making healthy profits, plus the need for higher quality to compete towards the top of League one, Oxford are clearly more willing to spend to compete given their intelligent strategy to generating profits.
The current squad
In the final part of this analysis, we will look at the common themes of the current first team at Oxford. By looking into the current side and past sides, we can identify the opportunities given to such players moving towards their peak years. Scoping in on the current side, allows us to identify those who are next in line for a possible large resale value, adding to the growing list of already healthy profits.
In the first graph we will take a look at the minutes played against the age of the current Oxford side using the app created by Robin Wilhelmus. For each player the dot represents their minutes played out of a possible 4,440 minutes, against their age, as well as shown by the black line attached the time elapsed in their current contract. The yellow shaded areas simulate the retrospective peak age for players.
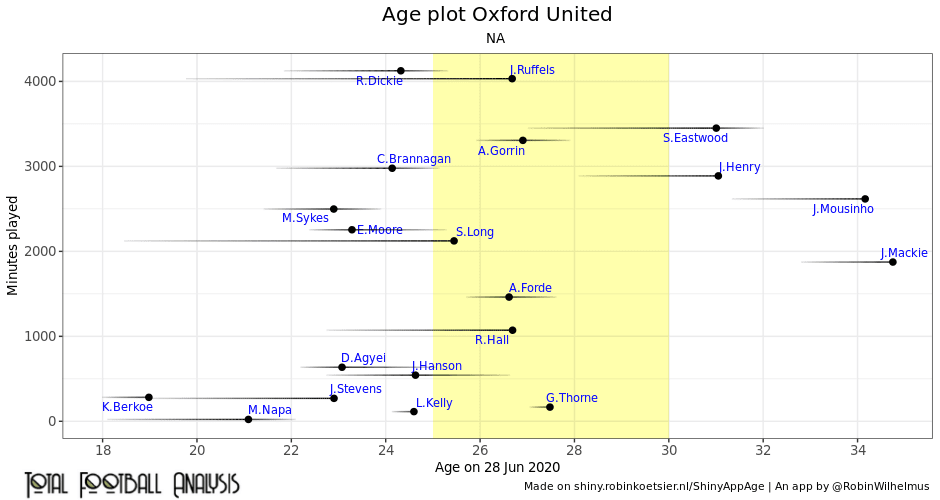
What stands out straight away is the number of minutes given to players approaching their peak years, as highlighted earlier with the opportunities for Lundstram. Cameron Brannagan, Rob Dickie, Moore and Sykes all recorded over 2000 minutes while in the age range between 22 and 25 approaching their supposed best seasons. As well as the number of minutes for each of these players, the fact that their contracts are all with at least one season remaining giving Oxford an opportunity to negotiate for healthy resale value.
On the other end of the scale, Jamie Mackie, John Mousinho, James Henry and Simon Eastwood are the only players past their supposed peak years. However, with the number of minutes each has contributed you can argue that the outlay on these players is justified. It is also important to mention that three of the four are out of contract. with Oxford’s involvement in the playoffs at the time of writing no retained list had been provided and it is unclear whether they will be staying.
Also, with these players mentioned are the spine of Oxford’s team. Oxford then build around them with younger players, with fewer minutes but also moving into their peak years, such as Agyei and Hanson. These players with minimal minutes are all in the position to replace established first-teamers if needed or be sold to fund the next crop.
Contrast this to a similar graph but from the 2016/17 season. With a similar emphasis on players aged before their peak years, this is clearly a strategy implemented at Oxford.
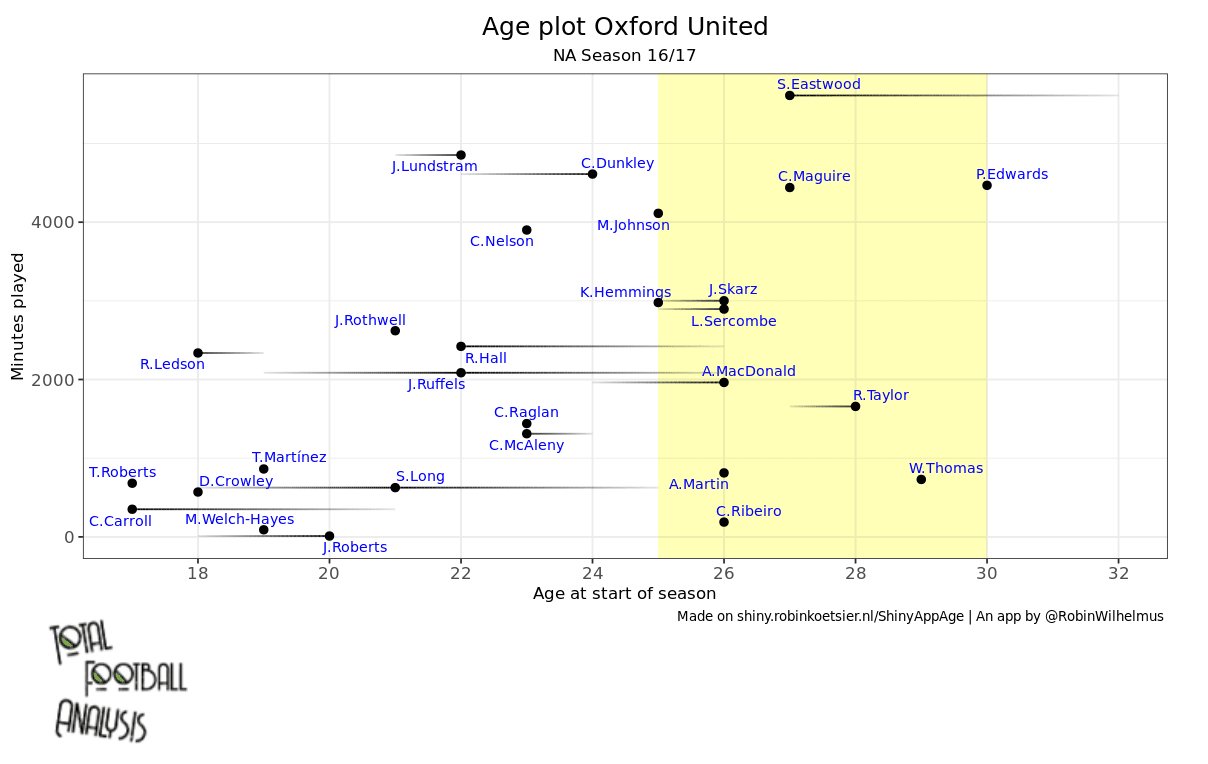
What is important to recognise here is the players who went on to command fees or move to a higher division (Ledson, Lundstram, Rothwell, Chey Dunkley, Marvin Johnson, Curtis Nelson) are all at a similar point to those in the current side (Brannagan, Elliot Moore, Sykes, Dickie) with over 2000 minutes and approaching their peak years.
With the sales of these players it has led to a change in the recruitment market as mentioned earlier. The money generated has shifted from a reliance at times on loans from the premier league to purchasing young talent to develop and mould themselves. Although there has been some reliance on loans in this current season, this season has also shown the fewest loans from the premier league on par with the 2015/16 season (3 loans). A move towards loans with the potential to become permanent has certainly been a strategy of Oxford’s, beginning with Roofe in 2016, and now Thorne in 2020.
Finally, is the lack of players over the age of 30, with only Eastwood appearing as part of the current side. But a shift in the quality of older signings has certainly changed, with those approaching the end of their peak years, declining in the number of minutes. A stark contrast to those in the current side of which see these experienced players as an integral part of the squad.
Conclusion
With an average age of 25.4, Oxford have a side on the verge of hitting their peak years. Identifying players early in their career have allowed Oxford to reduce their outlay and be patient to develop these players with the goal aimed towards a large resale value.
An important factor has to be the utilisation of the loan market. Identifying players who can become potential permanent signings either on a free or for a minimal price. With the game time Oxford can provide this has allowed these players to flourish and put themselves in the shop window while progresses Oxford up the division.
Keeping hold of these players to push for promotion will be Robinson’s next biggest challenge with those next in line already attracting interest come the summer window.



Comments