Set piece situations have the ability to define a team’s season and win vital points which can be the difference between staying up and relegation, or continental qualification and mid-table obscurity. As a result, like everything in football, more focus and detail is being put into set-pieces, with different strategies and trends used by different teams. In this series of set piece analysis articles, using routines and data, I will be looking over several leagues at the offensive and defensive trends that have arisen in the 19/20 season, with this week my focus being on the Premier League‘s offensive trends around the near post zone.
To assess trends within this tactical analysis, we will mainly be looking at the expected goals and number of deliveries attempted into specific zones from corners, with certain teams standing out in each area. This piece will be focused on near post deliveries and the routines used by clubs within the league.
Goals and xG
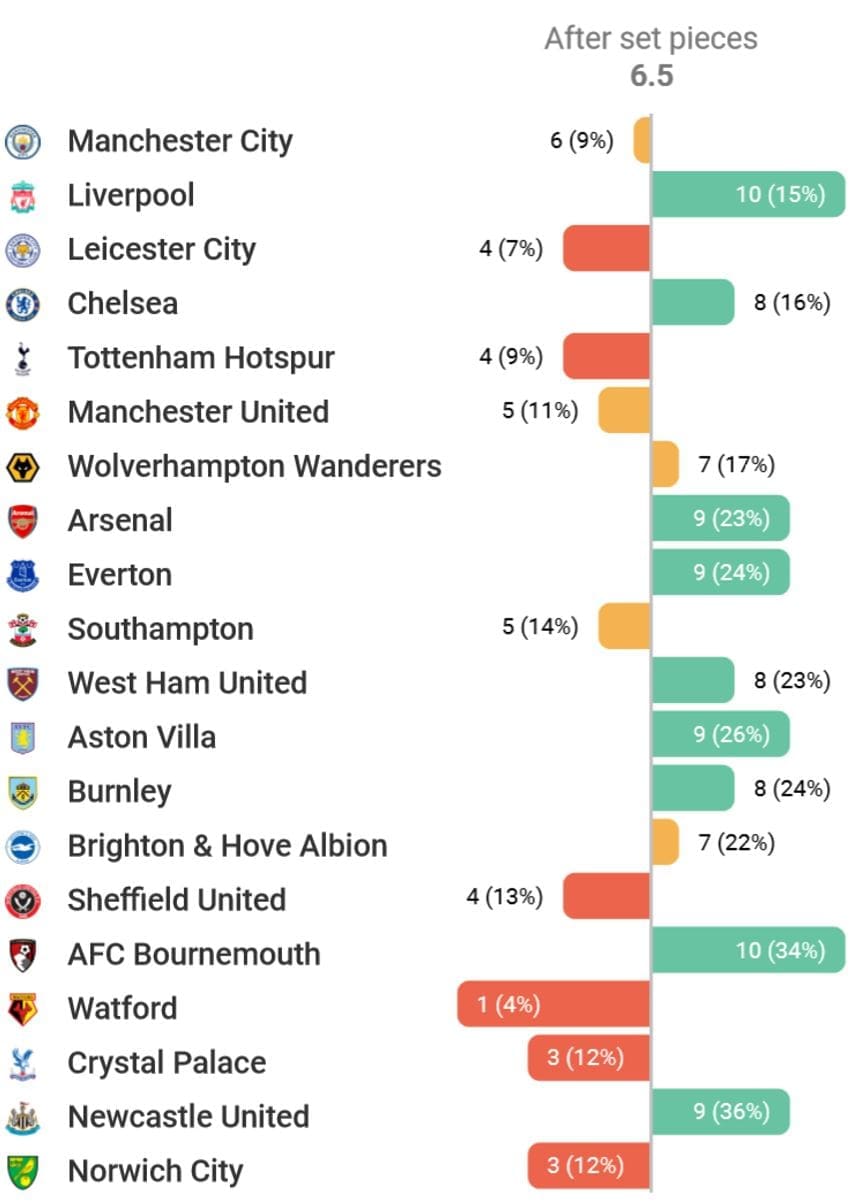
The most basic stat to look at from set-pieces that provides some context on each team is goals scored and their expected goals. We can see below a chart detailing this, with the average number of goals scored from set pieces this season being 6.5. The two best sides from set pieces in the league this season according to Wyscout in terms of goals scored are Liverpool and Bournemouth, with the worst teams being Crystal Palace, Watford and Norwich.
We can compare each team’s goals to their xG from set-pieces here below, with both averages for each metric also placed on the graph. We can see Everton have generated the highest xG from set-pieces with 4.86 xG, with West Ham (3.84), Brighton (3.94) and Burnley (3.71) also ranking well. The worst performers for xG were Wolves (1.42), Watford (1.41) and Aston Villa (1.28), who all fell well below the average of 2.63. The differential of each team can also be seen in the difference between the two bars of each team, with the biggest overperformances unsurprisingly being from the teams with most goals, with Liverpool, Bournemouth, Newcastle and Aston Villa all having large differentials. But what does this tell us?
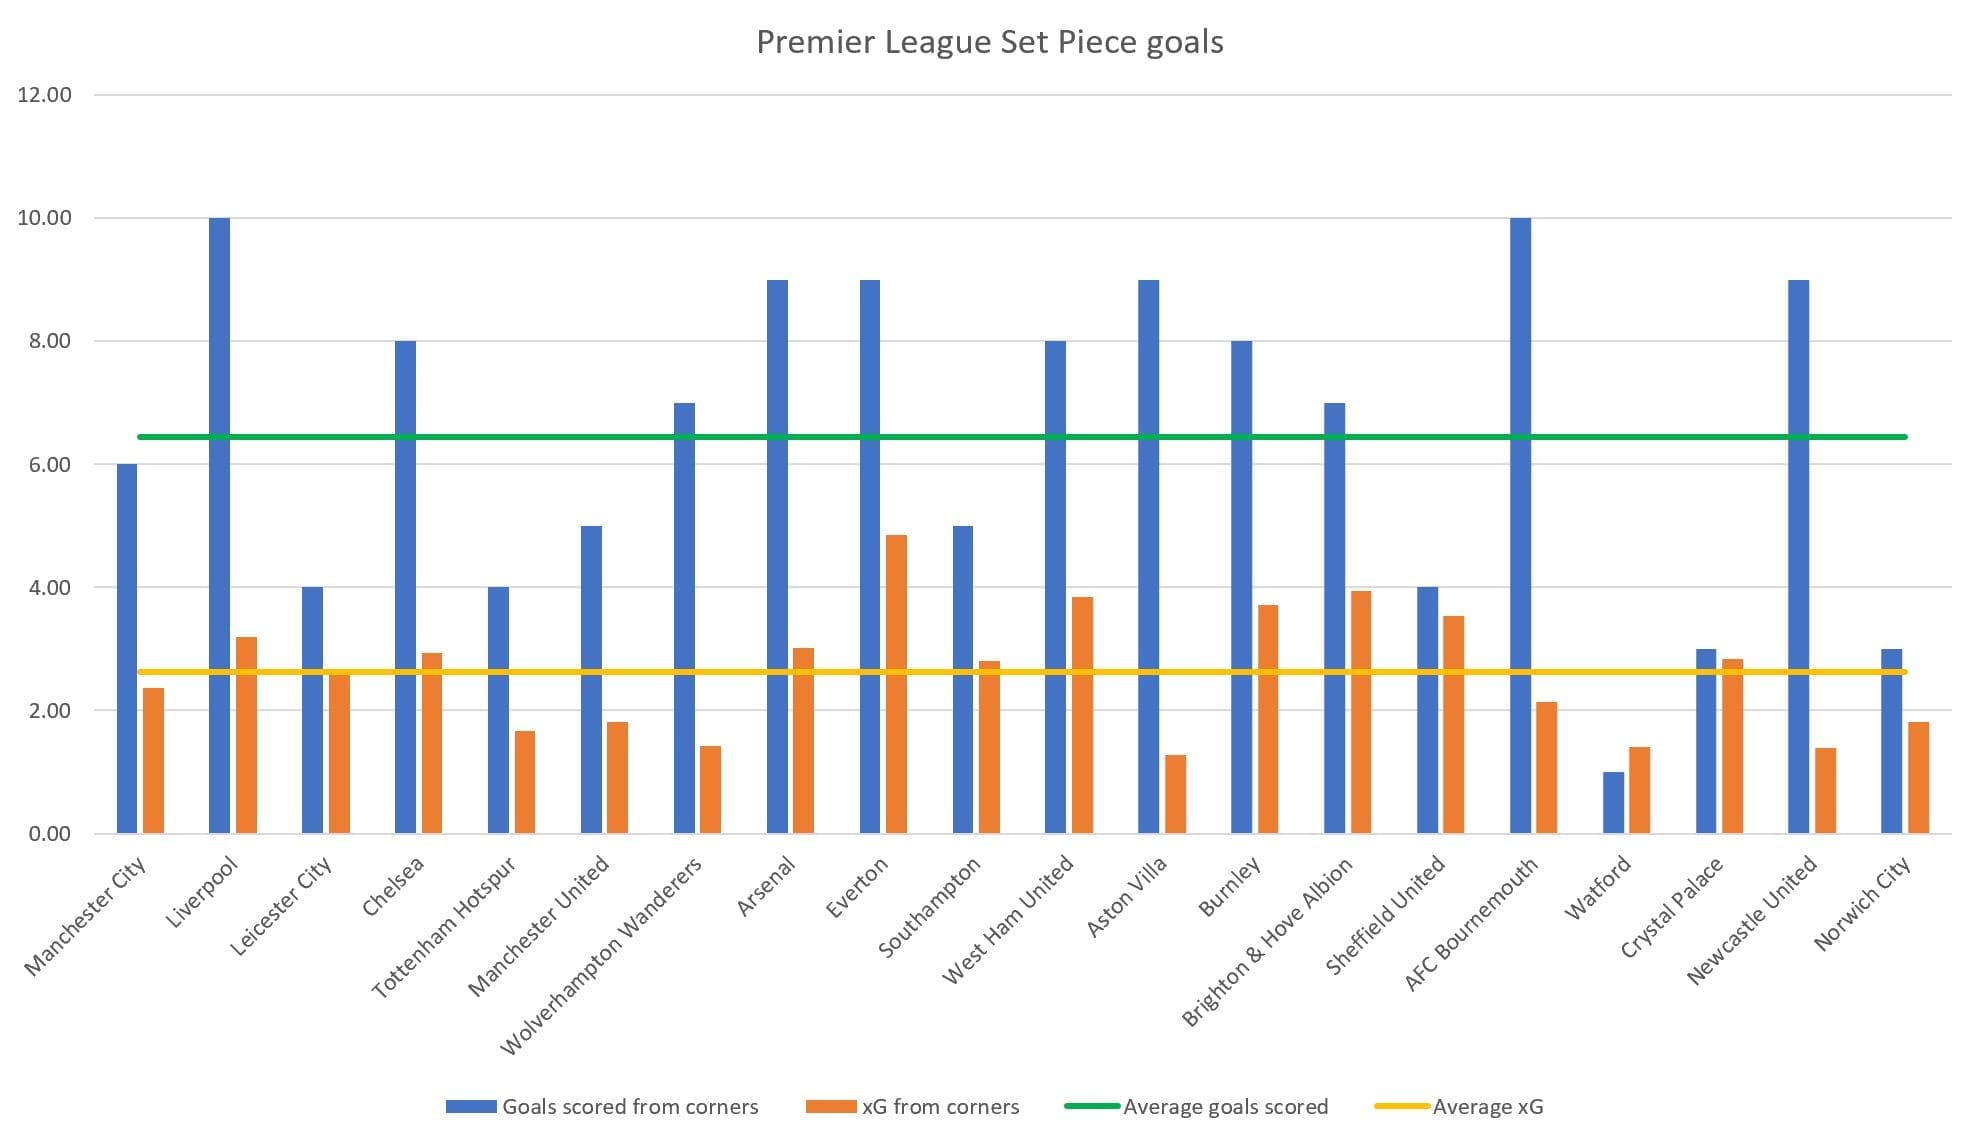
xG ranks chances from set-pieces as very low, and so as you will have noticed the xG generated is low, but scoring ten goals per season or scoring four can make a massive difference.
Data by zone
One of the main trends I was interested in investigating was the number of crosses from corners going into each zone, and how effective each zone was in generating chances. For this, I calculated the average number of attempts made towards each zone across the whole season, as well as the average shots and xG per team.
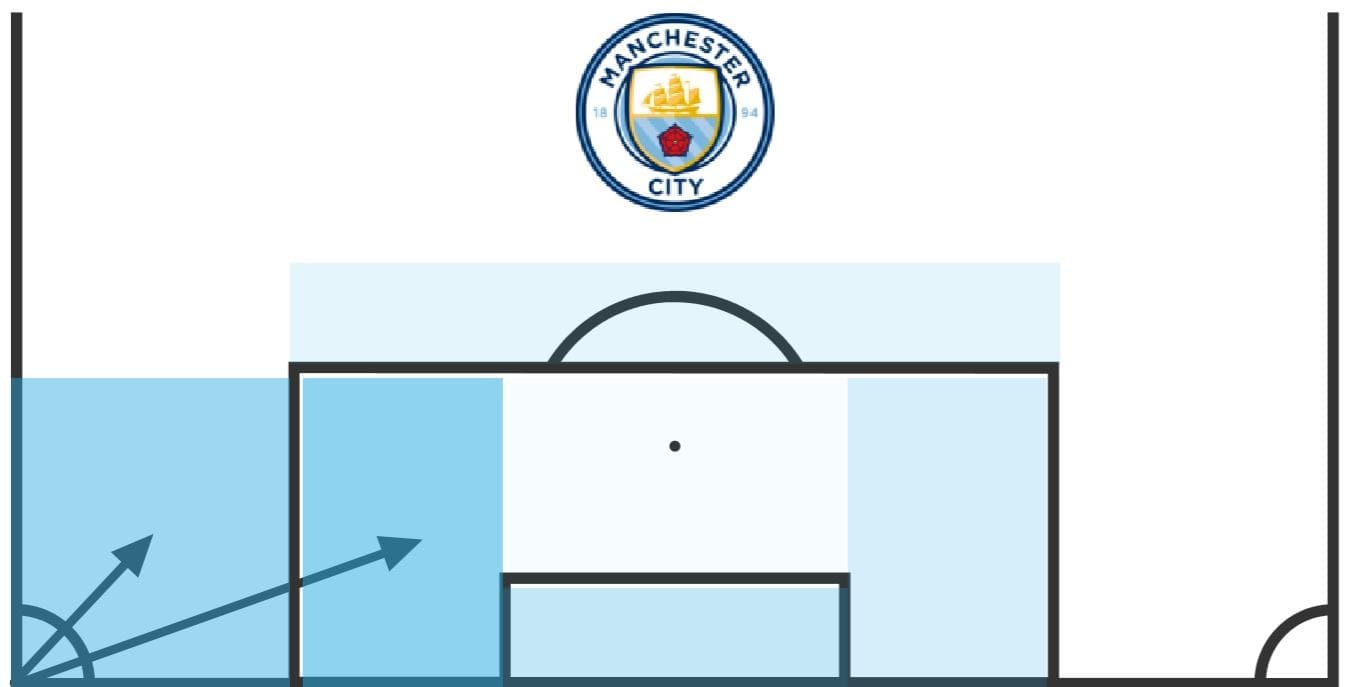
But before we get into the trends highlighted, we must look at the definitions of each zone, as there are some limitations in this regard. We can see a graphic below showing the most used zones by Manchester City this season, with the near post zone and short corner zones the most used. We can see how Wyscout defines each zone also, with the main limitation being the near post zone in my opinion, which is the focus of this piece. Wyscout has the near post zone as from the edge of the box to the edge of the six-yard box, meaning if a corner is delivered into what I call the ‘golden zone’, then it won’t be considered a near-post delivery.
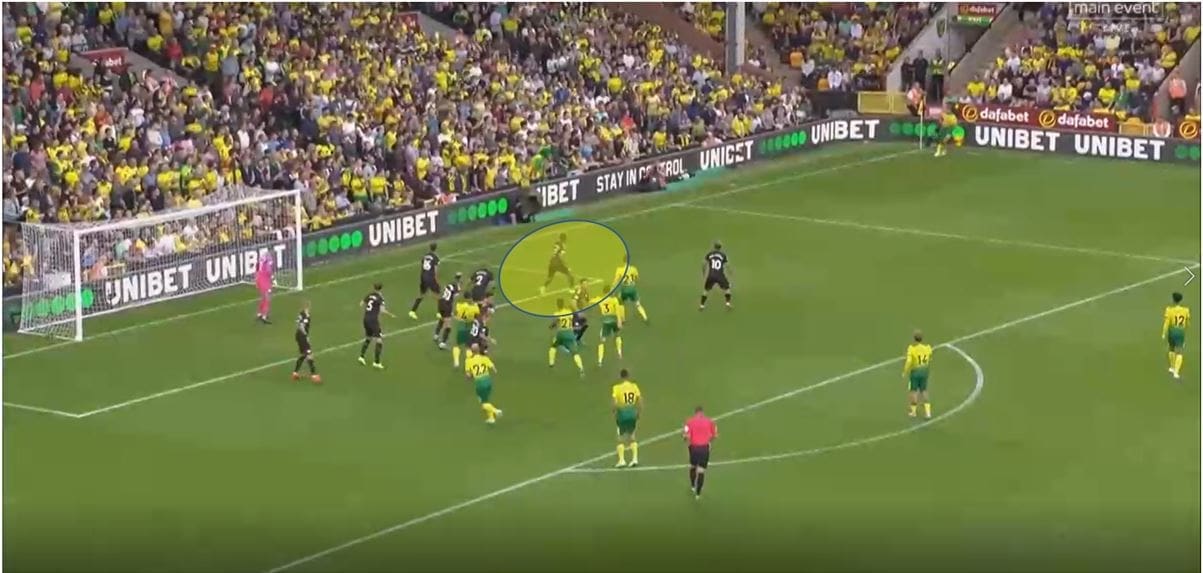
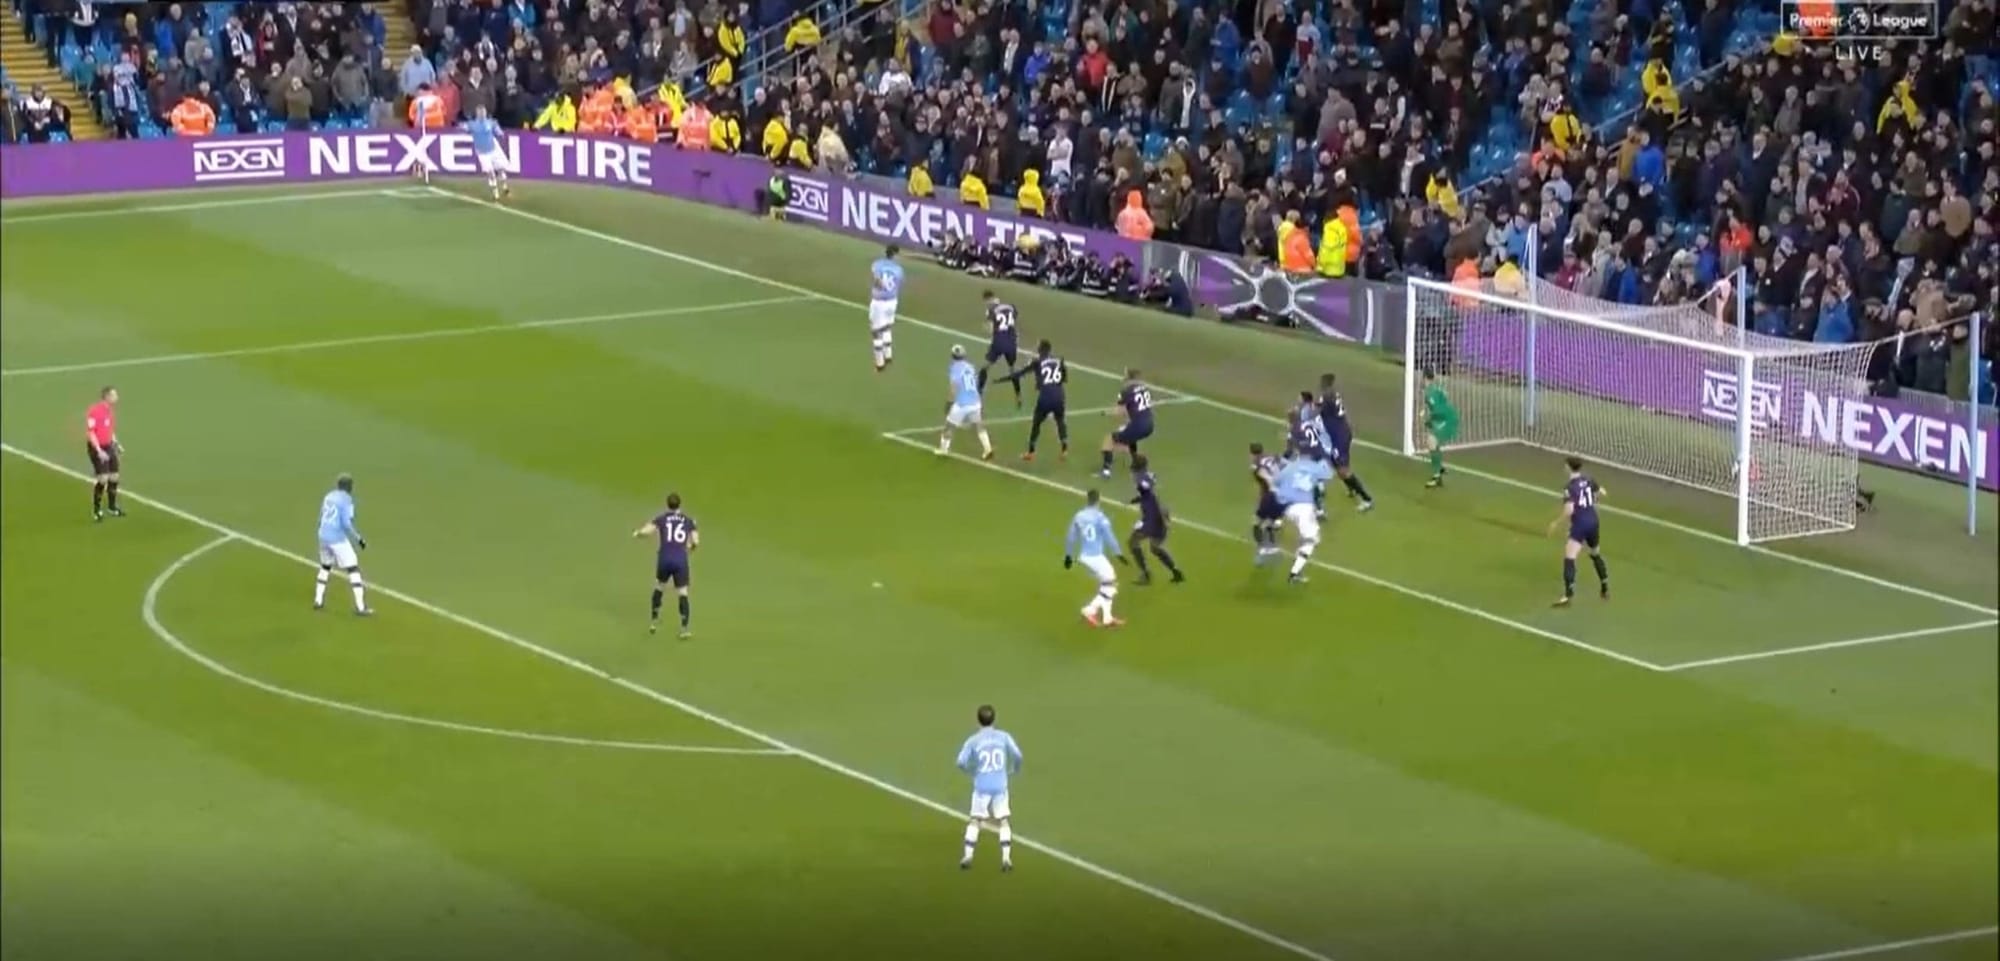
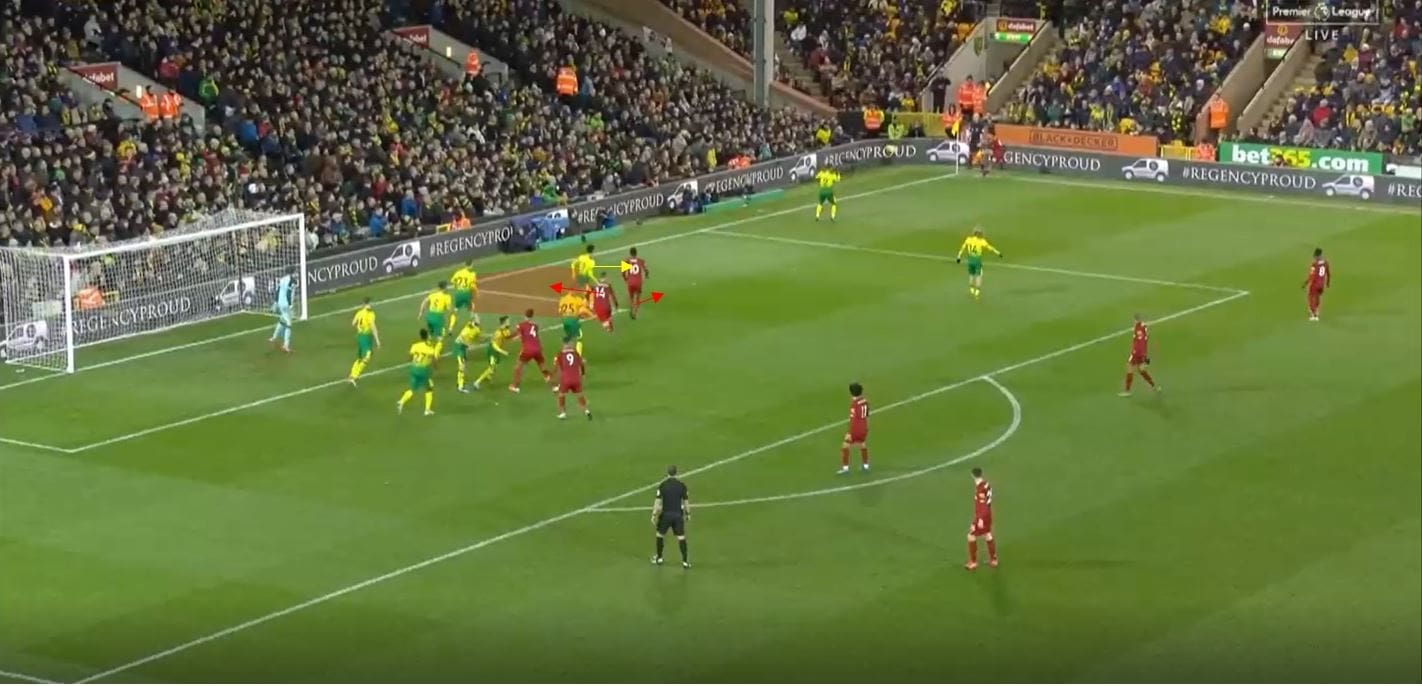
This ‘golden zone’ is located around the near outside corner of the six-yard box, and is a key area in which many deliveries go towards, simply because it is the closest distance to both the goal and the ball carrier that gives a useful angle. We can see below this zone highlighted, where Man City are punished by Norwich when they place Raheem Sterling as the zonal marker of this area of the box and concede.
Now if I was usually writing a set-piece analysis, I’d term this a deeper near-post delivery as the ball stays on the near side of the post, but according to Wyscout a delivery into this zone could be a penalty area zone if it is outside the six-yard box, or a GK zone if it is marginally inside. As a result, some of the terminology and data has to be scrutinized slightly. A very large proportion of near post deliveries may therefore be failed attempts at delivering the ball into a different zone, as it is a fairly common occurrence for players to not get the delivery past the first player. Equally they could be flick-ons in order to get a higher xG chance in another area.
We can see the data and some of the trends below. The most deliveries went into the GK zone and near post area, while the most shots were generated from the far post and GK zone. For almost the same number of attempts, the near post zone averaged two fewer shots and a much lower xG average than the GK zone, which is a trend I’ve somewhat discussed but will further discuss later.

The zones are also ranked in ascending order in terms of average xG per attempt, with the GK zone marginally offering more xG per individual attempt, which may seem obvious due to its proximity to the goal. The penalty area was the most efficient way to get a shot on goal, with on average 3.6 attempts needed in order to get one shot, while staggeringly 8.9 attempts were needed to generate one shot on average in the near post area, which again reinforces my point about Wyscout’s zones being not great on a whole league level.

Certain teams display different trends and tactics in each zone, and so now we will move onto how each team performs in the near post zone, which makes the data more usable because teams can be compared to one another and we aren’t just using an average to make conclusions.
Near post zone
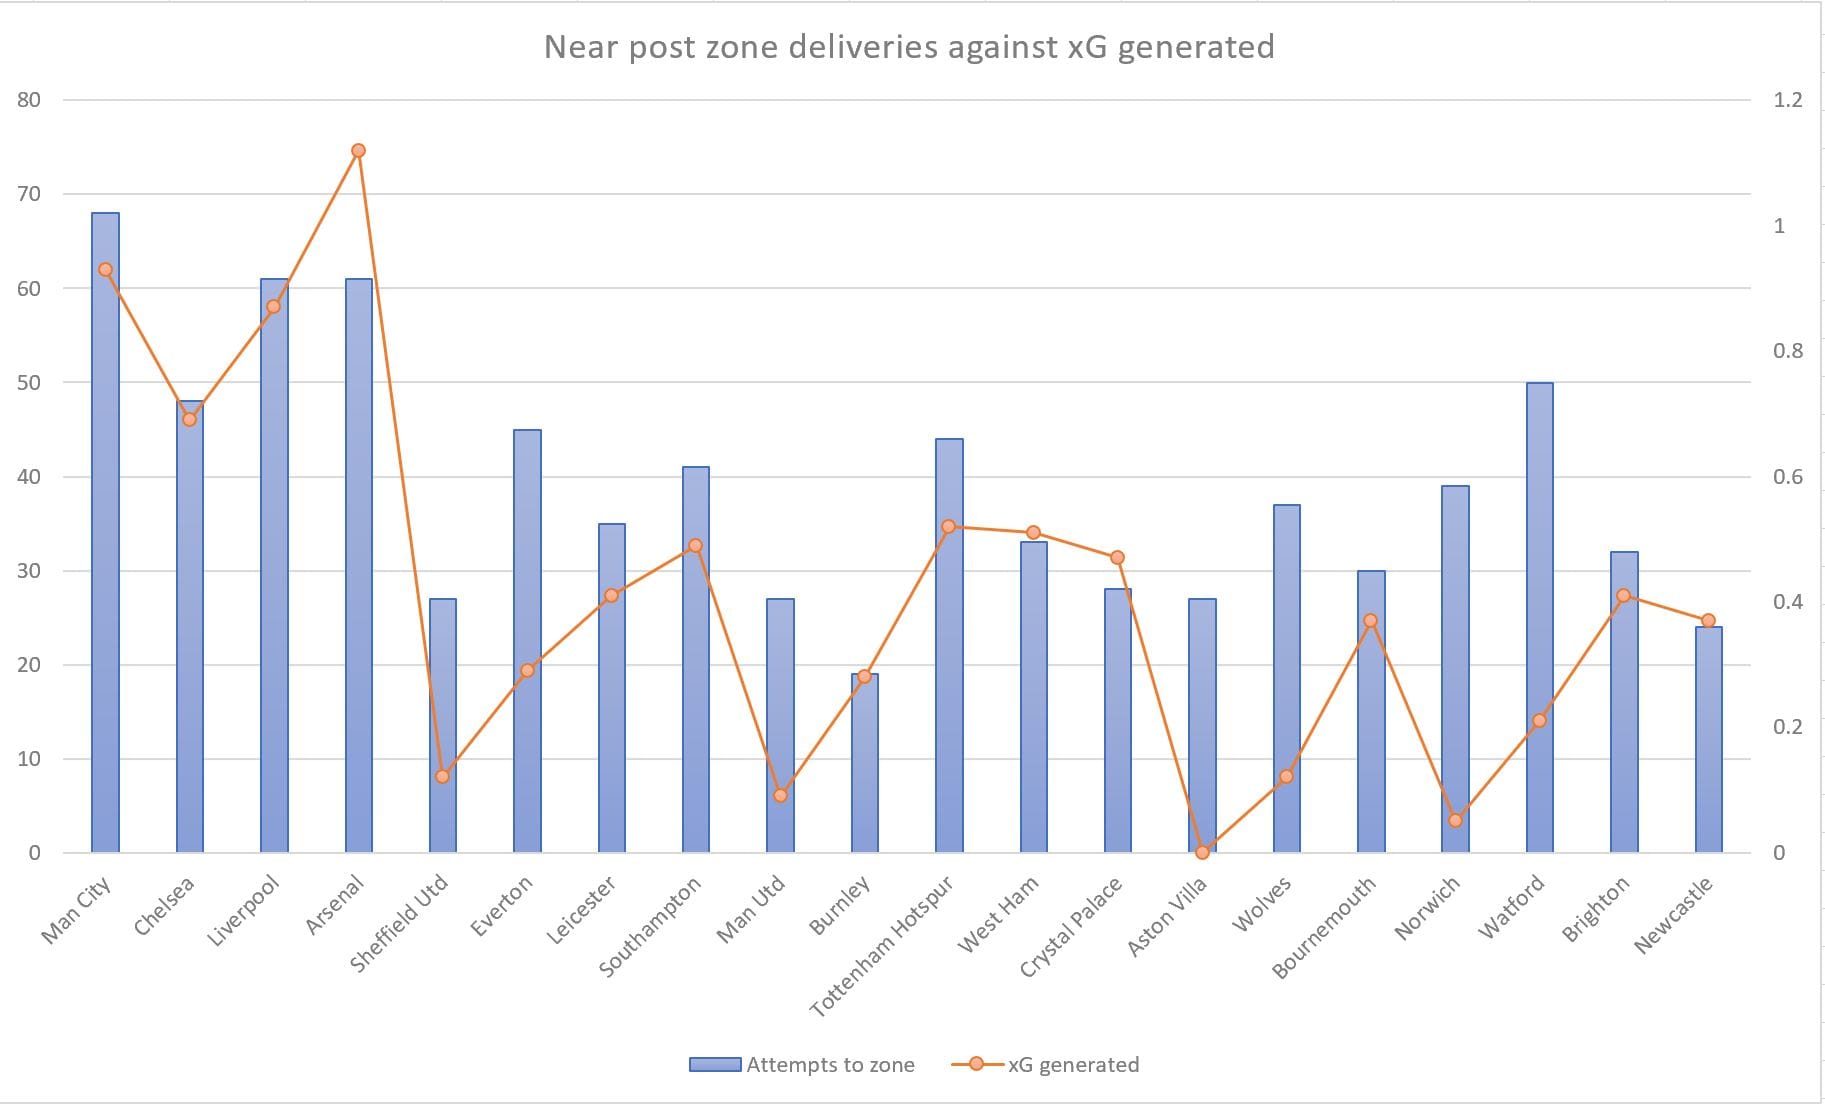
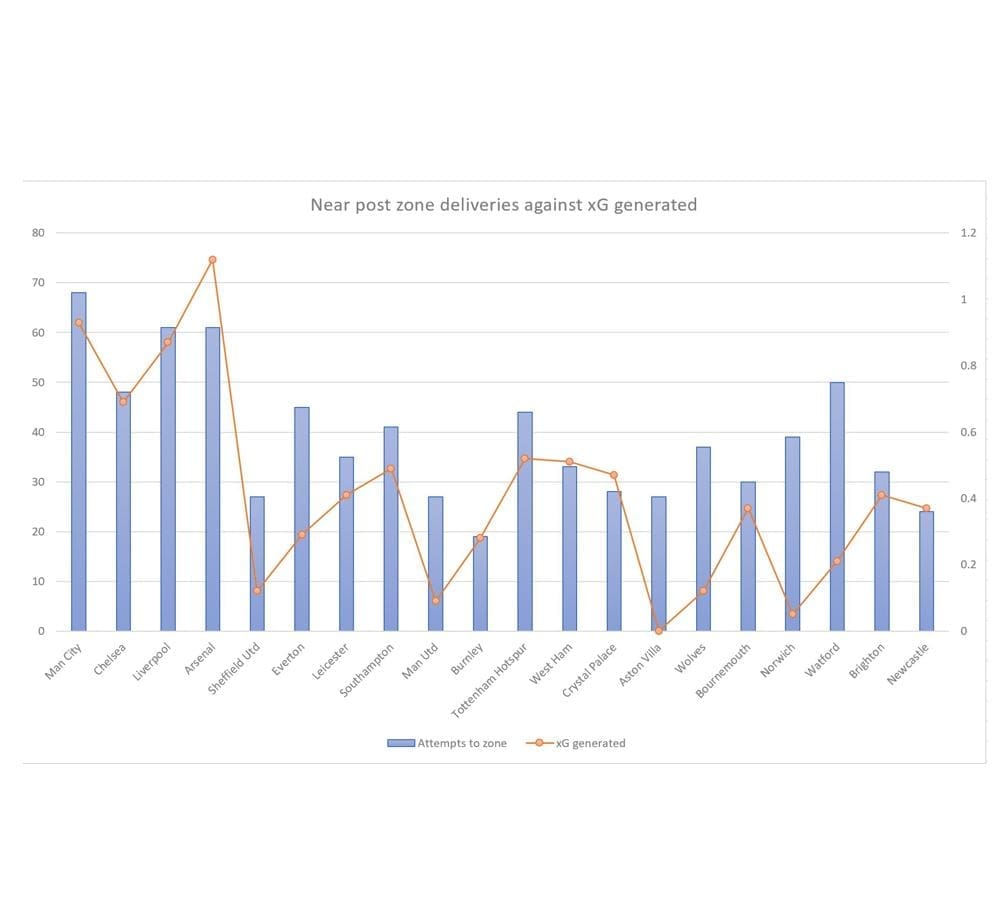
Below we can see a graph I generated showing each teams number of deliveries into a zone (blue), and the number of xG generated (orange), which can help us to identify who has been efficient and who has been wasteful with their deliveries and/or chances. If the point is at the top of the bar, then the team is performing as would be expected compared to its deliveries, and therefore if the point is above the bar they are ‘over-performing’, and if it is below they are underperforming.
We can see that Manchester City and Arsenal lead the way in xG and deliveries attempted, with Arsenal managing a higher xG despite fewer deliveries than Man City. Liverpool also rank highly on xG in relation to their attempts, while Wolves, Norwich and Watford all appear to be underperforming. We’ll now move onto each teams tactics around the near post zone.
Manchester City
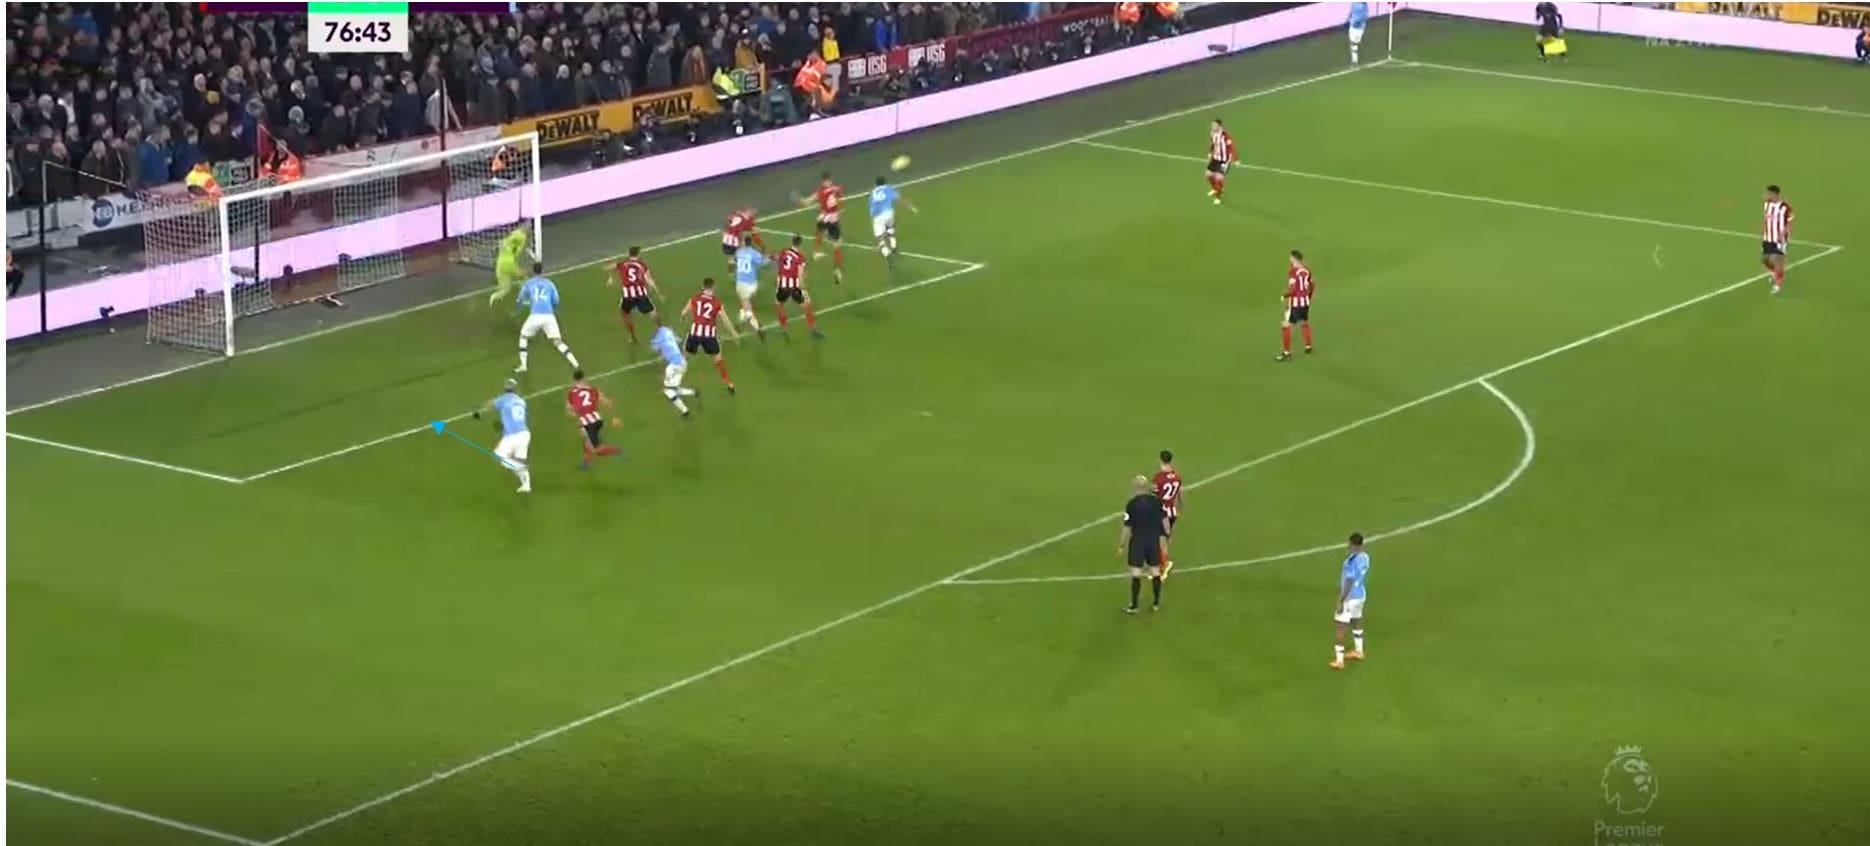
As we can see in the stats above, City use near post routines often, and have decent success from it in terms of xG. This kind of routine or structure seen below is a common method used. City completely vacate the back post region and set runners up from around the penalty spot. One player sometimes occupies the zonal markers of the six-yard box. The target player for this set-piece is always the player who starts on the zonal marker furthest from the ball, as we see Rodri do here. The deepest Man City players (those closest to the back post zone), are usually agile, quick players such as Sergio Agüero here.
Rodri is positioned on the deeper zonal marker, in order to run from the blind side of the near post marker. The central player ideally doesn’t want to follow him or they leave a large space in front of the goalkeeper, and it is difficult for the near post player to react as they can’t see Rodri running from behind. If the central player does follow as they do here, Rodri has the advantage of being ball side as opposed to goal side, and so has a better chance to win the ball. The spacing here is also excellent, with the two runners from deep close to one another not running to occupy the near post area, giving Rodri more space and not crowding the area with opposition players.
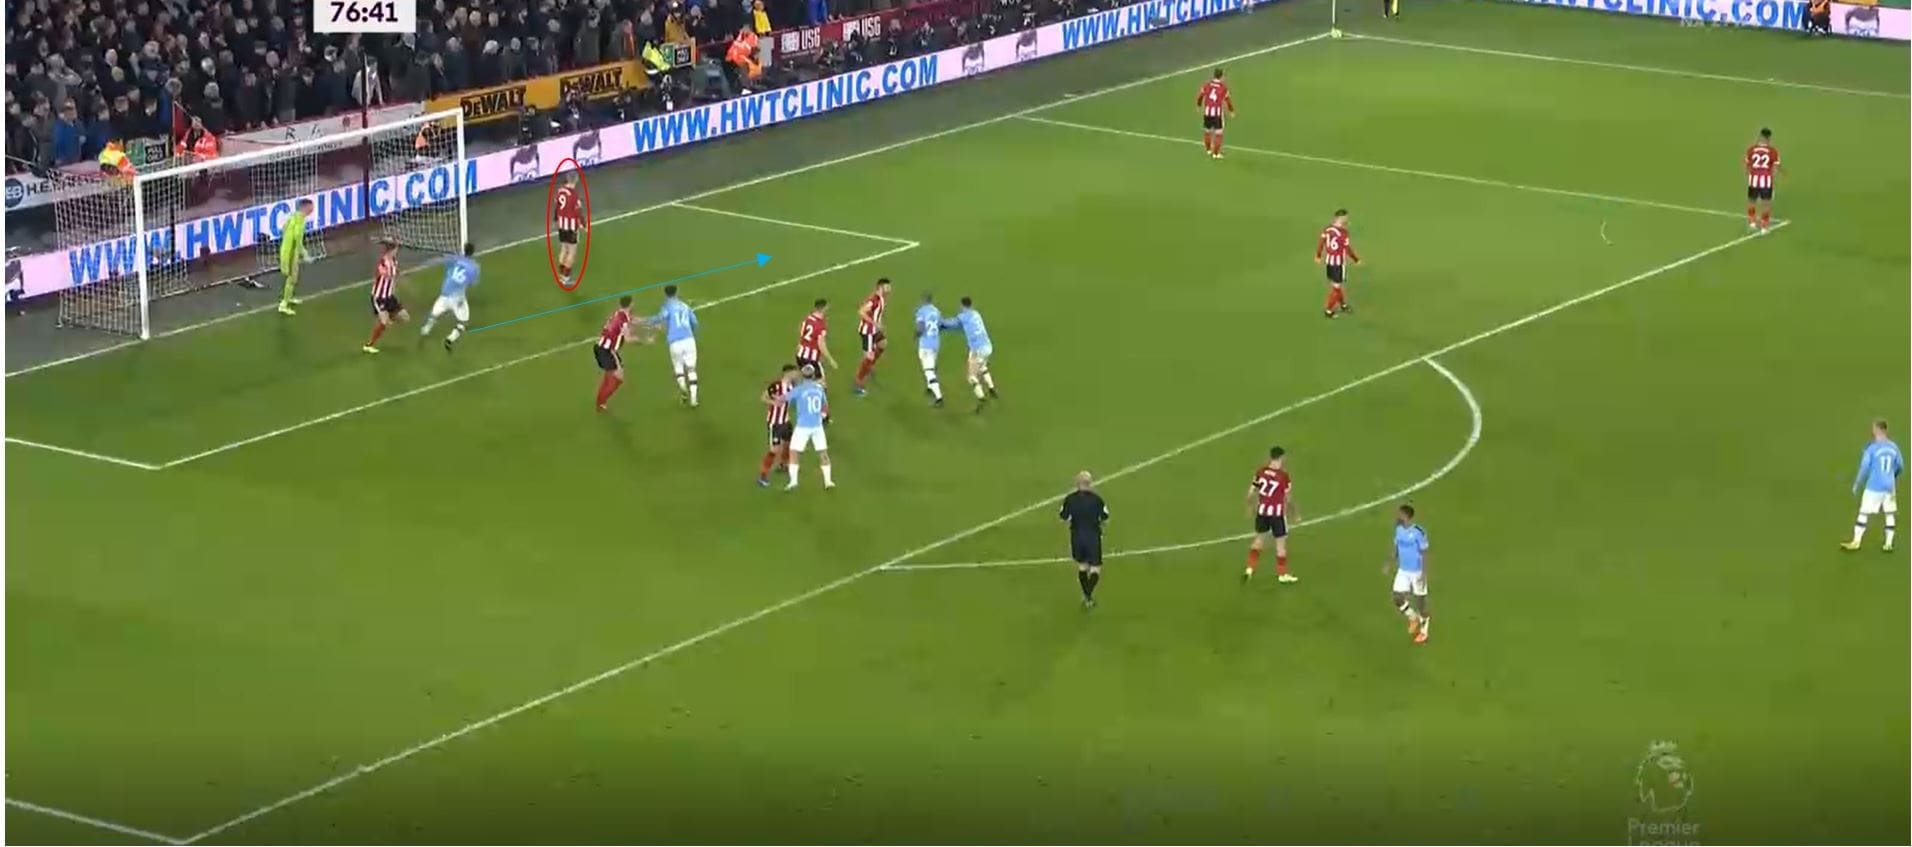
As a result, we see Rodri win the header and flick the ball on. The central player follows him but can’t get close enough to stop the header. Agüero doesn’t require any blockers and simply uses a double movement by feinting to run inside and then changing direction, which due to his low centre of gravity allows him to get around his marker. Rodri’s header is slightly too high however which prevents a goalscoring opportunity at the back post.
In a separate example from the same game, we see the same principles here. Rodri again stays on the ball side of his zonal orientated marker, but on the blindside of the near post player. The player closest to the back post zone is this time Raheem Sterling, again an agile, quick player capable of accelerating past his marker quickly.

We can see another example of this below, with now two players in the six-yard box but again Rodri making a movement from deep on the blindside of the near post player.

The delivery is flatter in this example leading to the ball arriving at Rodri’s feet, meaning he can do very little with the ball. However again, Rodri’s movement allows him to receive the ball.

We can see here with the same movement again Rodri gets into the near post zone, where he is able to score from a 0.10 xG chance, which highlights the low xG values associated with set-piece goals.
City can also occasionally place two players within the six-yard box and rotate positions several times, with one occupying the furthest player and then moving onto the near post player, while the other player does the opposite. This upsets the timing and decision making of the near post player, as they are constantly anticipating a player running ahead of them and winning the header, and so decoys upset this anticipation.
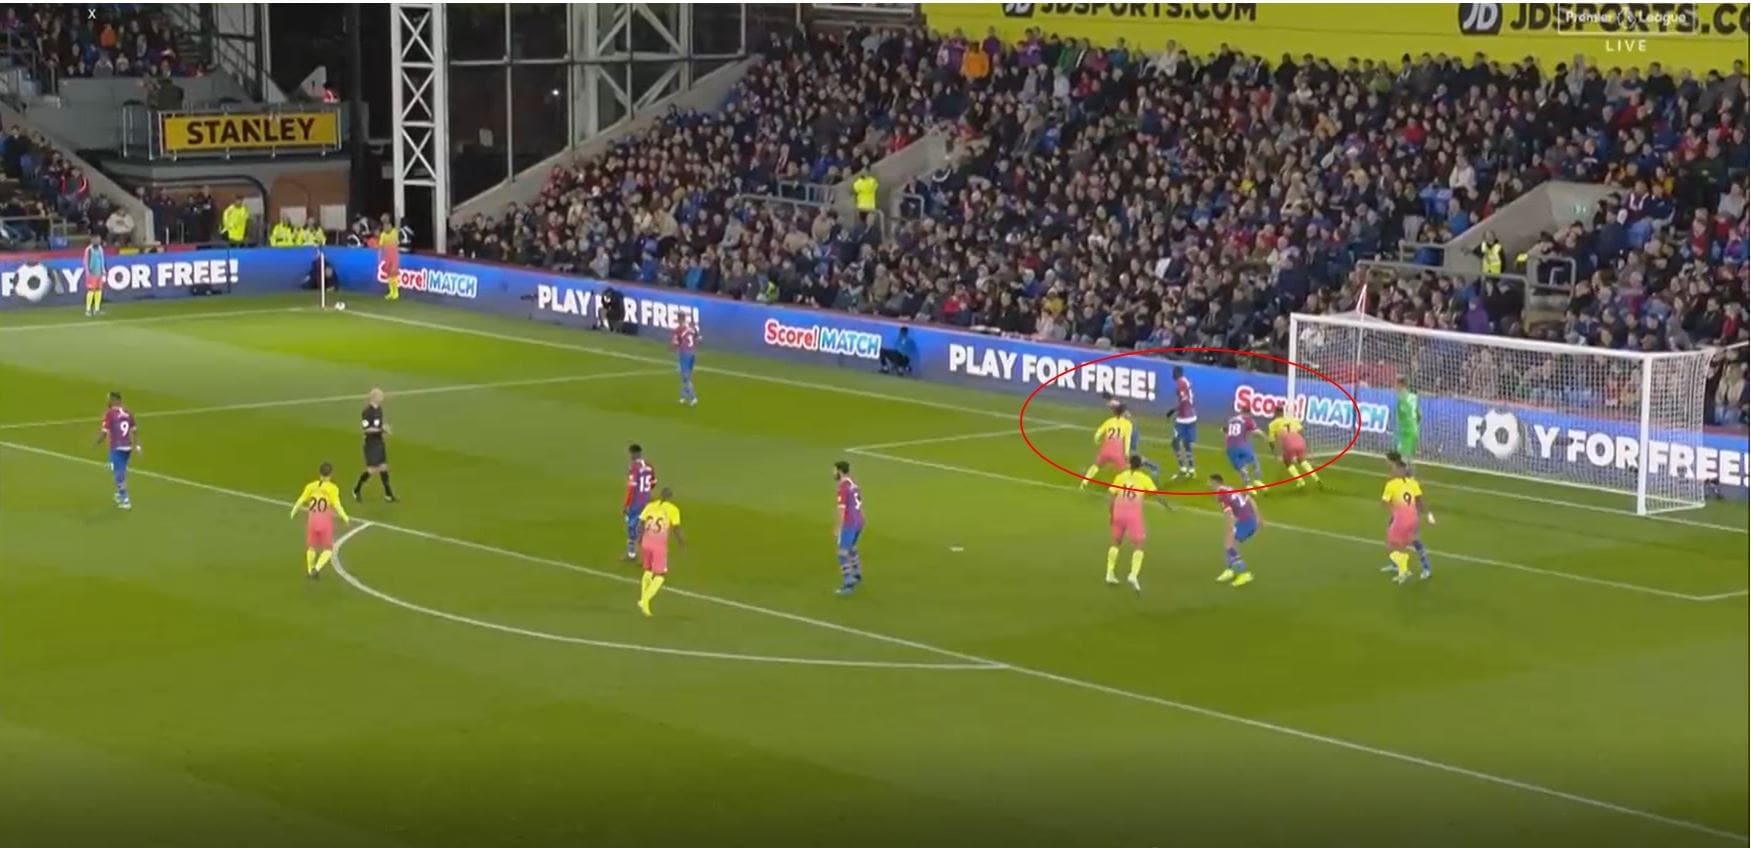
City have also used a more basic near post routine, with the same idea behind it but a different structure. Here the player closest to the near post zone makes a quick run into the near post zone, while again two agile players at the back post prepare to receive a flick-on. This kind of routine allows for the initial near-post header to be at a better angle and therefore easier to direct to the back post, however, with no blindside run, it is also easier to defend for the opposition who can see and track movements much more easily.

Rodri marginally gets to the ball ahead of his marker, and again Sterling and Agüero evade their markers and get free in the back post zone. But again the header is unable to be directed towards the zone, partially due to the coverage from Spurs’ marking.

As mentioned previously, City have been particularly poor in terms of goalscoring output this season from set-pieces, despite the analysis shown above. Although the set-piece routine mentioned above generates the opportunity for free players at the back post, its execution is difficult. The header when running from the near post player’s blindside is a difficult header to execute and direct when facing the opposite direction to where you want the ball to go, while the header explained above is easier to execute but easier for the opposition to manage. As a result, City have struggled to generate many meaningful chances from this area, like many teams. It is worth noting also that if a flick on does occur, and the goal is scored, it would register as a goal in another zone, but from this near post zone City have struggled to generate chances in this way, with remaining xG chances in this zone made up of poor quality chances and some dubiously rated xG values.
Arsenal
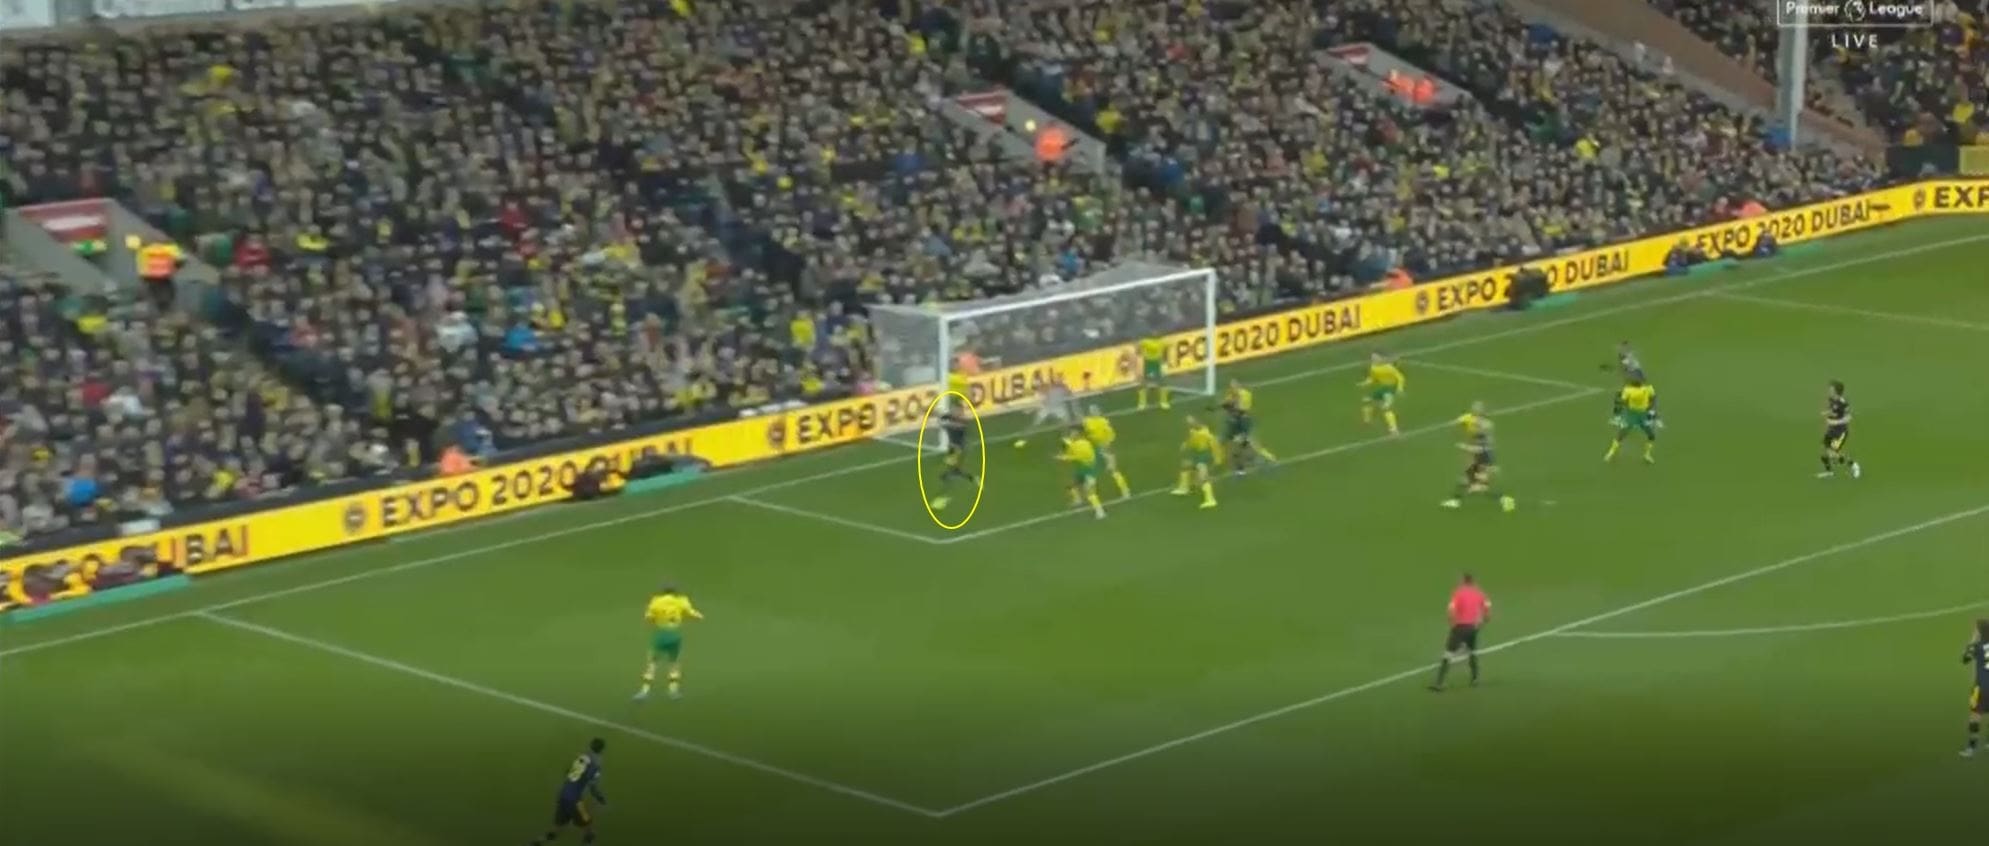
Although Arsenal’s new manager Mikel Arteta has brought this set-piece routine with him to Arsenal, Arsenal had already been using it regularly throughout the season, resulting in a high xG. We can see an example of the near post being exploited here, with Callum Chambers making a very simple near-post run, and Norwich’s terrible coverage failing to pick him up. The run requires no blocking or disguise but the delivery is into the exact zone Wyscout classes as the near post, and the header is cleared off the line at the far post.
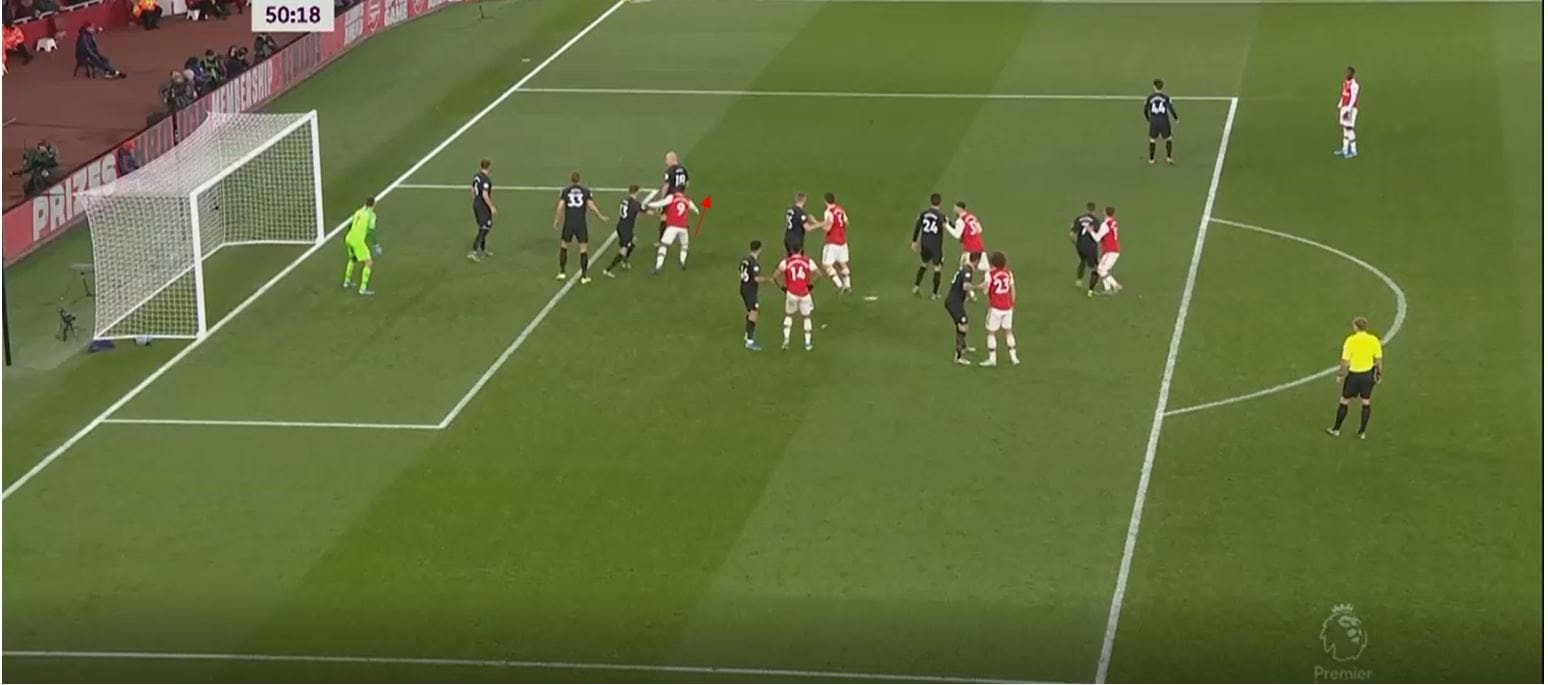
We can see here in a game with Freddie Ljungberg in charge, Arsenal use a very similar routine to Man City. Lacazette starts on the furthest zonal player and makes a blindside run towards the near post, while others make a run towards the far post.
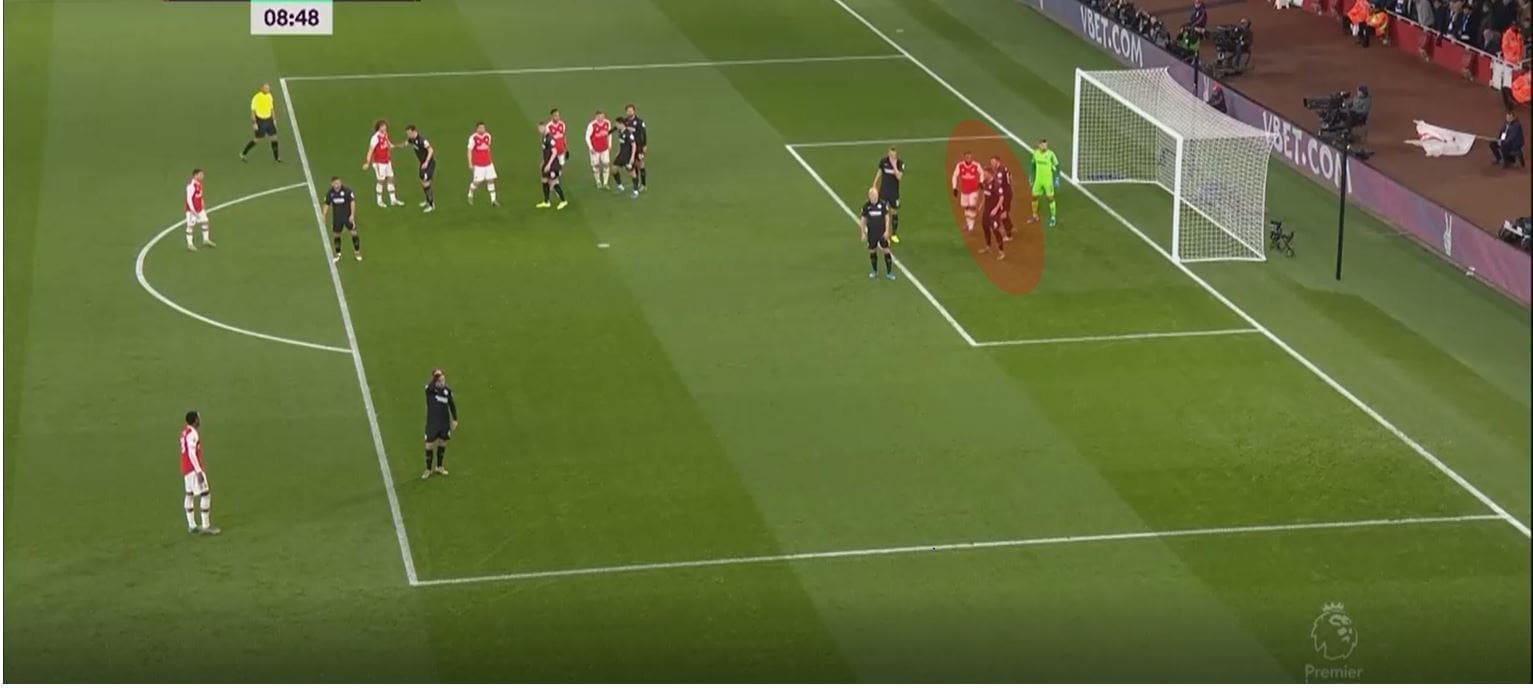
The blind side run again means Lacazette is able to beat the opposition player to the ball, resulting in a low xG chance which Arsenal nearly score from at the back post. The initial header from Lacazette was rated as 0.06 xG
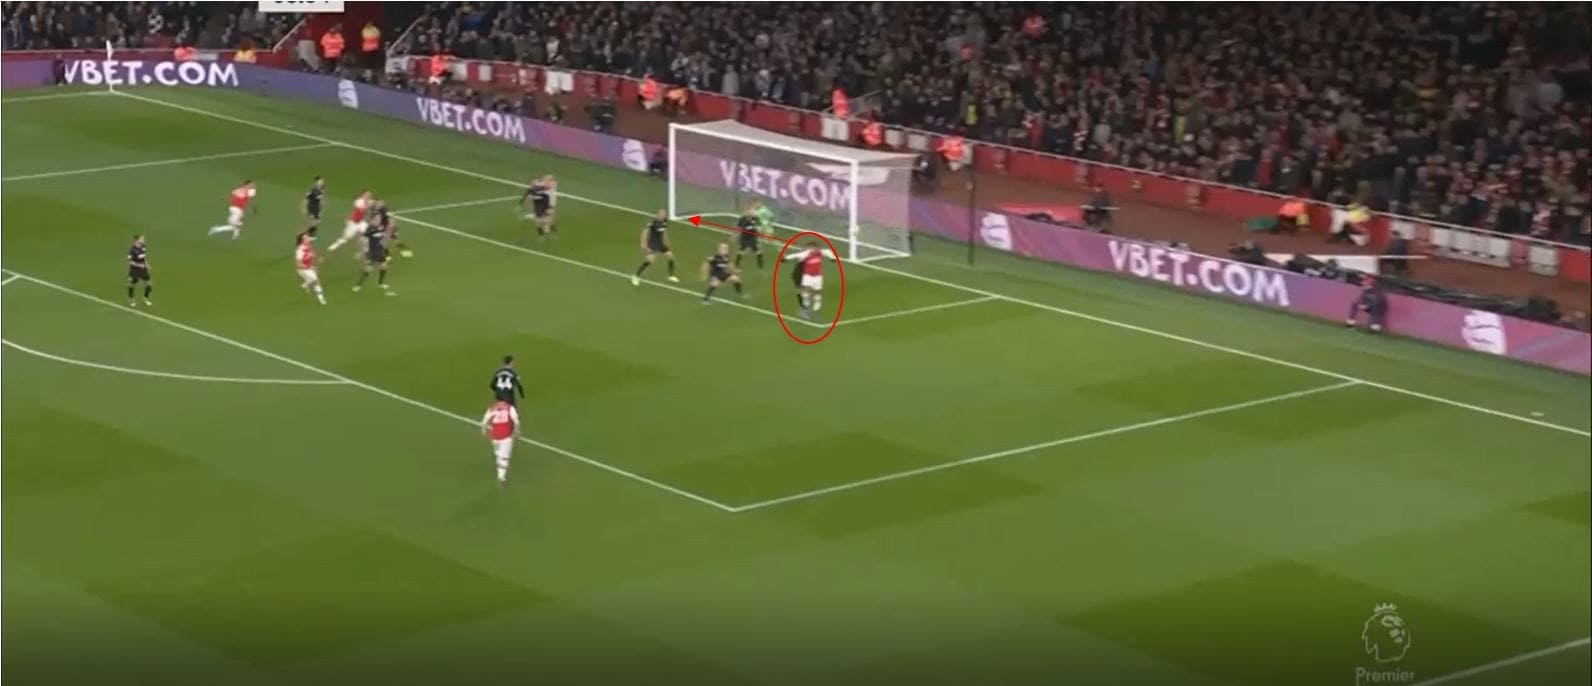
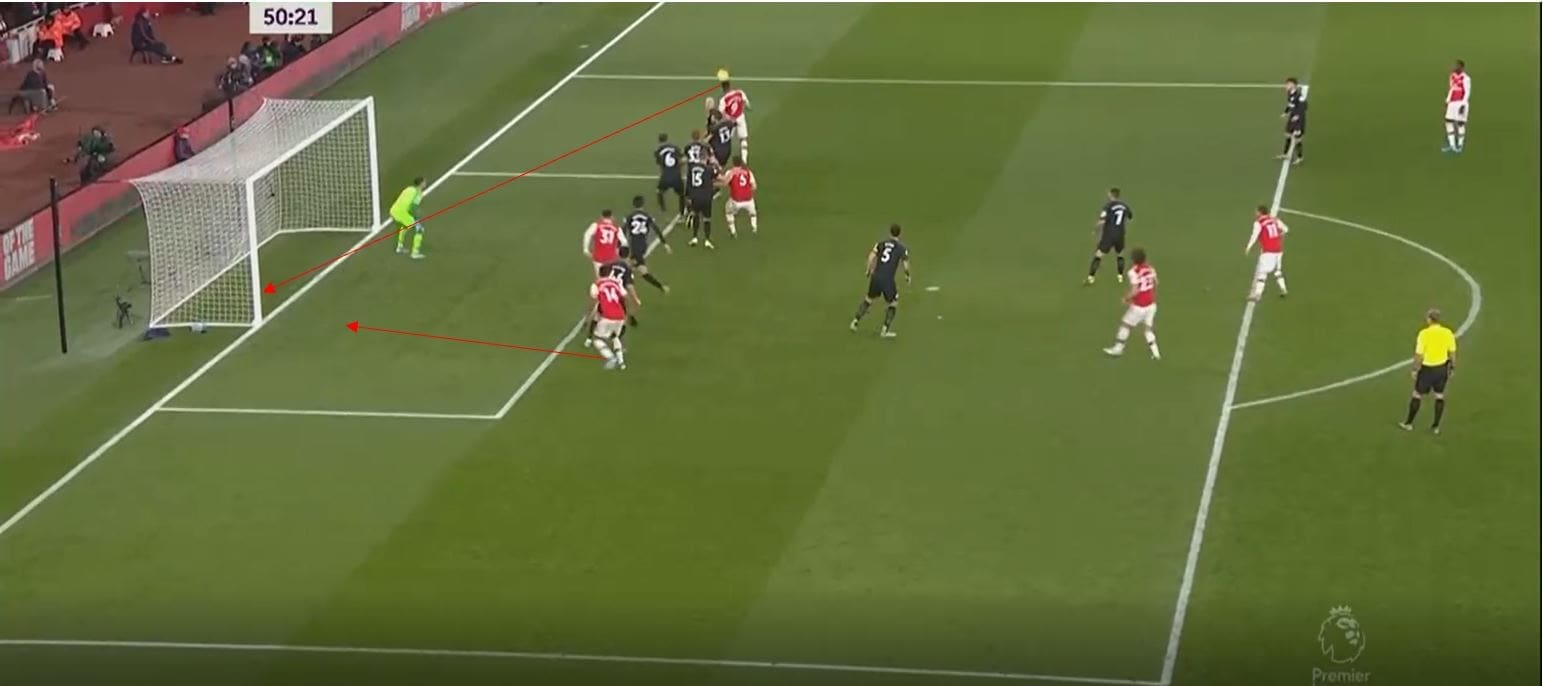
In the same game Arsenal were able to score from a very similar situation. Again you guessed it, a blind side run from Lacazette into the near post zone allows him to win the initial header, which has an xG value of 0.07.
Arsenal may well be generating more xG in this area, but they are also far more clinical in these kinds of areas, and perhaps generate more xG due to their greater aerial ability compared to City, as well as their improved delivery at times. As a result, Arsenal have managed five more goals from set-pieces than City this season, and generated more goals and xG despite using fewer attempts in this zone.
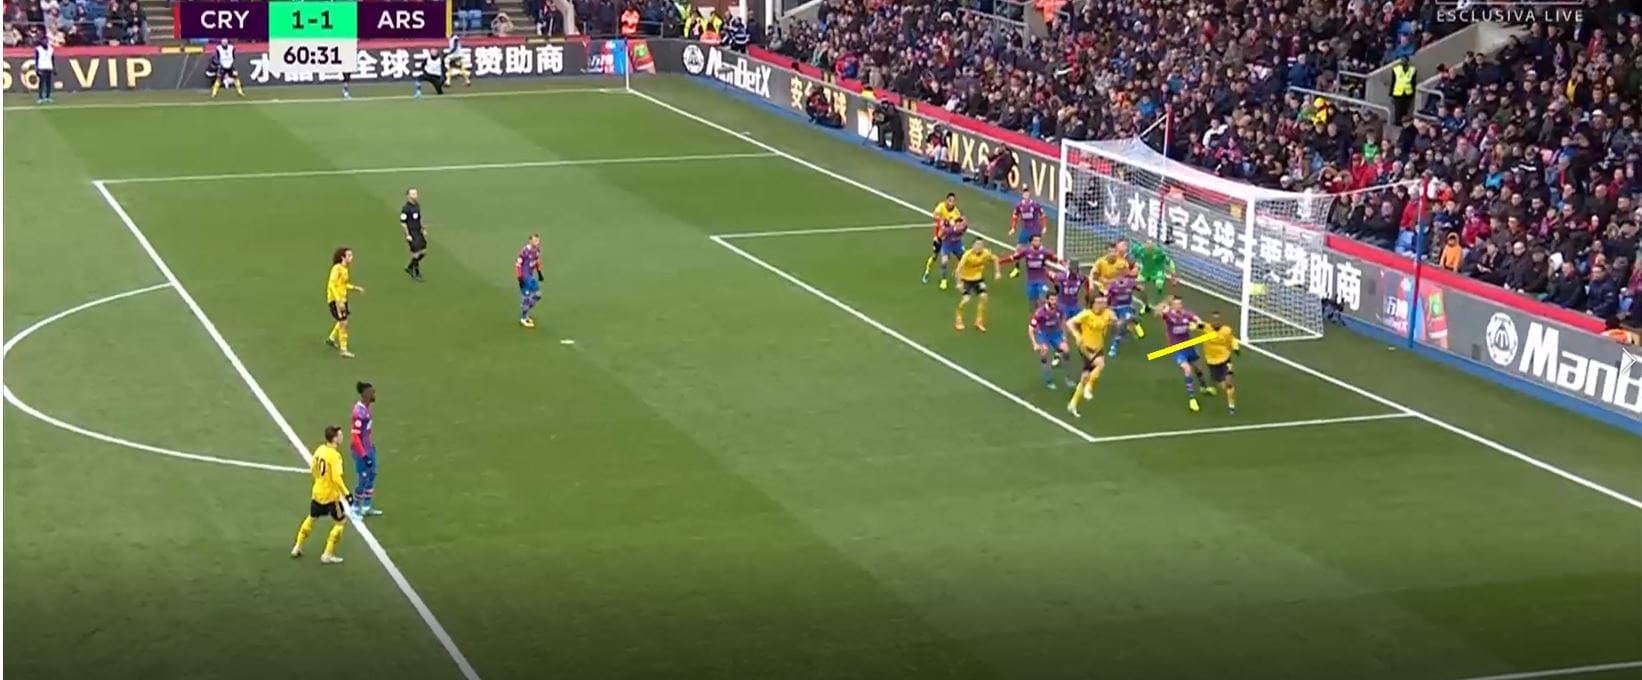
In one final example here, we can see a slight adaptation in which Lacazette makes his usual movement in order to block the near post marker, setting up David Luiz for a 0.20 xG chance which goes over the bar. There are other examples of these movements and goals from Arsenal, but some come at the near post within the six-yard box, such as their goal against Man United. As a result, I haven’t included them in this analysis.
Liverpool
Liverpool are also a side who use the near post frequently and have generated a decent xG from this. Here are a few interesting routines from them exploiting the near post area. Here is Liverpool’s initial structure, and Henderson and Mané clearly communicate to each other regarding the routine, with Henderson gesturing for Mané towards the six-yard box and to the right.
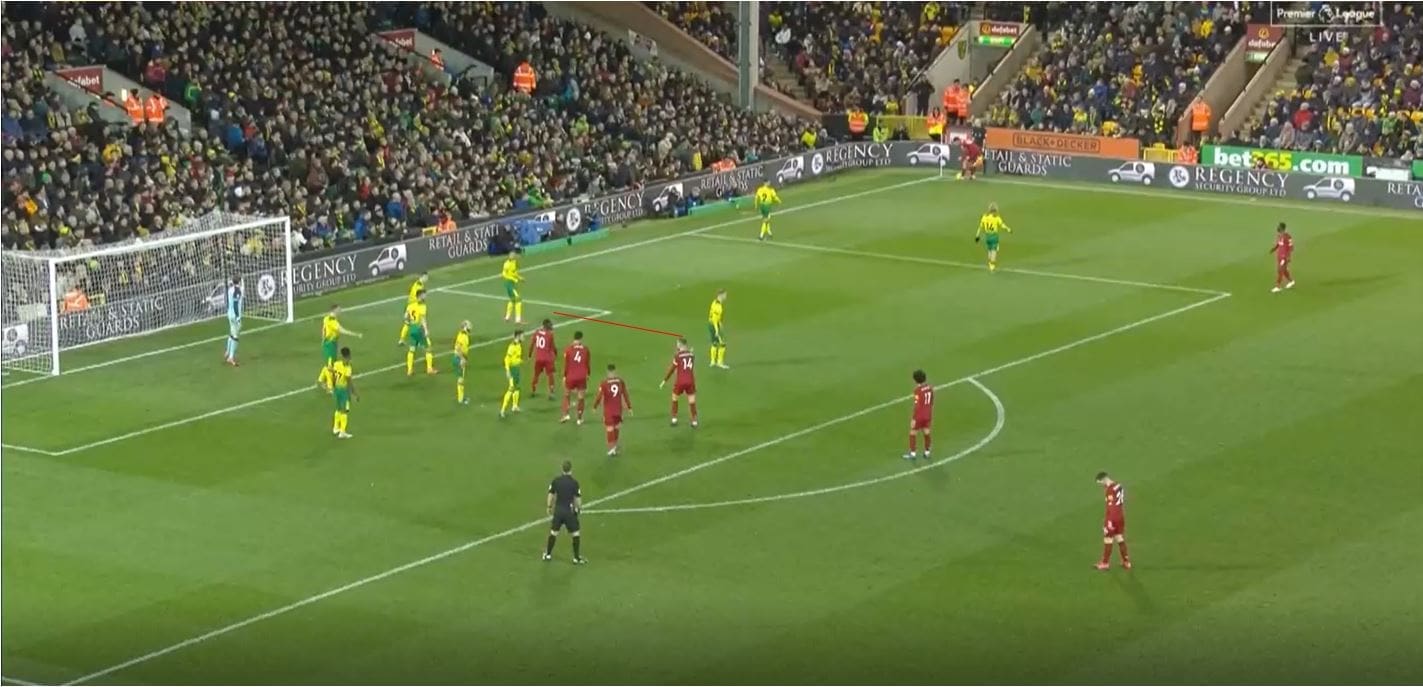
The result is this routine, where Mané moves to occupy the near post zone player at an angle which forces the player to move slightly towards him. This opens up the inside angle for Henderson to run into and receive the ball, where he mistimes his kick. Nevertheless, it is a clever routine to create a small amount of space.
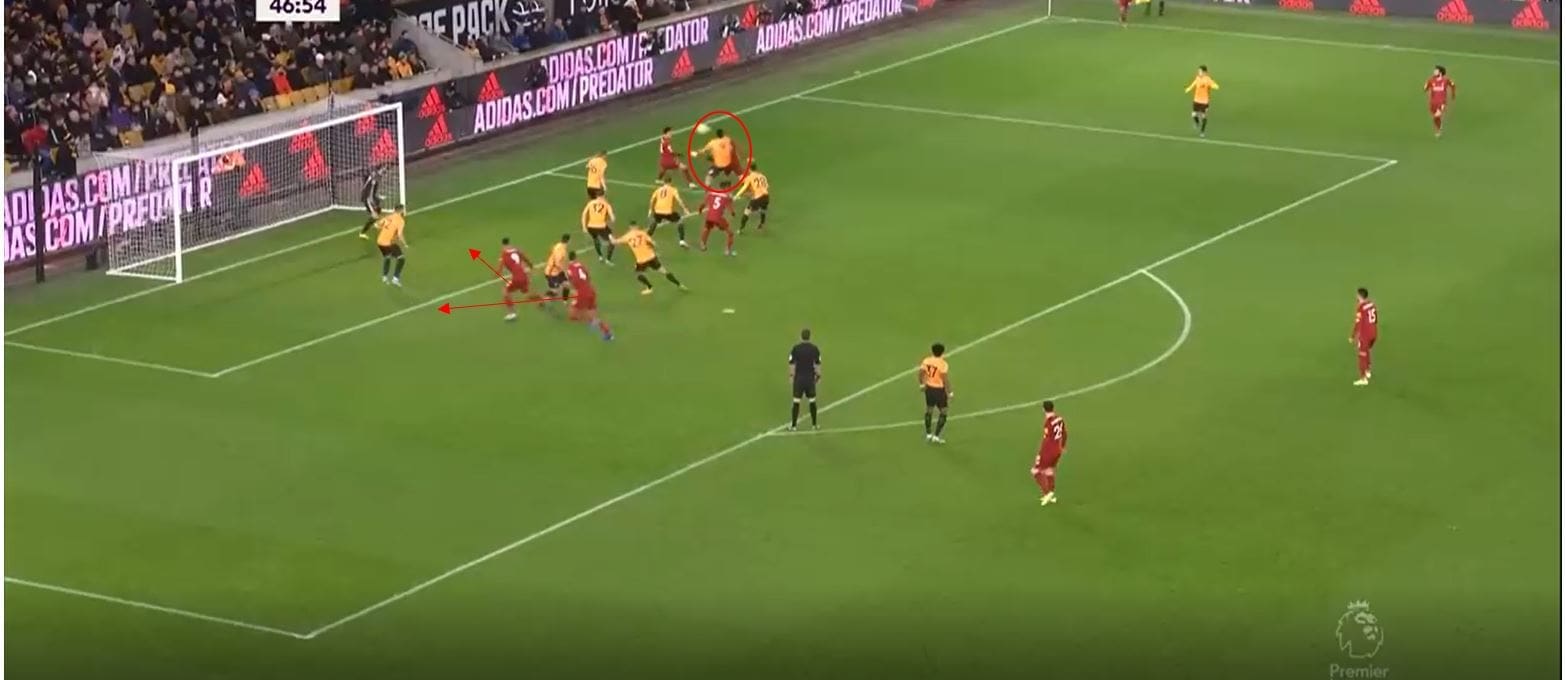
We can see another routine here which is based on the movement of players. Here, Liverpool form a cluster of players to set up potential blocks, and Henderson remains on the outside of the block. This allows for him to be unable to mark initially due to the cluster in front, and also allows for his run towards the near post to be harder to see and track, as this block in front allows for him to arc his run while protected by players ahead.
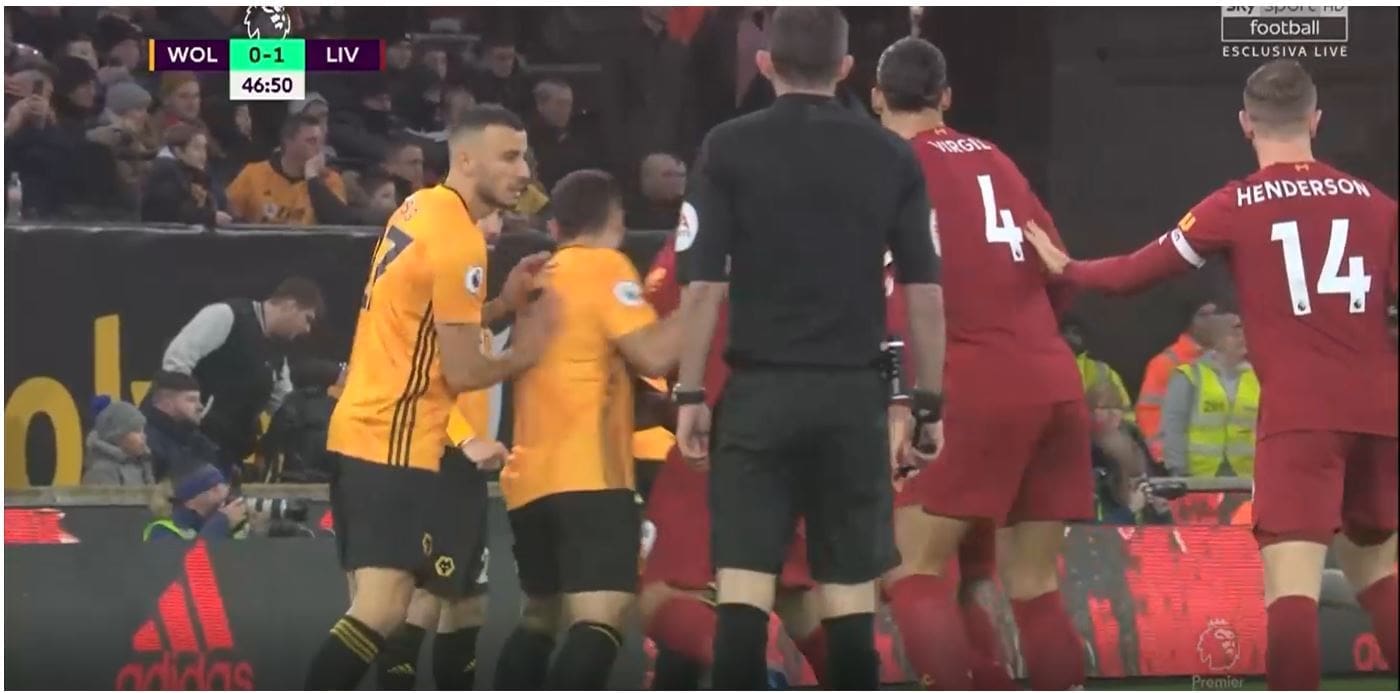
Therefore, Wolves cannot track Henderson’s run and he arrives onto the ball and flicks it on, where one player at the back post stops a certain goal for Roberto Firmino.
Watford
Okay, so I’ve covered the teams who have generated the most xG in this zone, so what about the worst teams in this area. If we refer back to the graph, we see Watford are probably the worst performers in this area, with 50 attempts generating 0.21 xG.
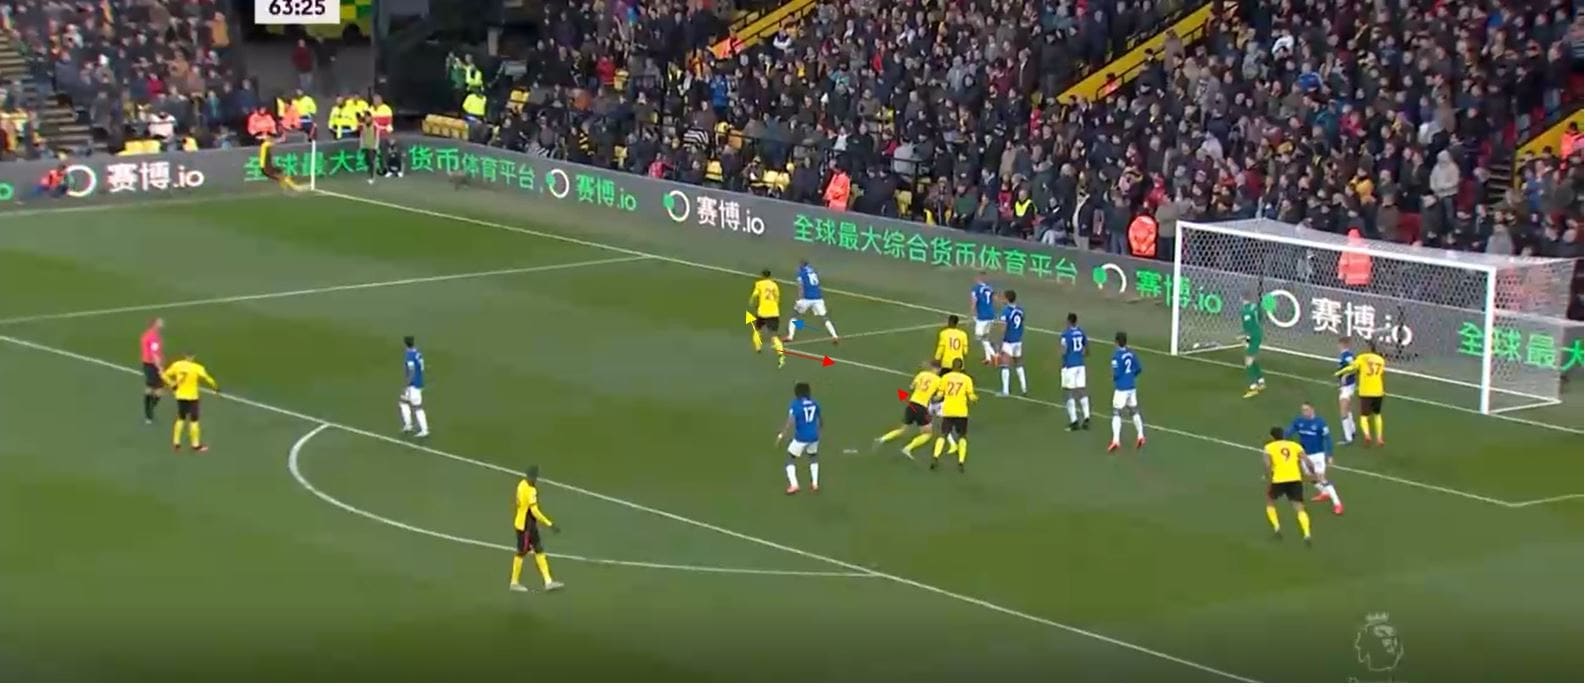
For Watford, a combination of poor movement, execution and delivery play a role in a dismal return which Wyscout claims has resulted in one shot in 50 attempts. Watford have a habit of when picking out this zone, relying on pure aerial ability and duel winning rather than intelligent movement. We can see in this first example here, Djibril Sidibé moves to match the Watford player’s run, opening a space behind him which Everton don’t adjust to. Luckily, Watford don’t adjust either and there is no intelligent run or change of direction, from either the other runners or the near post player. All players instead just run straight or don’t move at all, with Danny Welbeck who is closest to this space not making any movement at all. T o top it off also, the delivery is poor and Everton can clear.
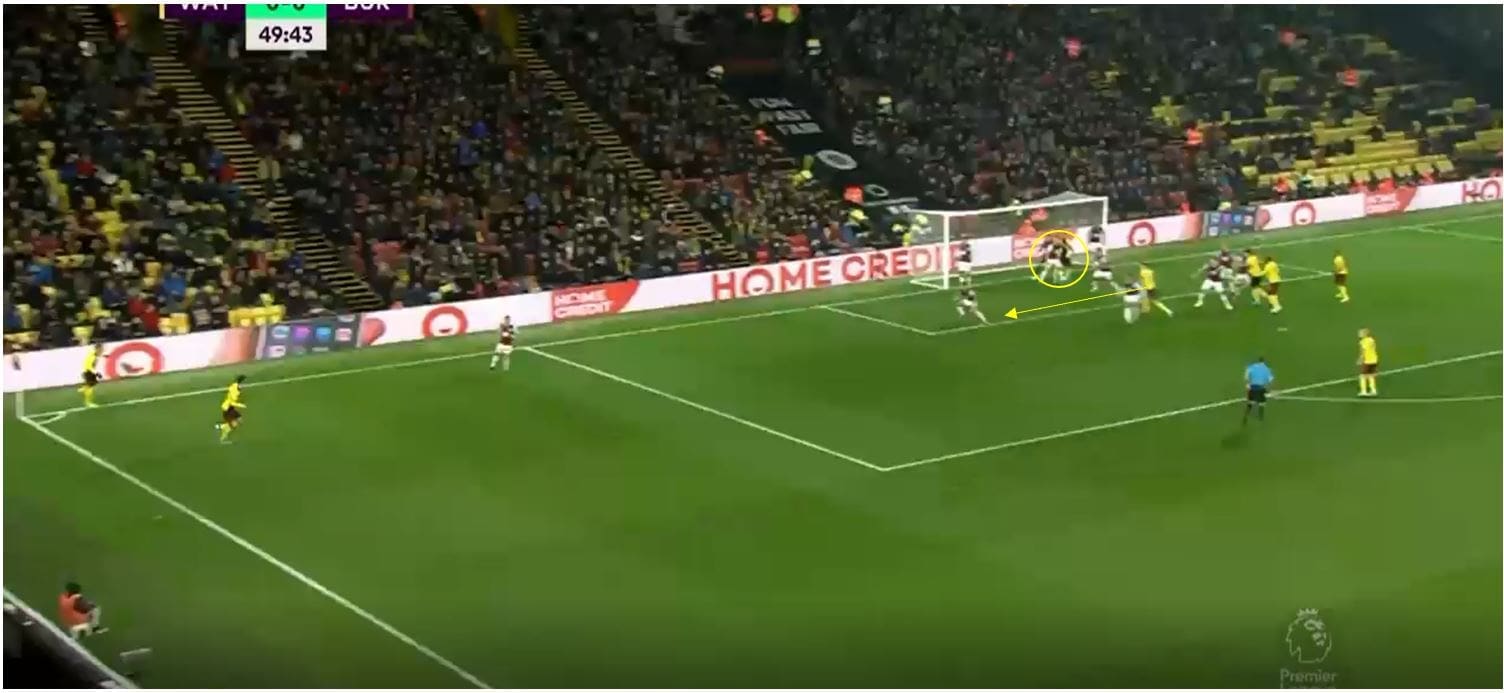
In this example here, Watford do well initially to dismark their opponents, but the target player runs into the near post space which is occupied by a player already and no attempt has been made to even manipulate this player’s positioning. Furthermore, if they do win a flick on, the positioning of a player virtually on the goal line commits Burnley players further back and gives them a greater chance of dealing with the second ball.
Conclusion
The aim of this piece was to give an initial insight into some of the trends in the Premier League regarding set-pieces, with this piece mainly focusing on the routines used by the sides who most use the near post zone. The near-post zone is an area which gives relatively low xG but can generate chances from second balls, which can (within Wyscout’s definition) hinder its xG metric within this context. As a result, actual footage allows us to spot trends within routines and analyse what is or isn’t successful, and hopefully, this piece has done that. This will be the first of hopefully a long-running series, with the next piece focusing on short corners and their use, followed then by the far post and goalkeeper zone.



Comments