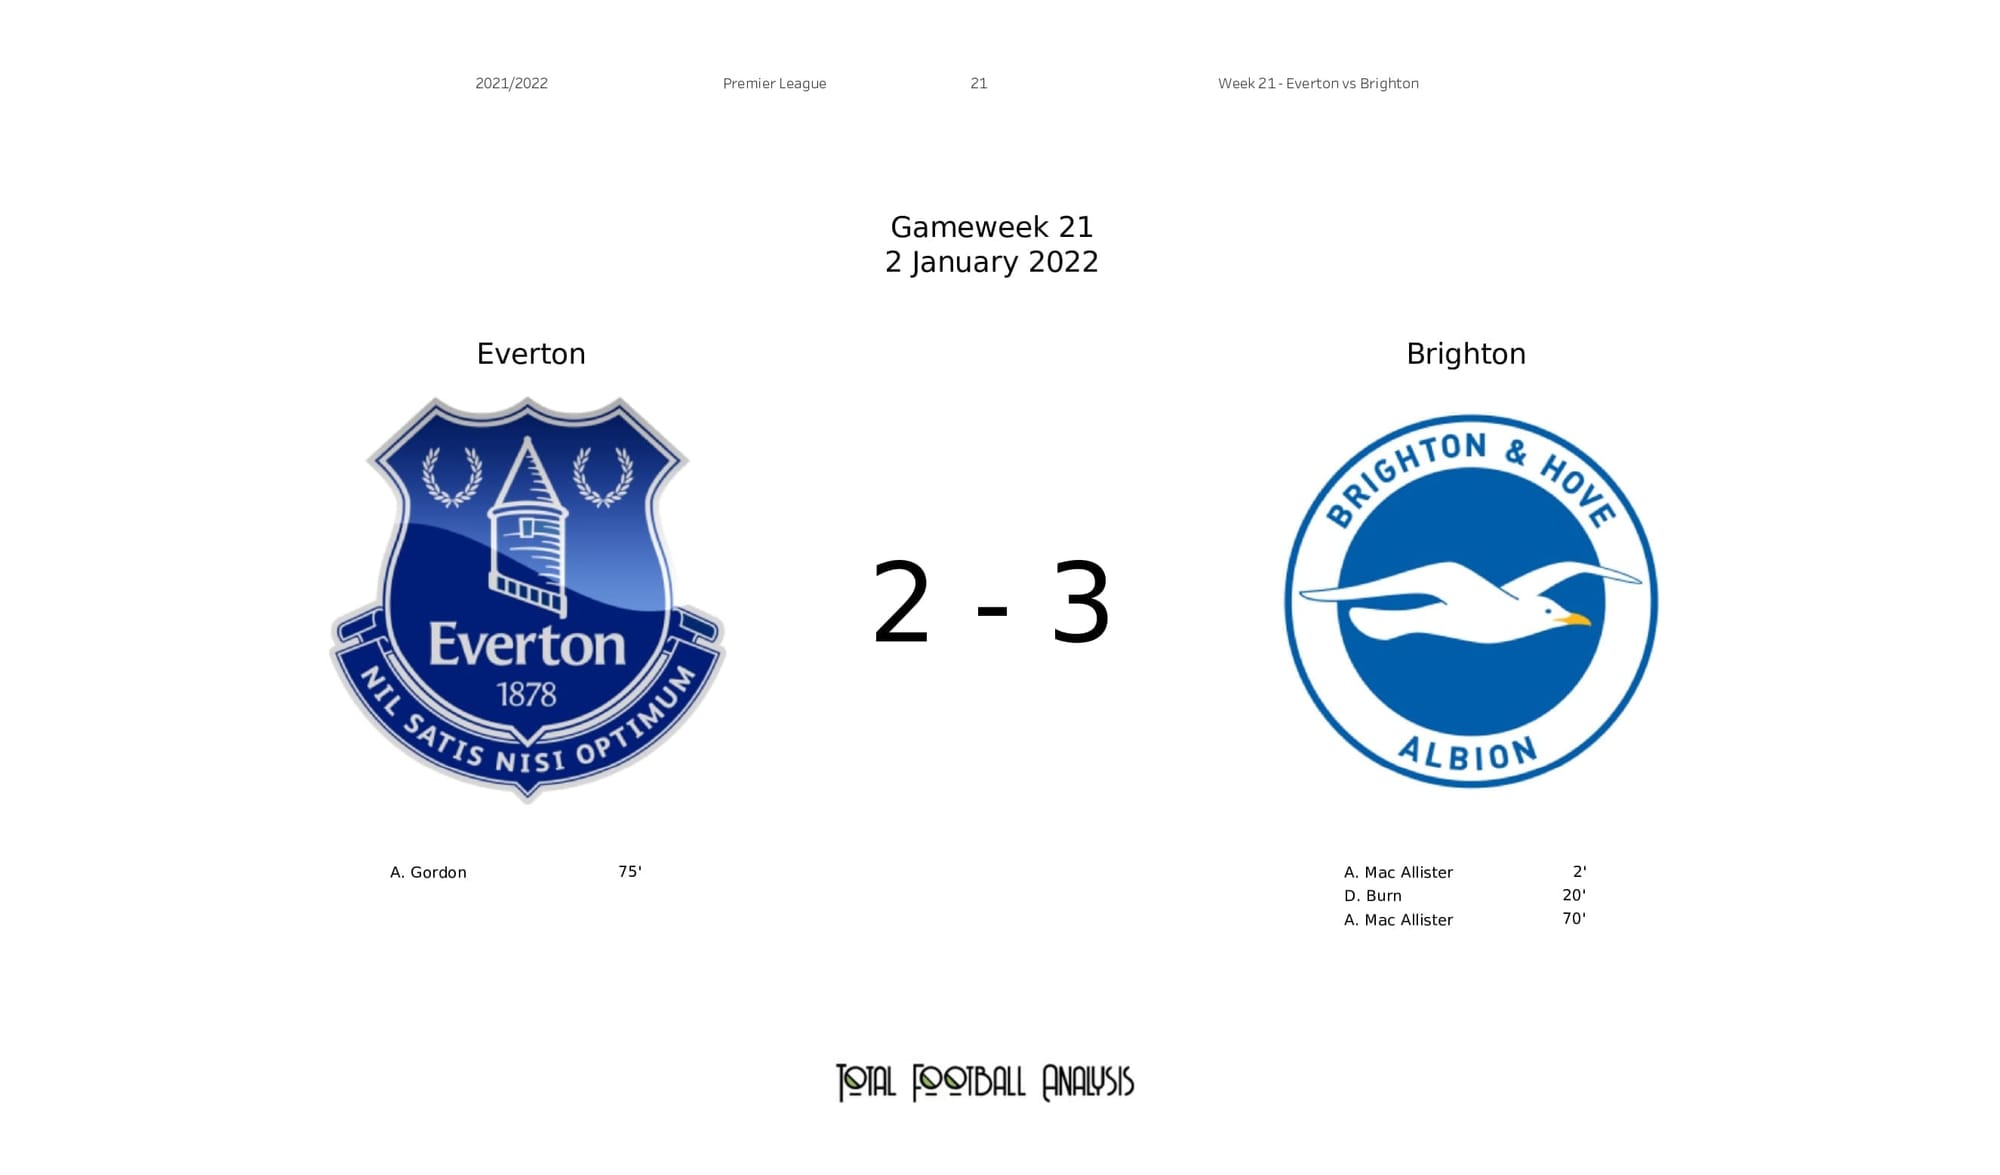
Sunday afternoon saw things get worse for Rafa Benitez and Everton, losing 3-2 to Brighton in the Premier League.
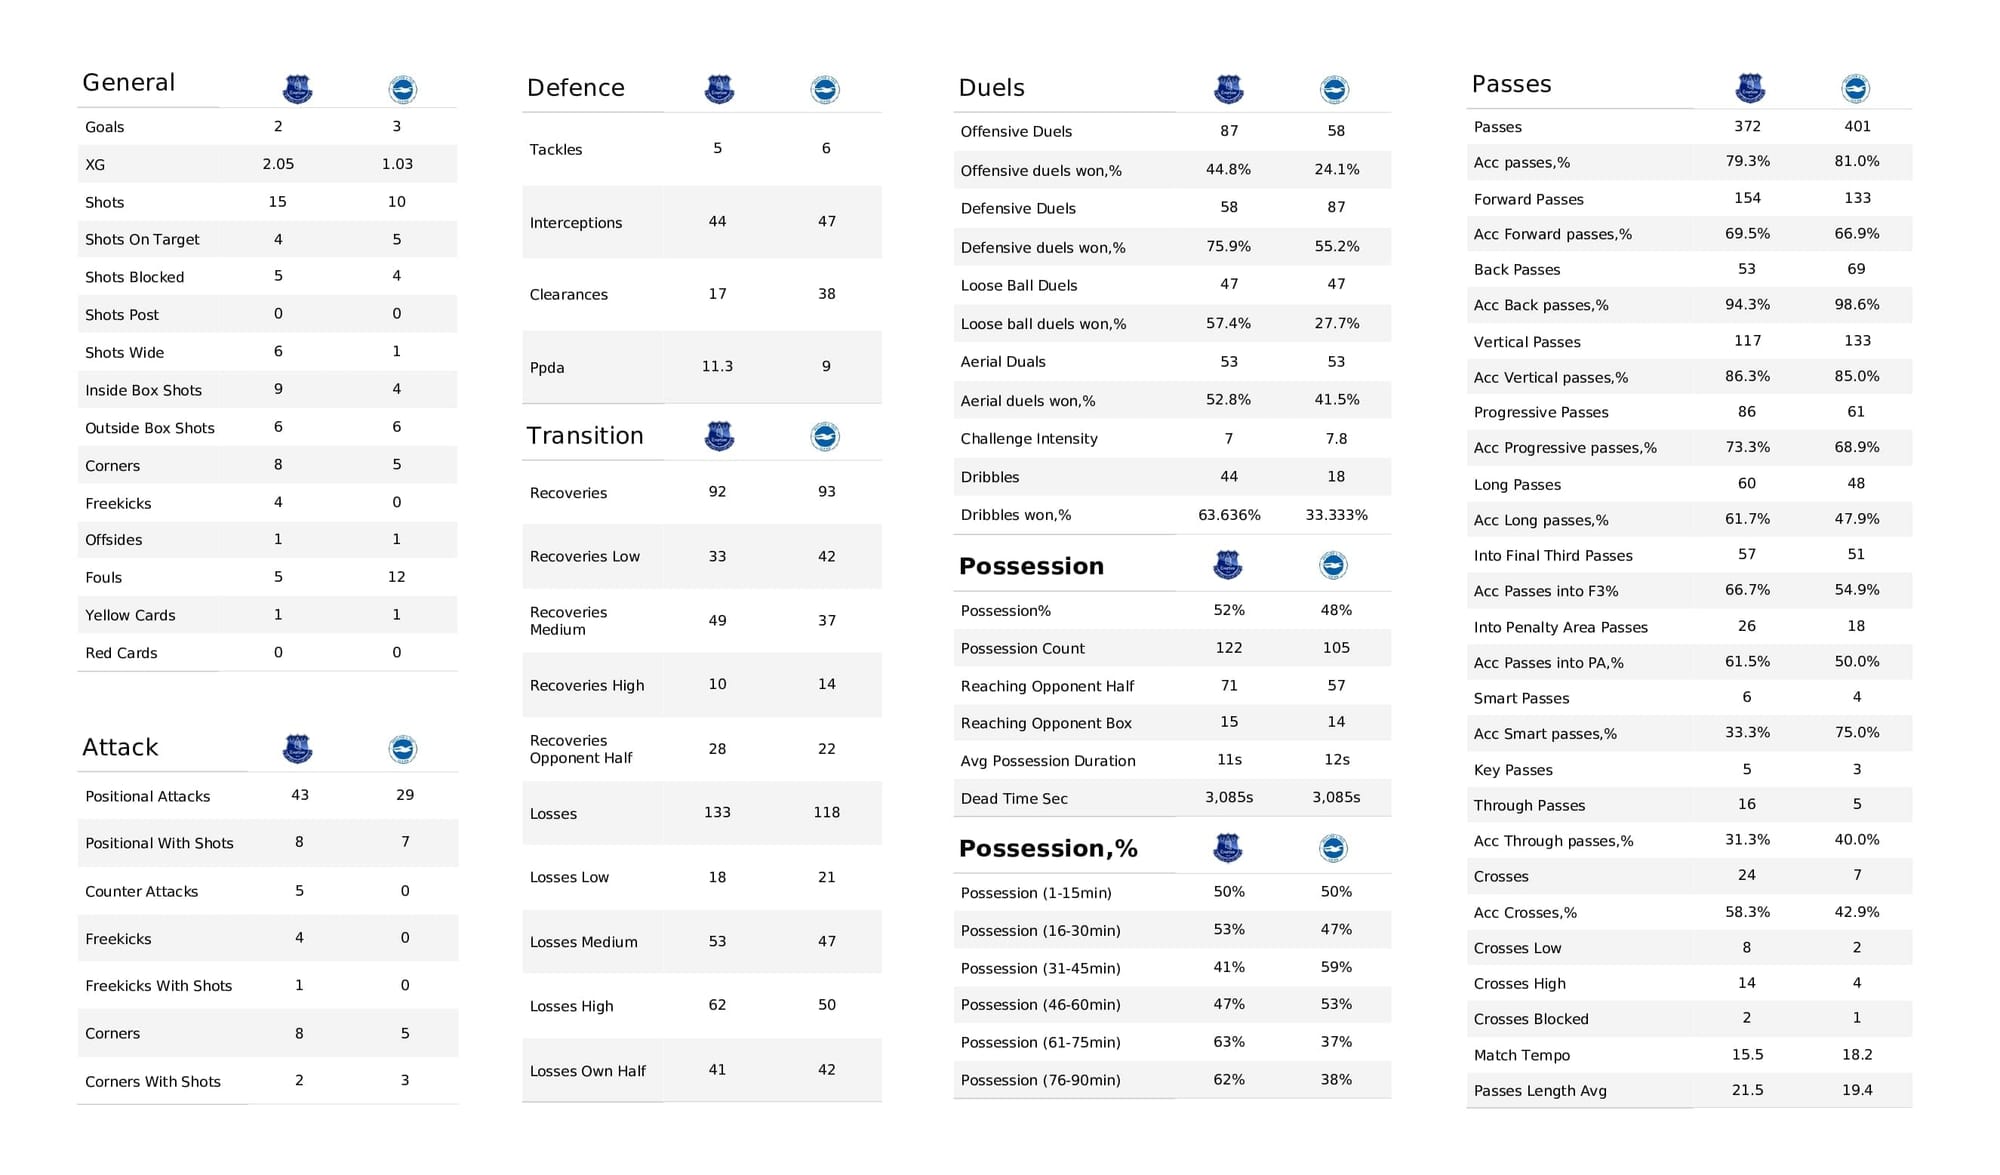
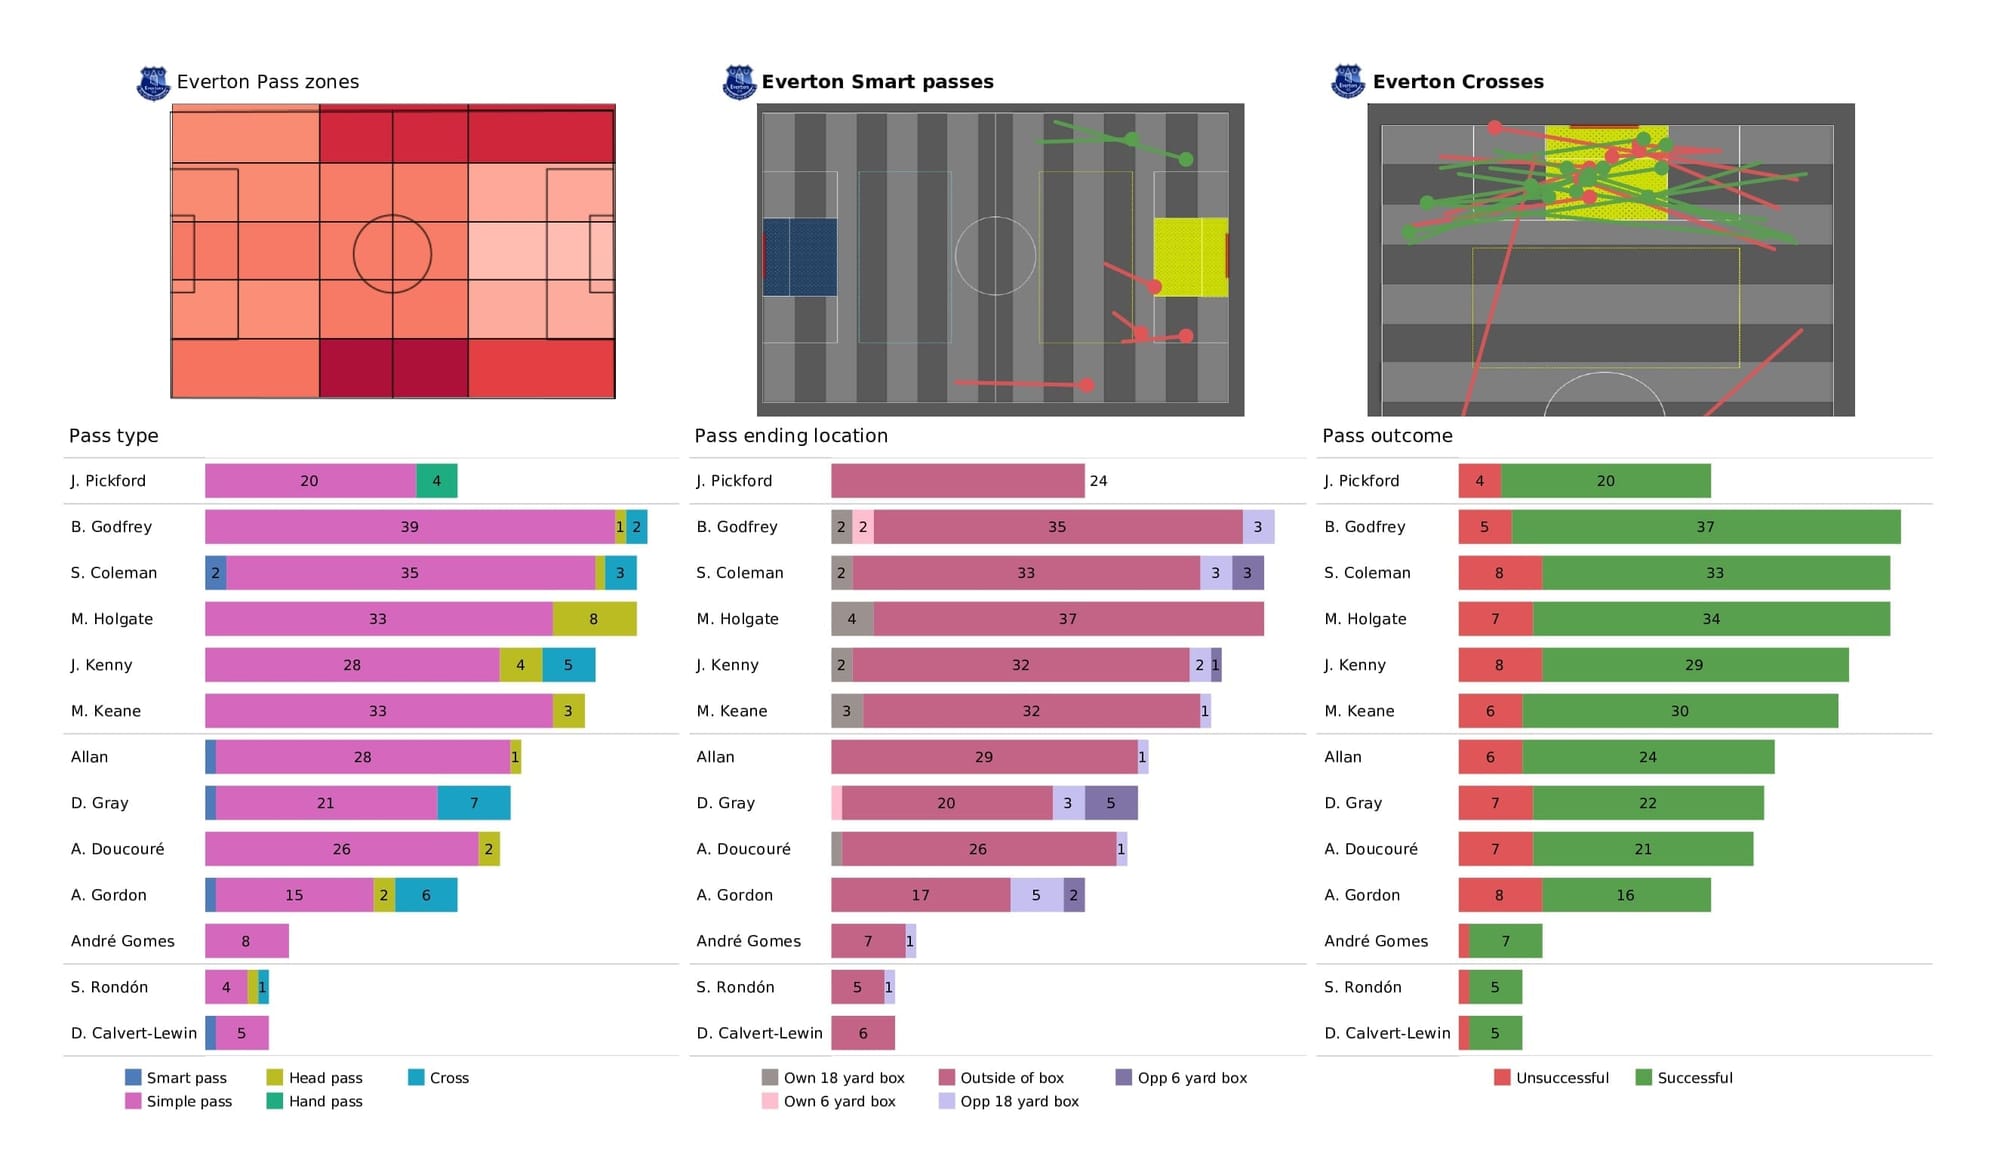
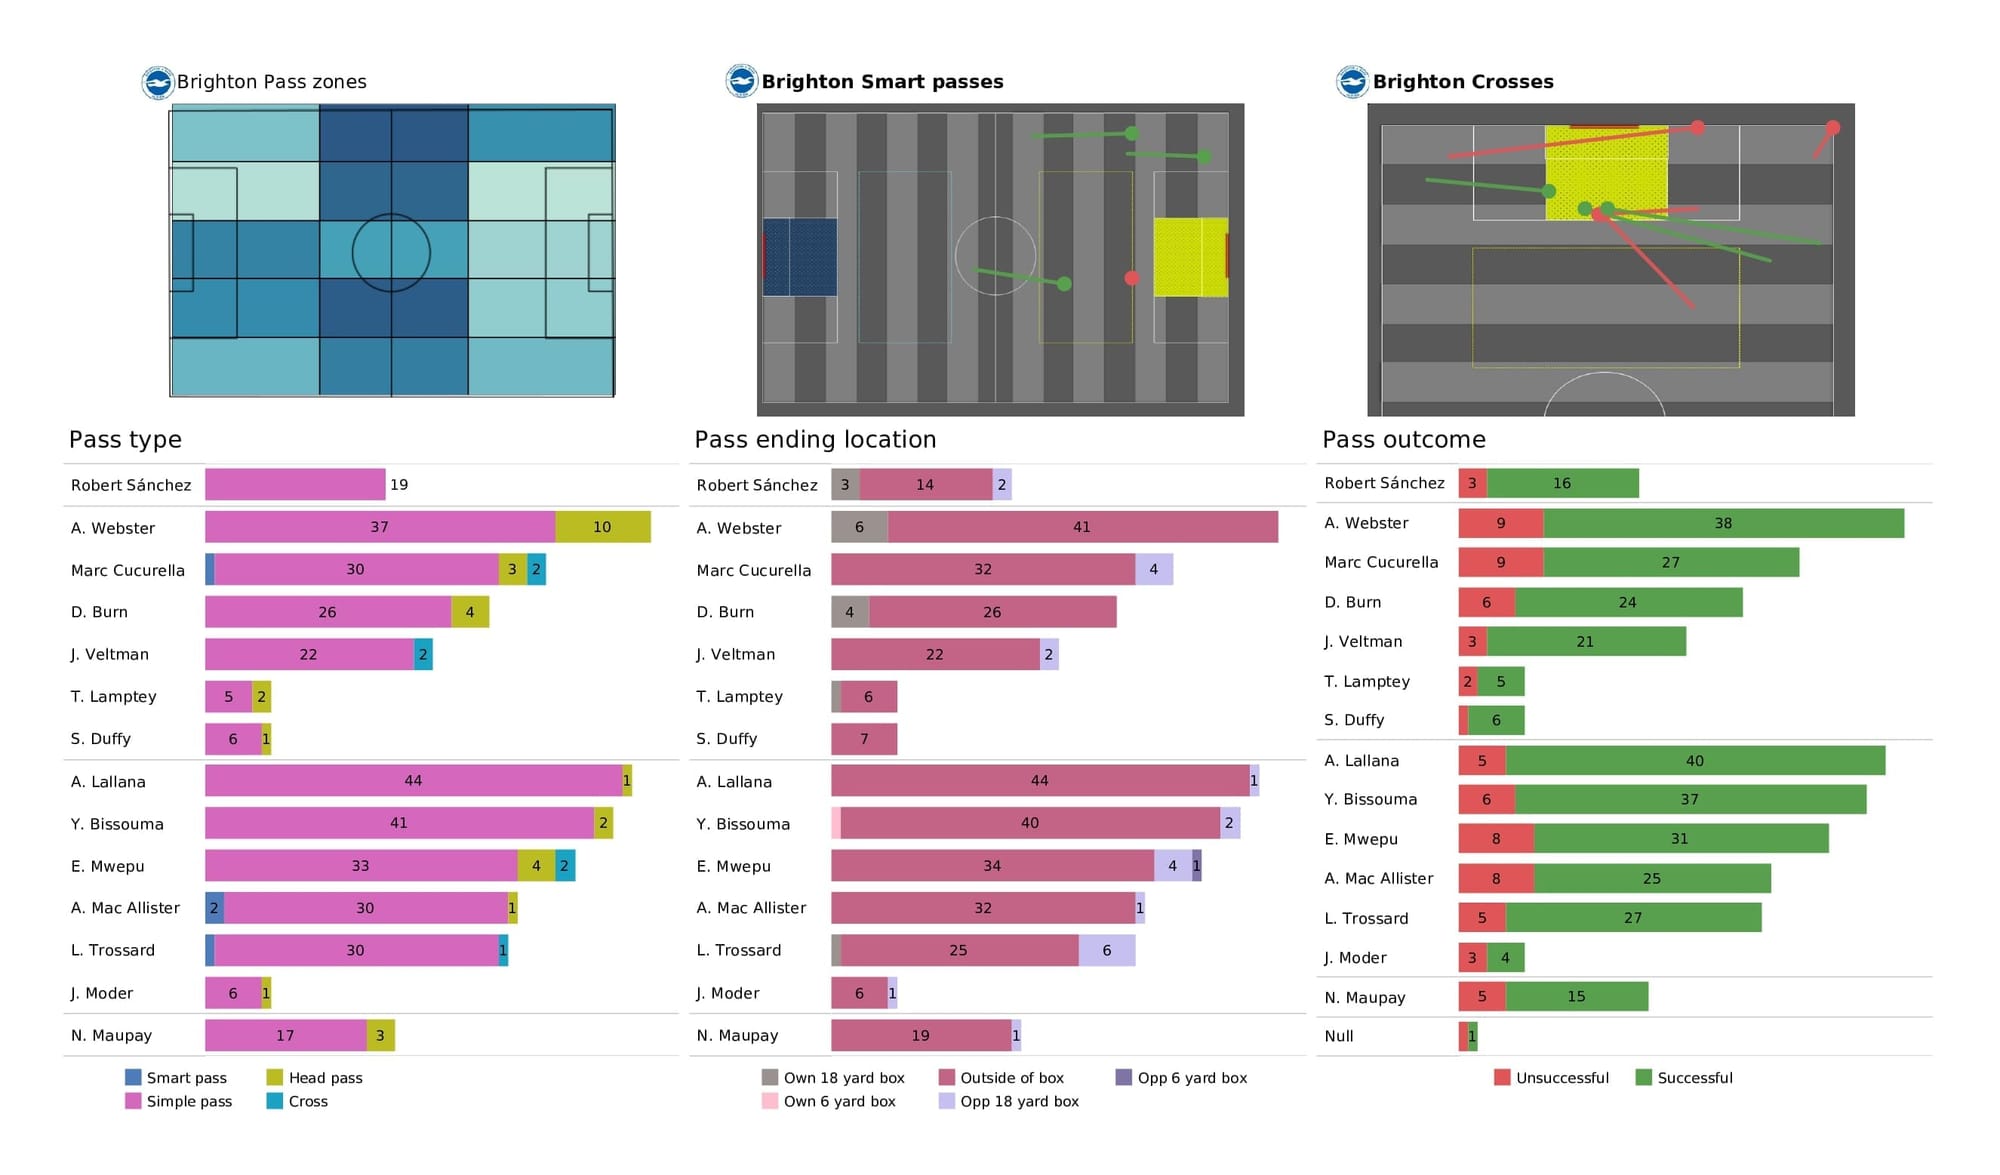
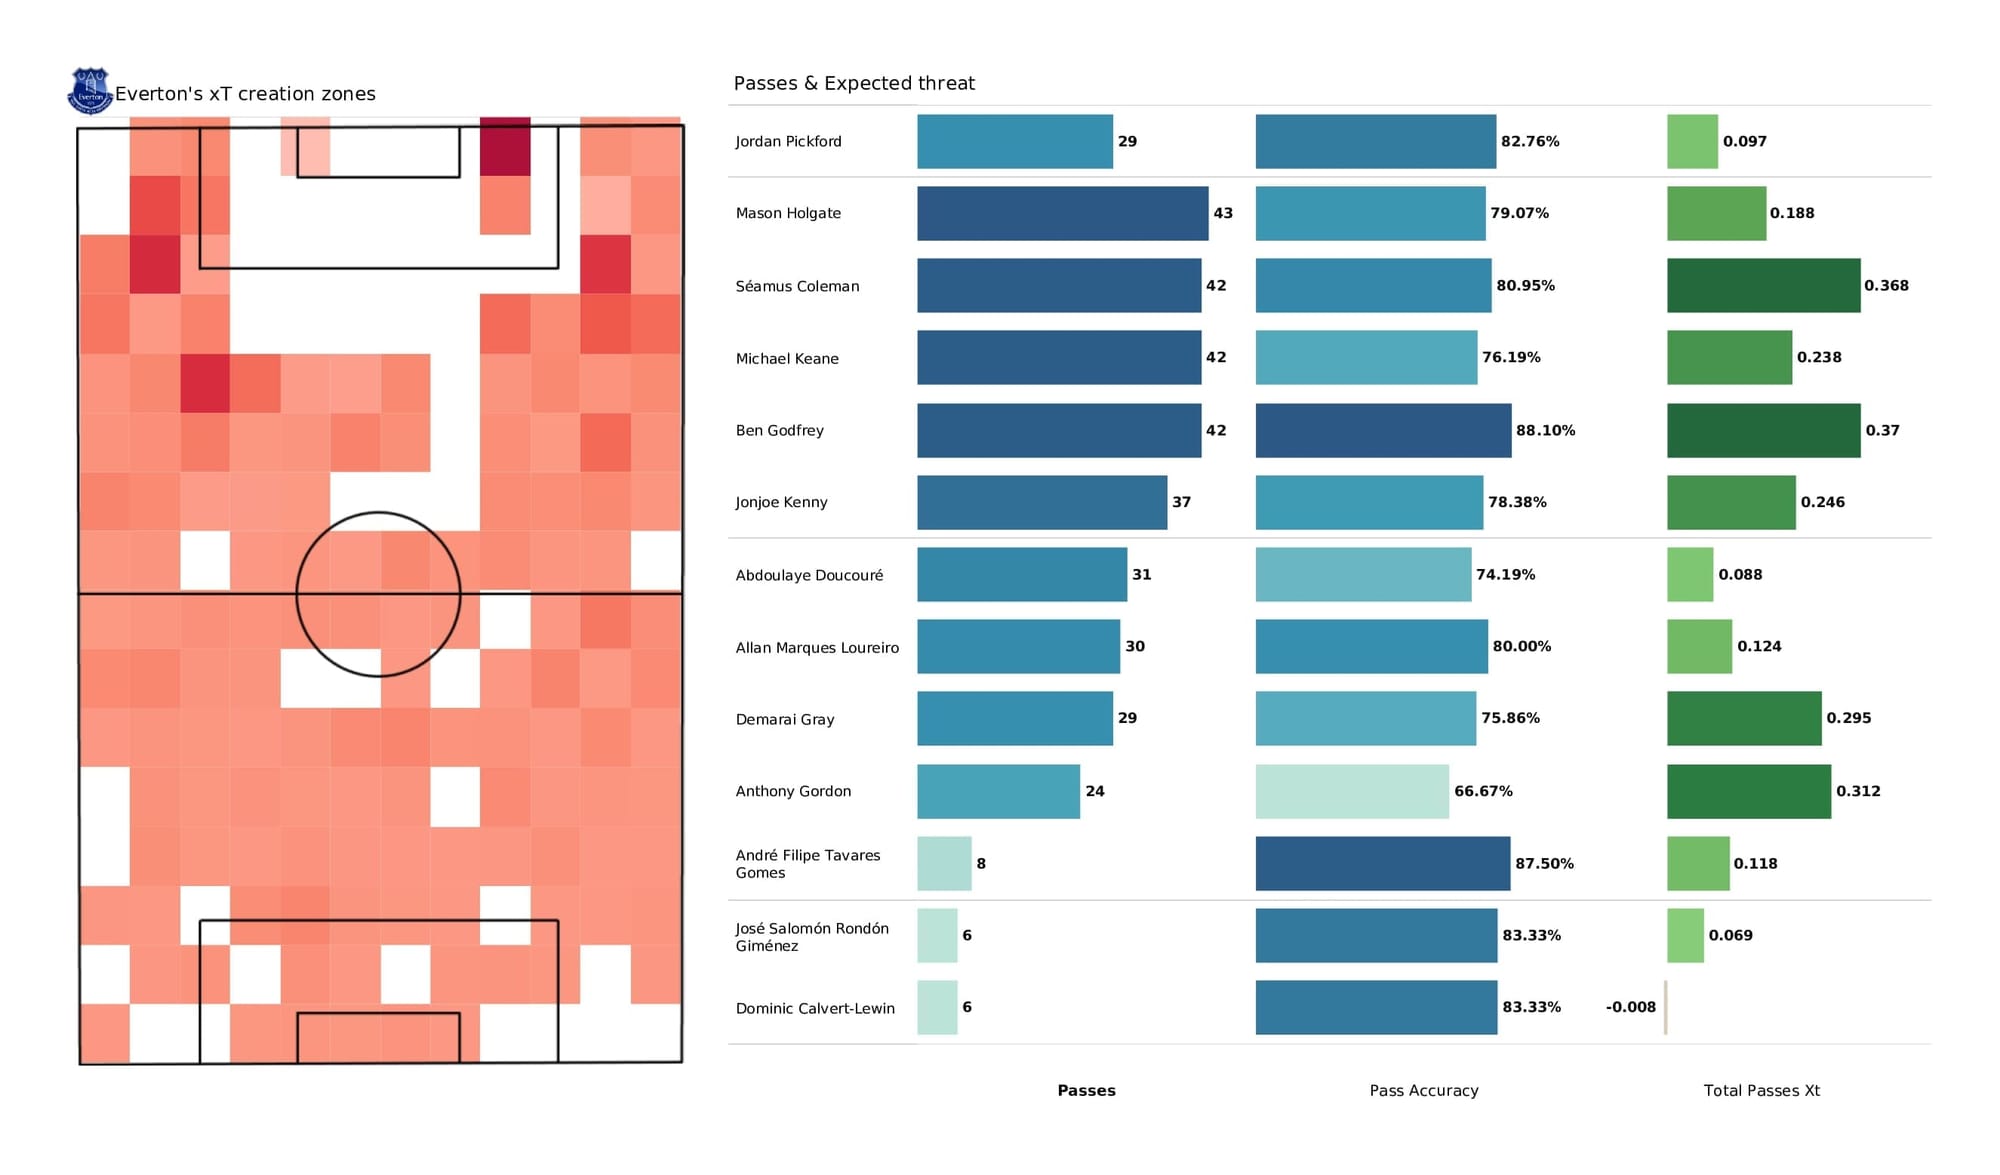
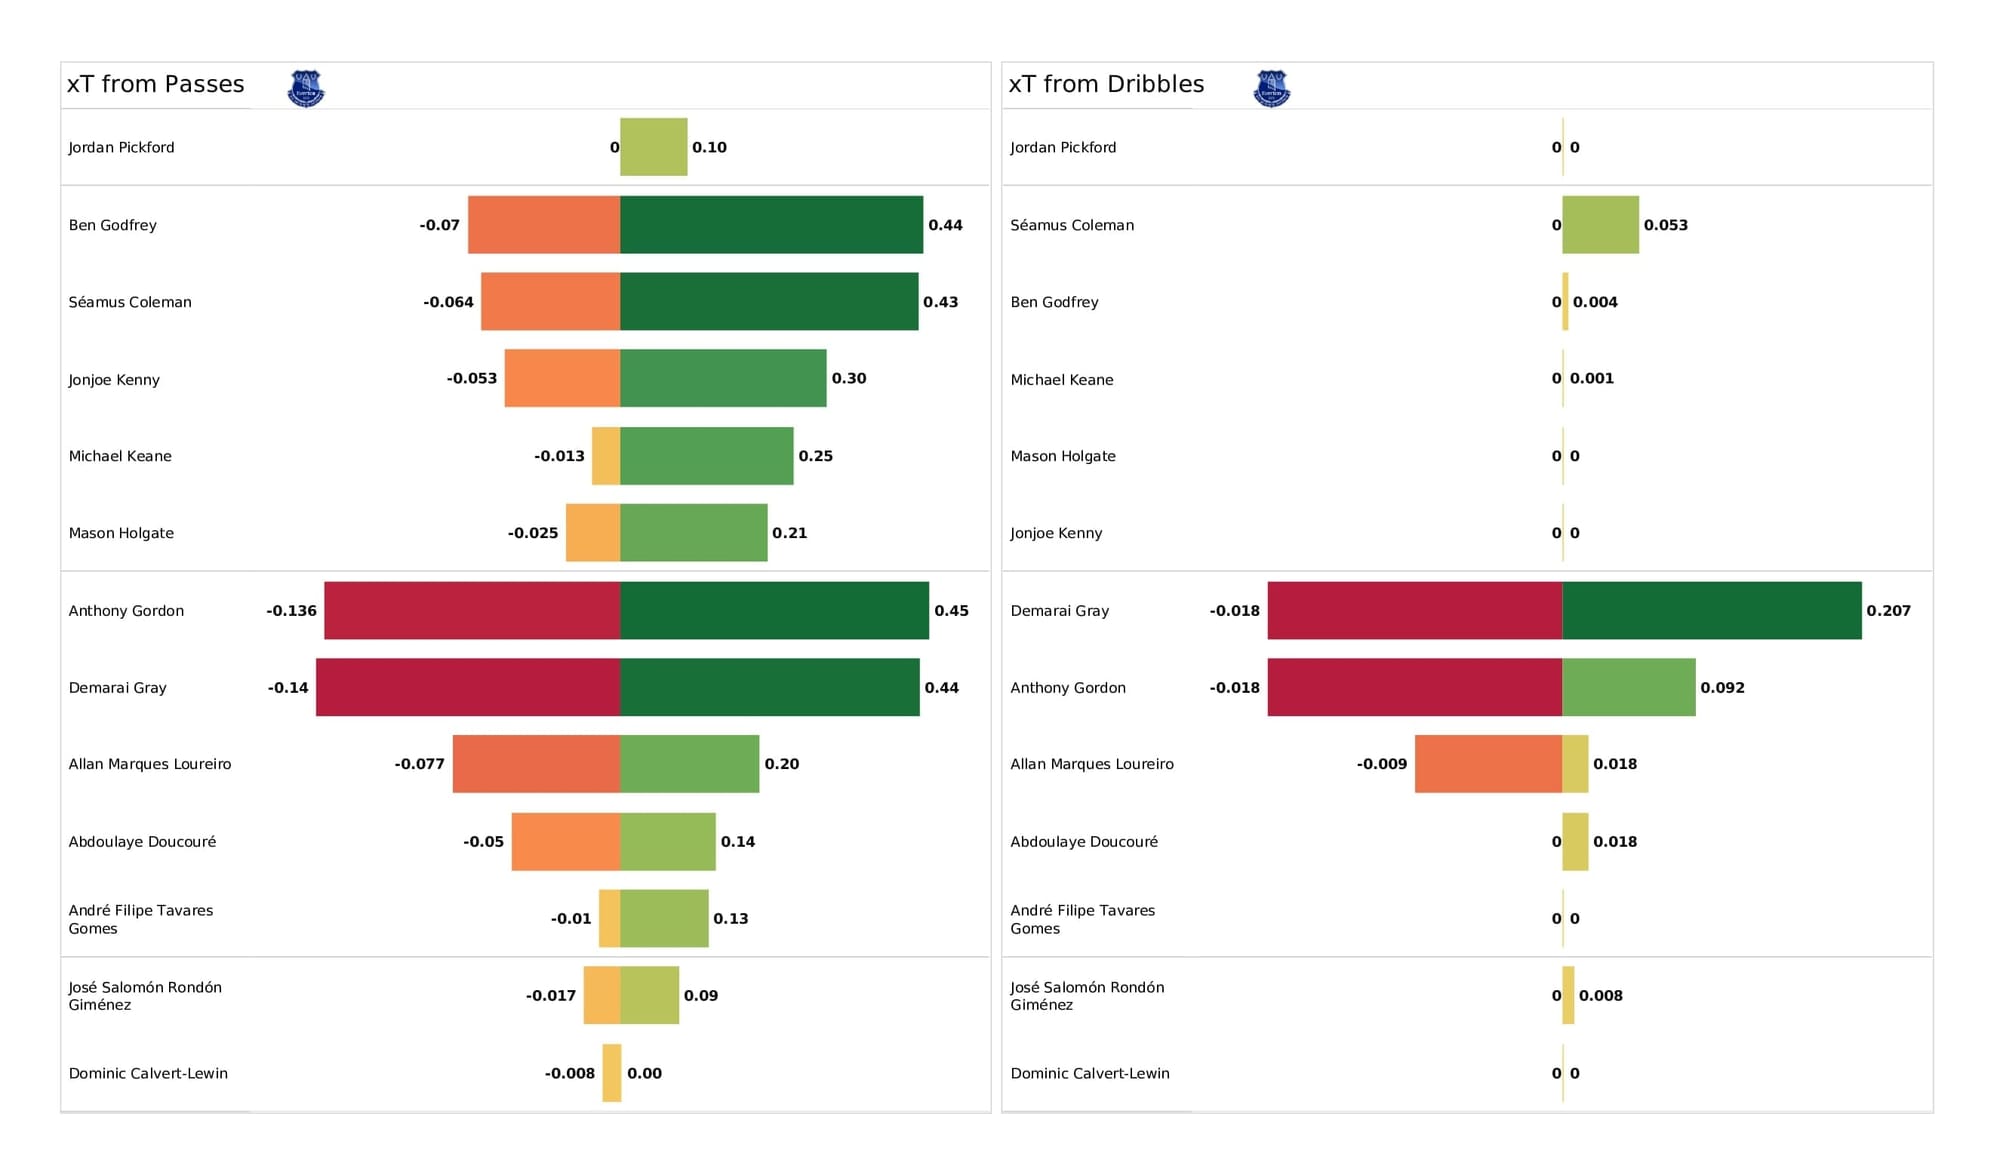
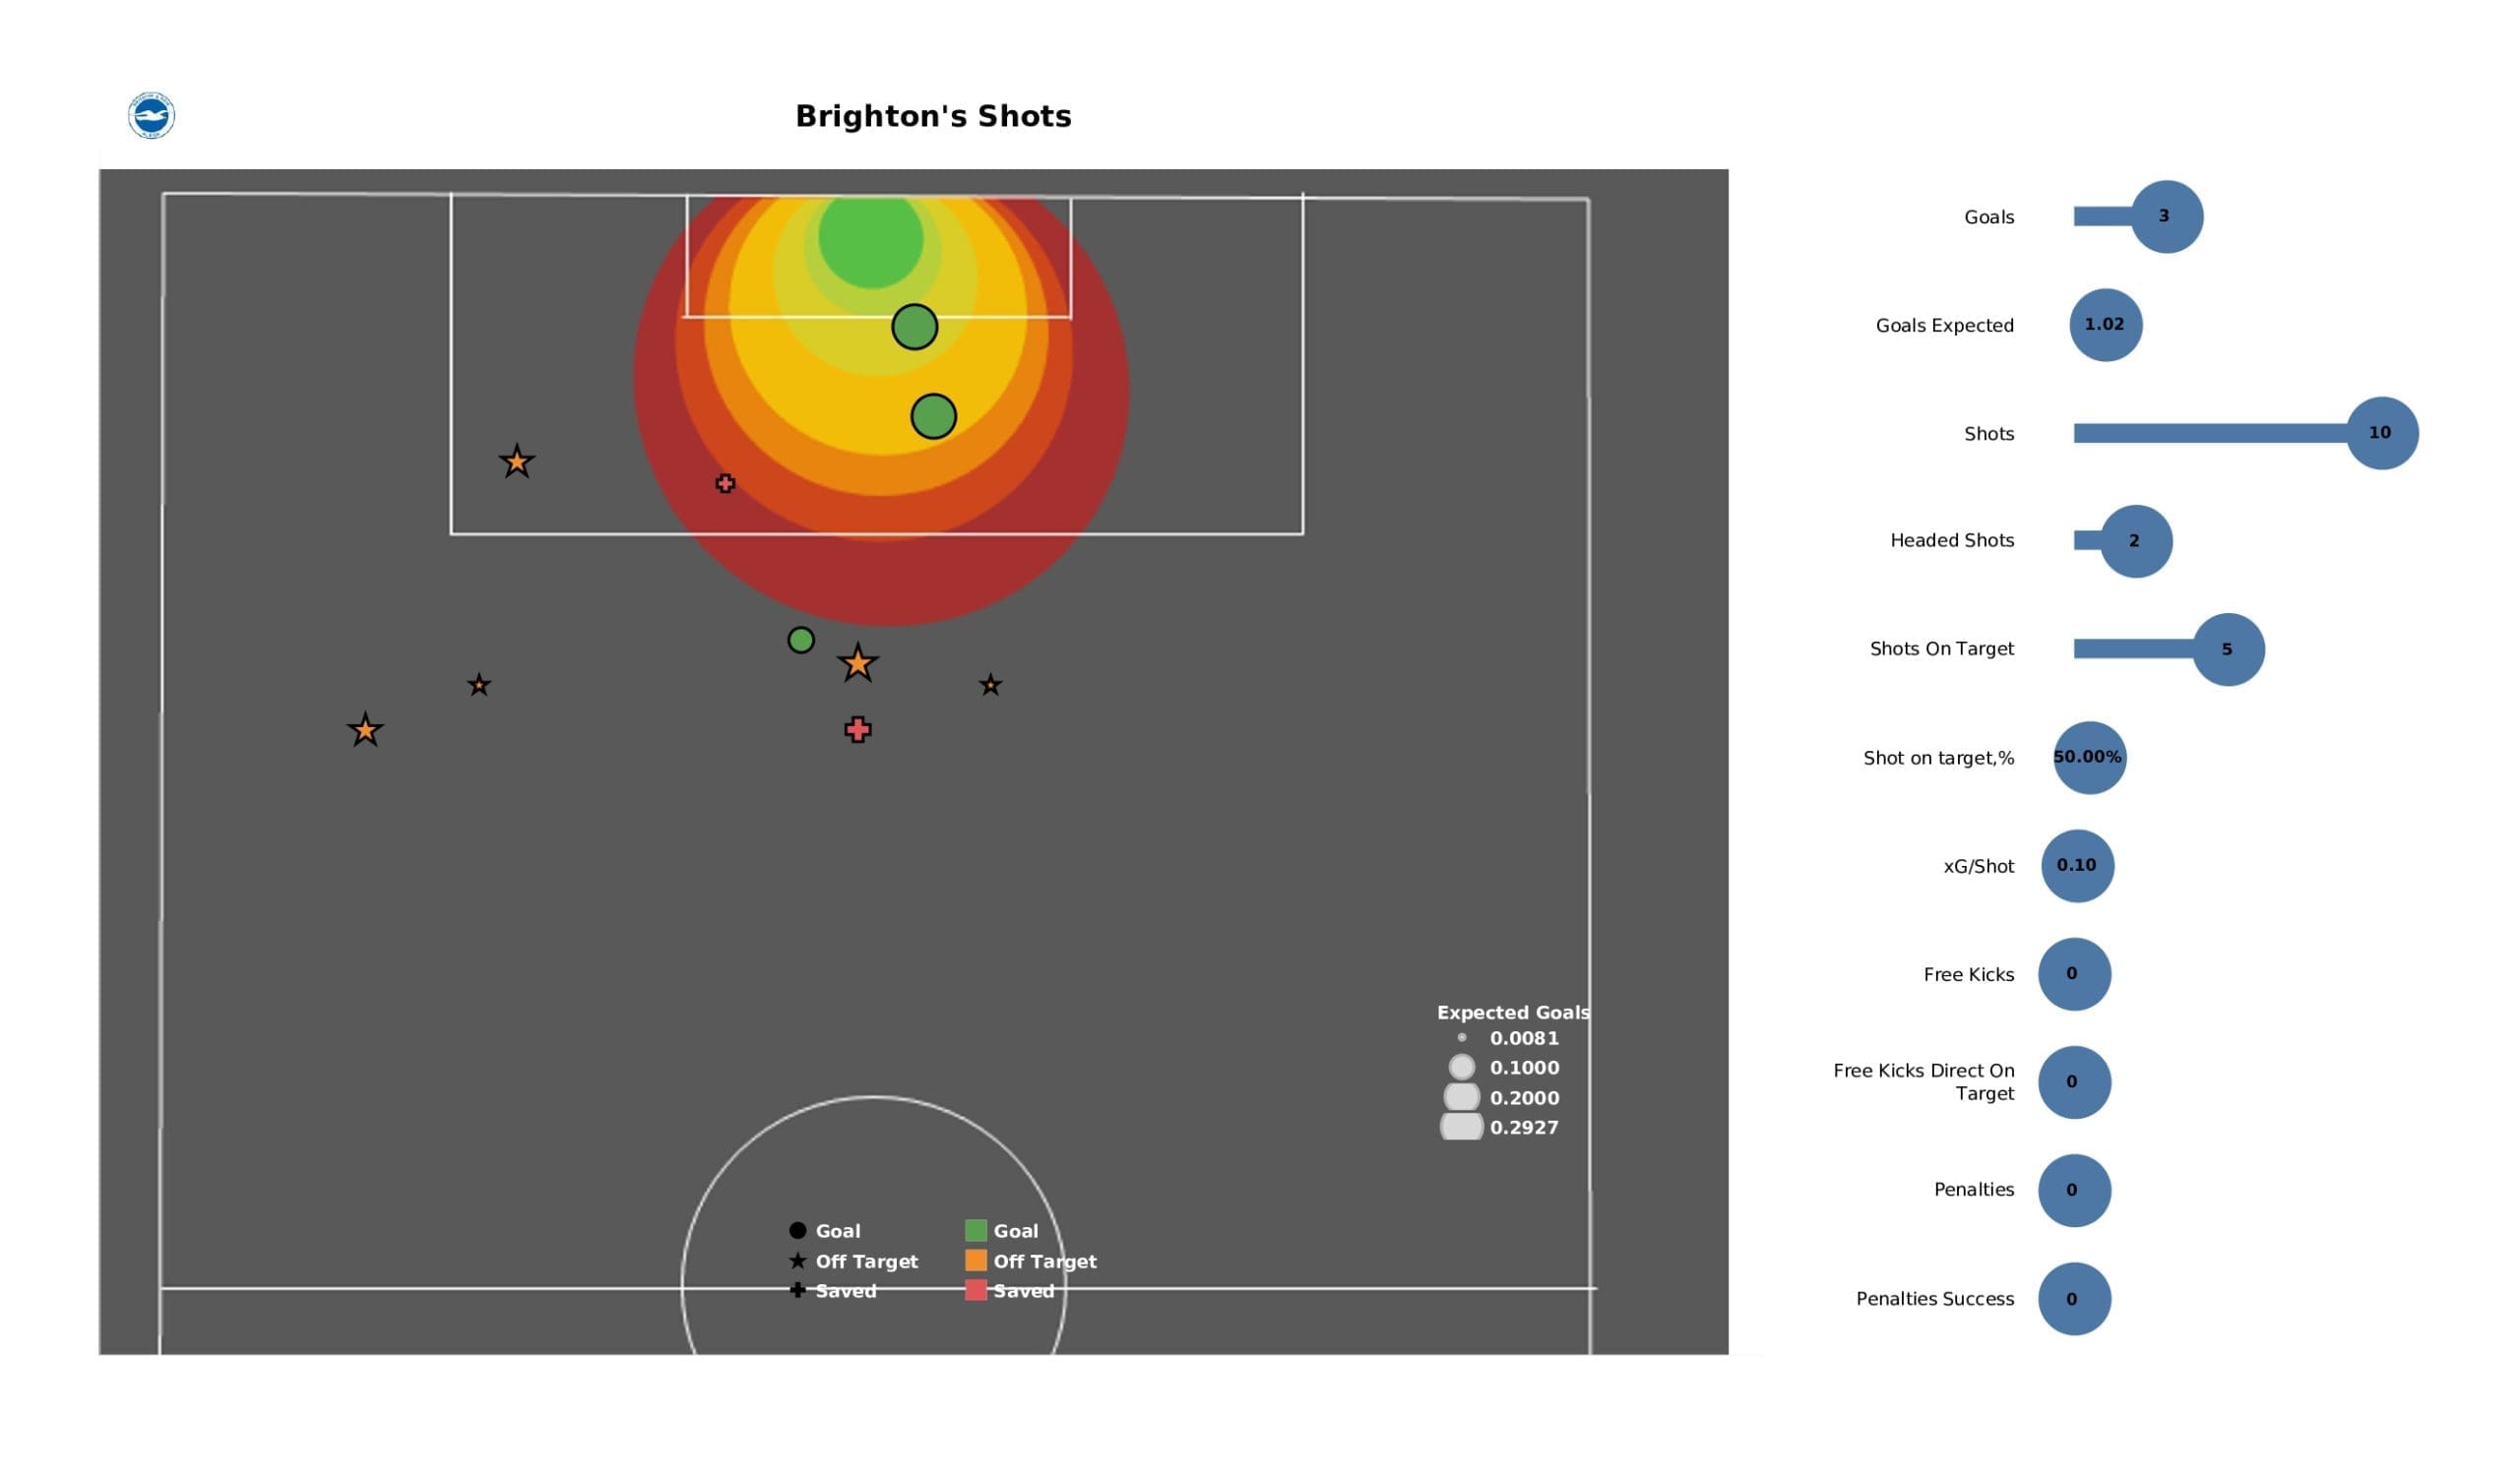
We’ve broken down all the key stats for you to digest in this tactical analysis, including;
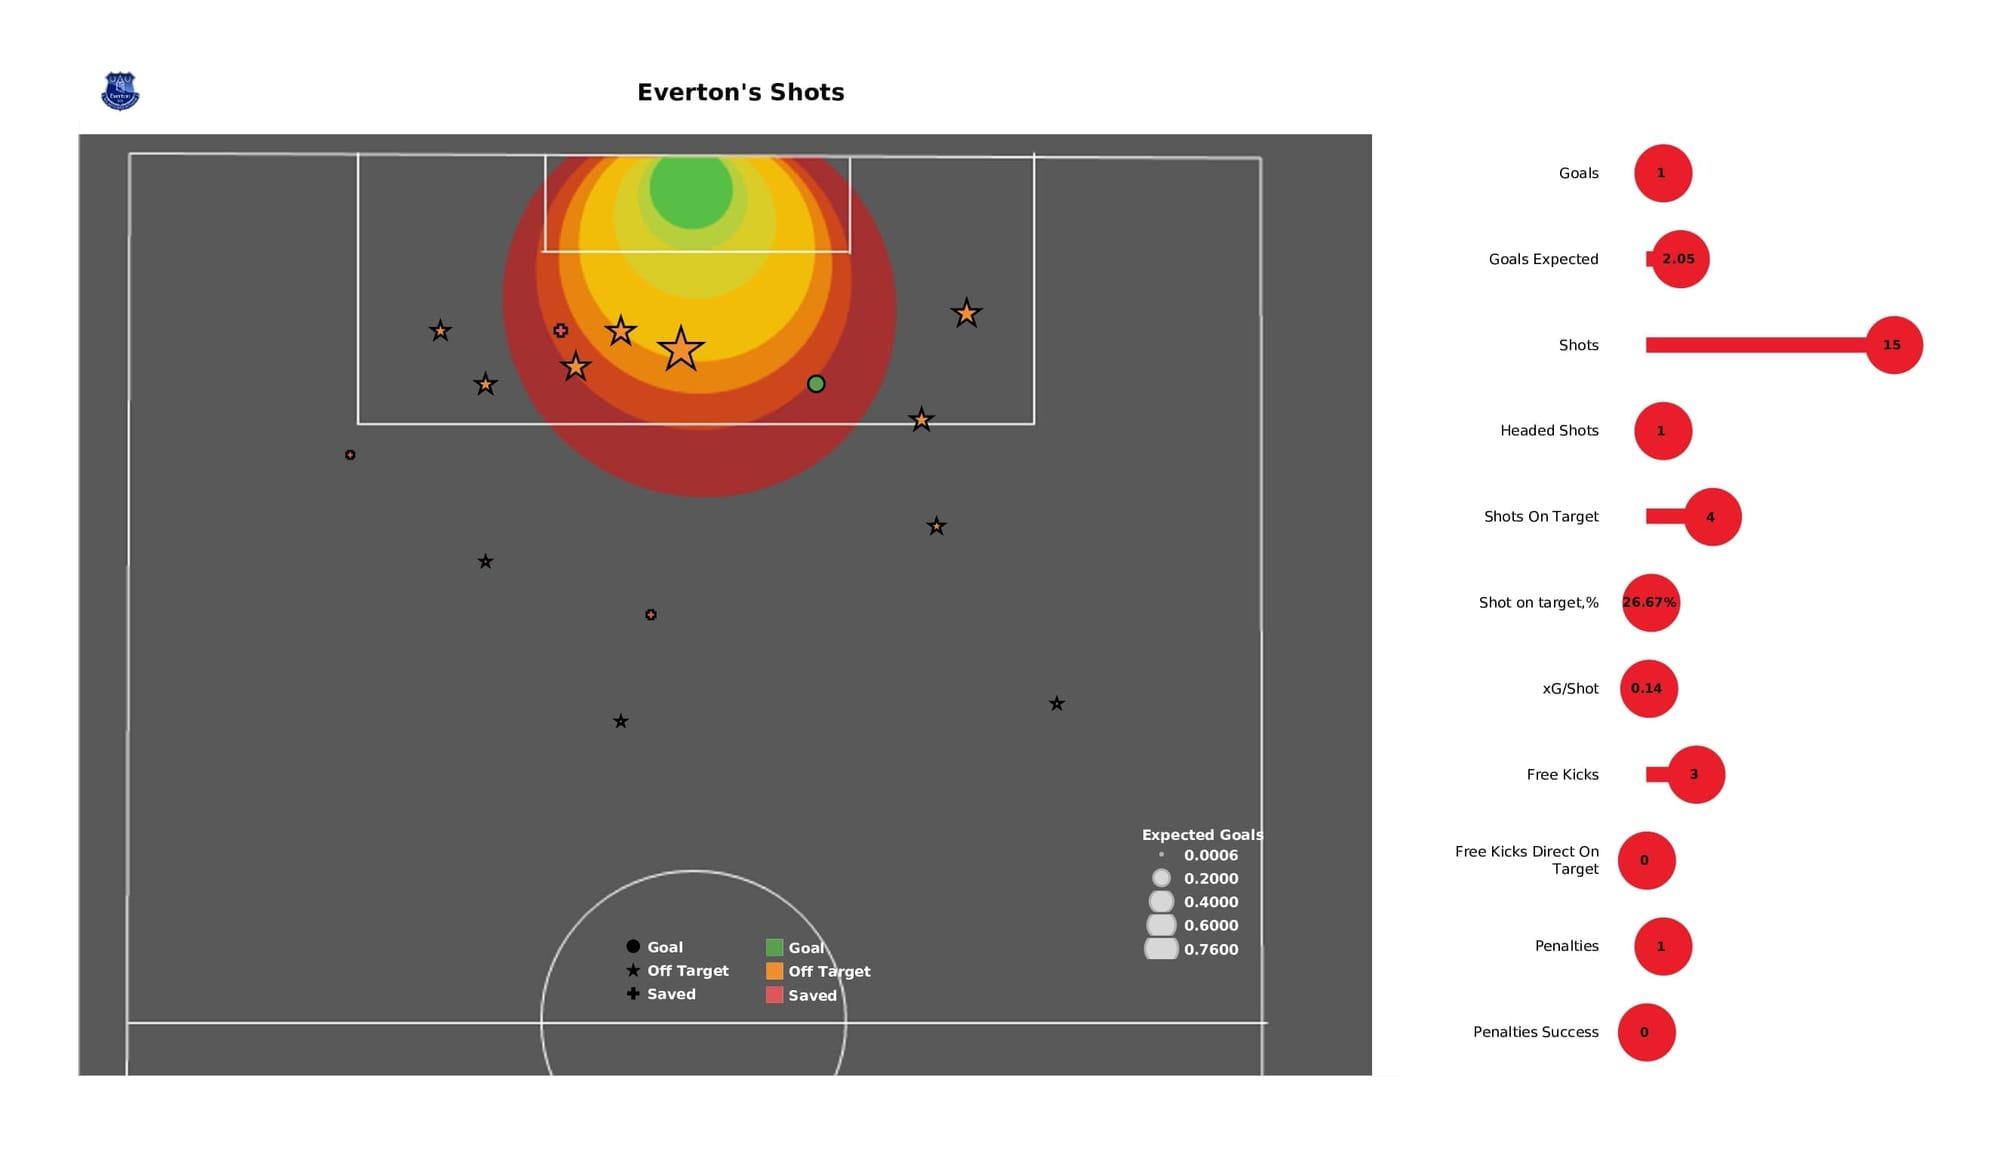
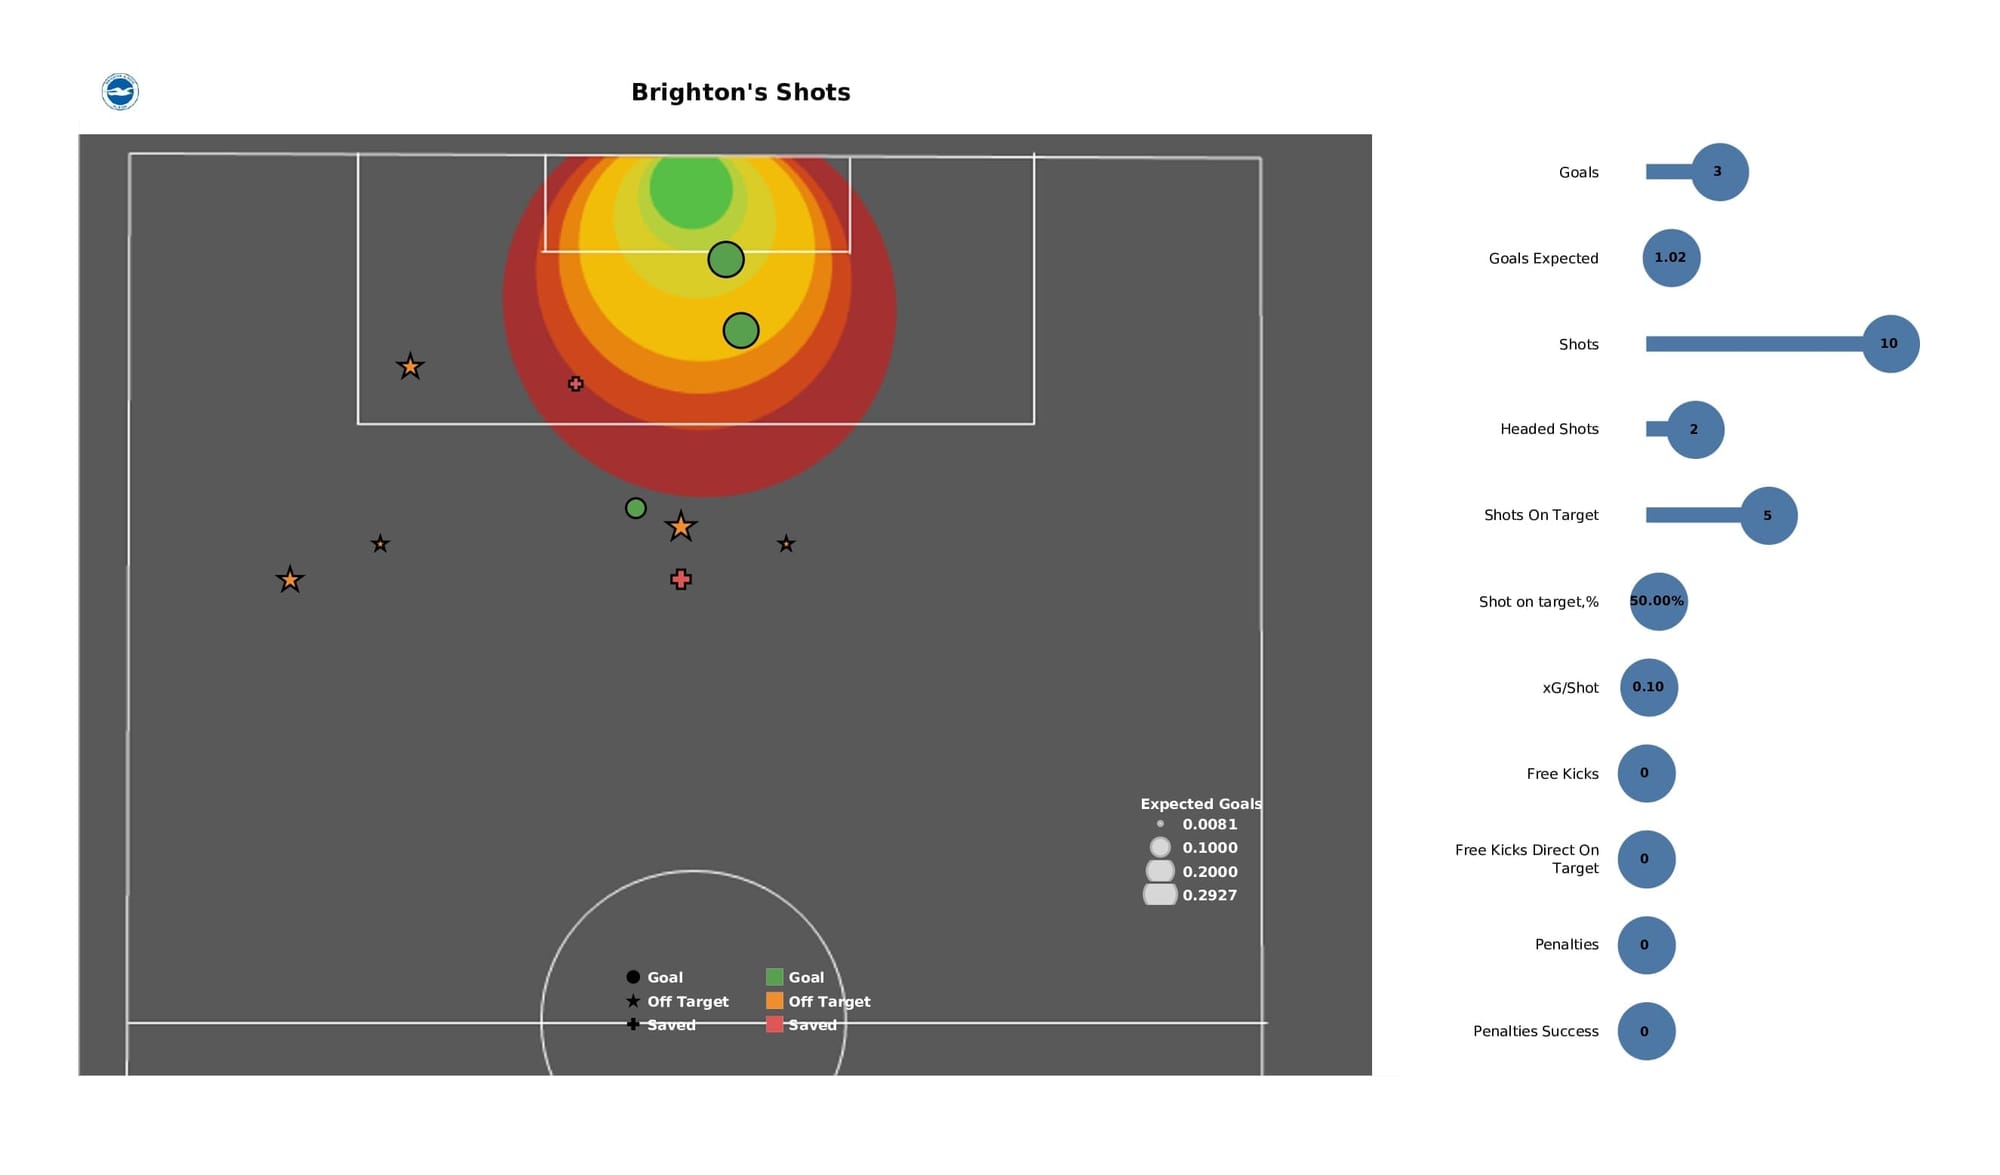
* shot maps
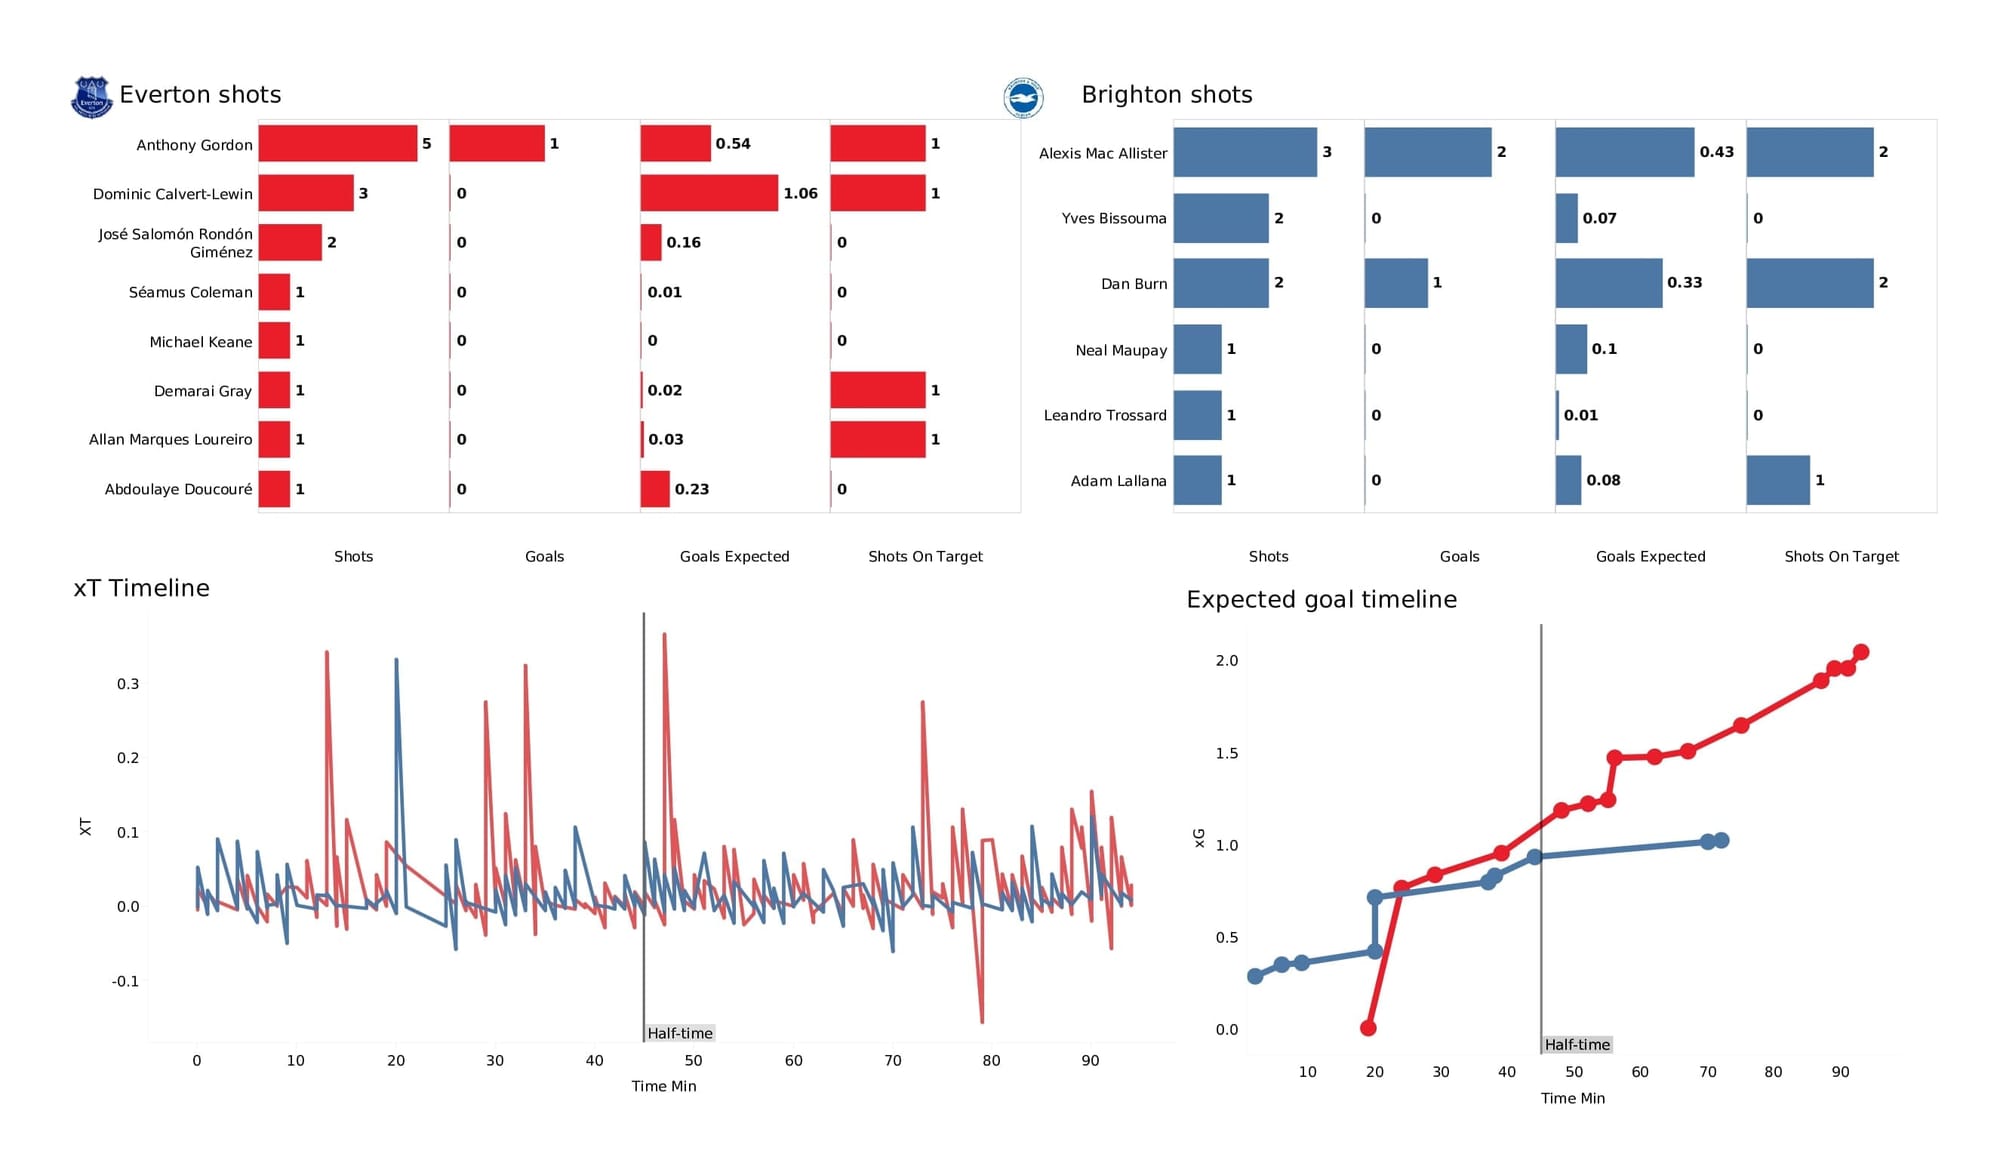
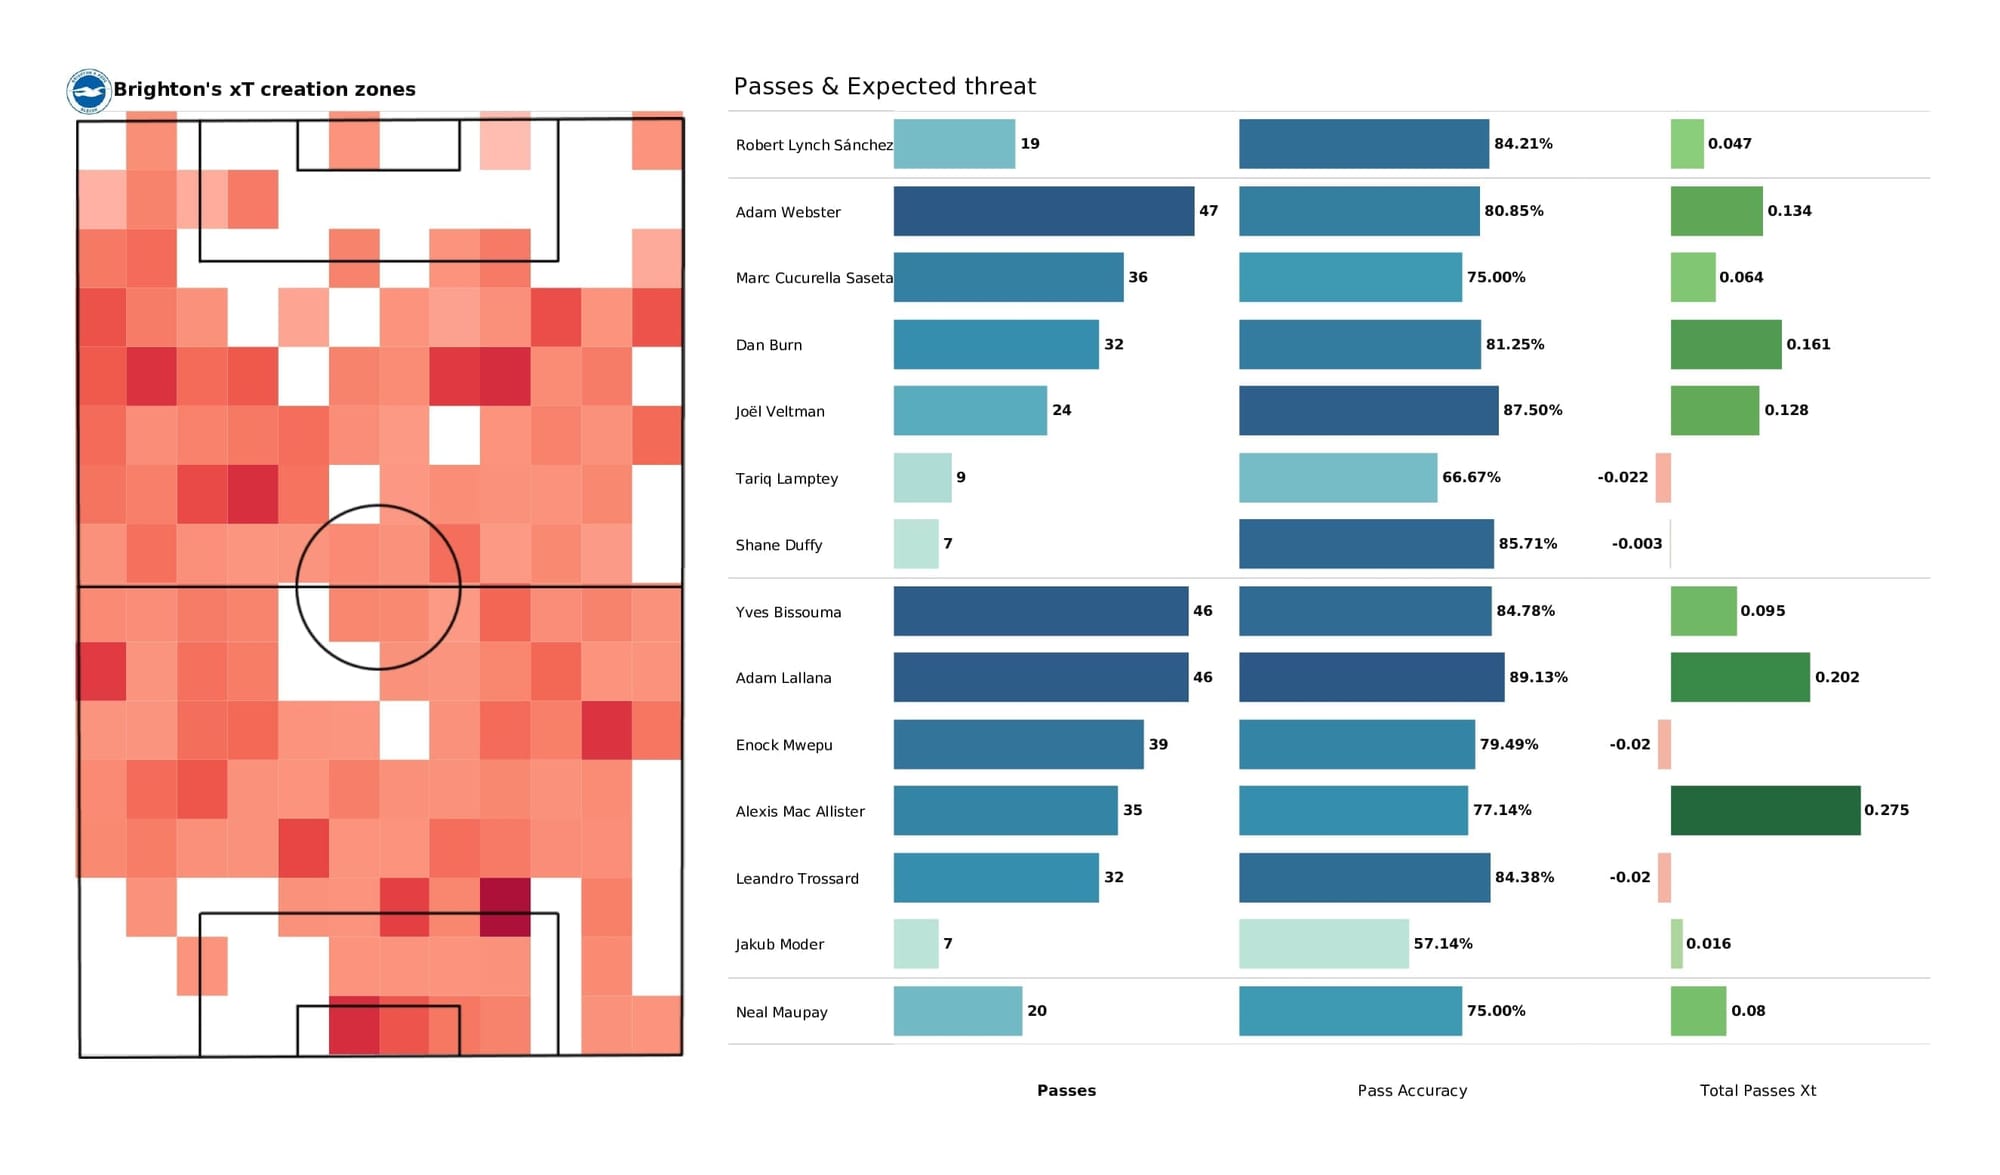
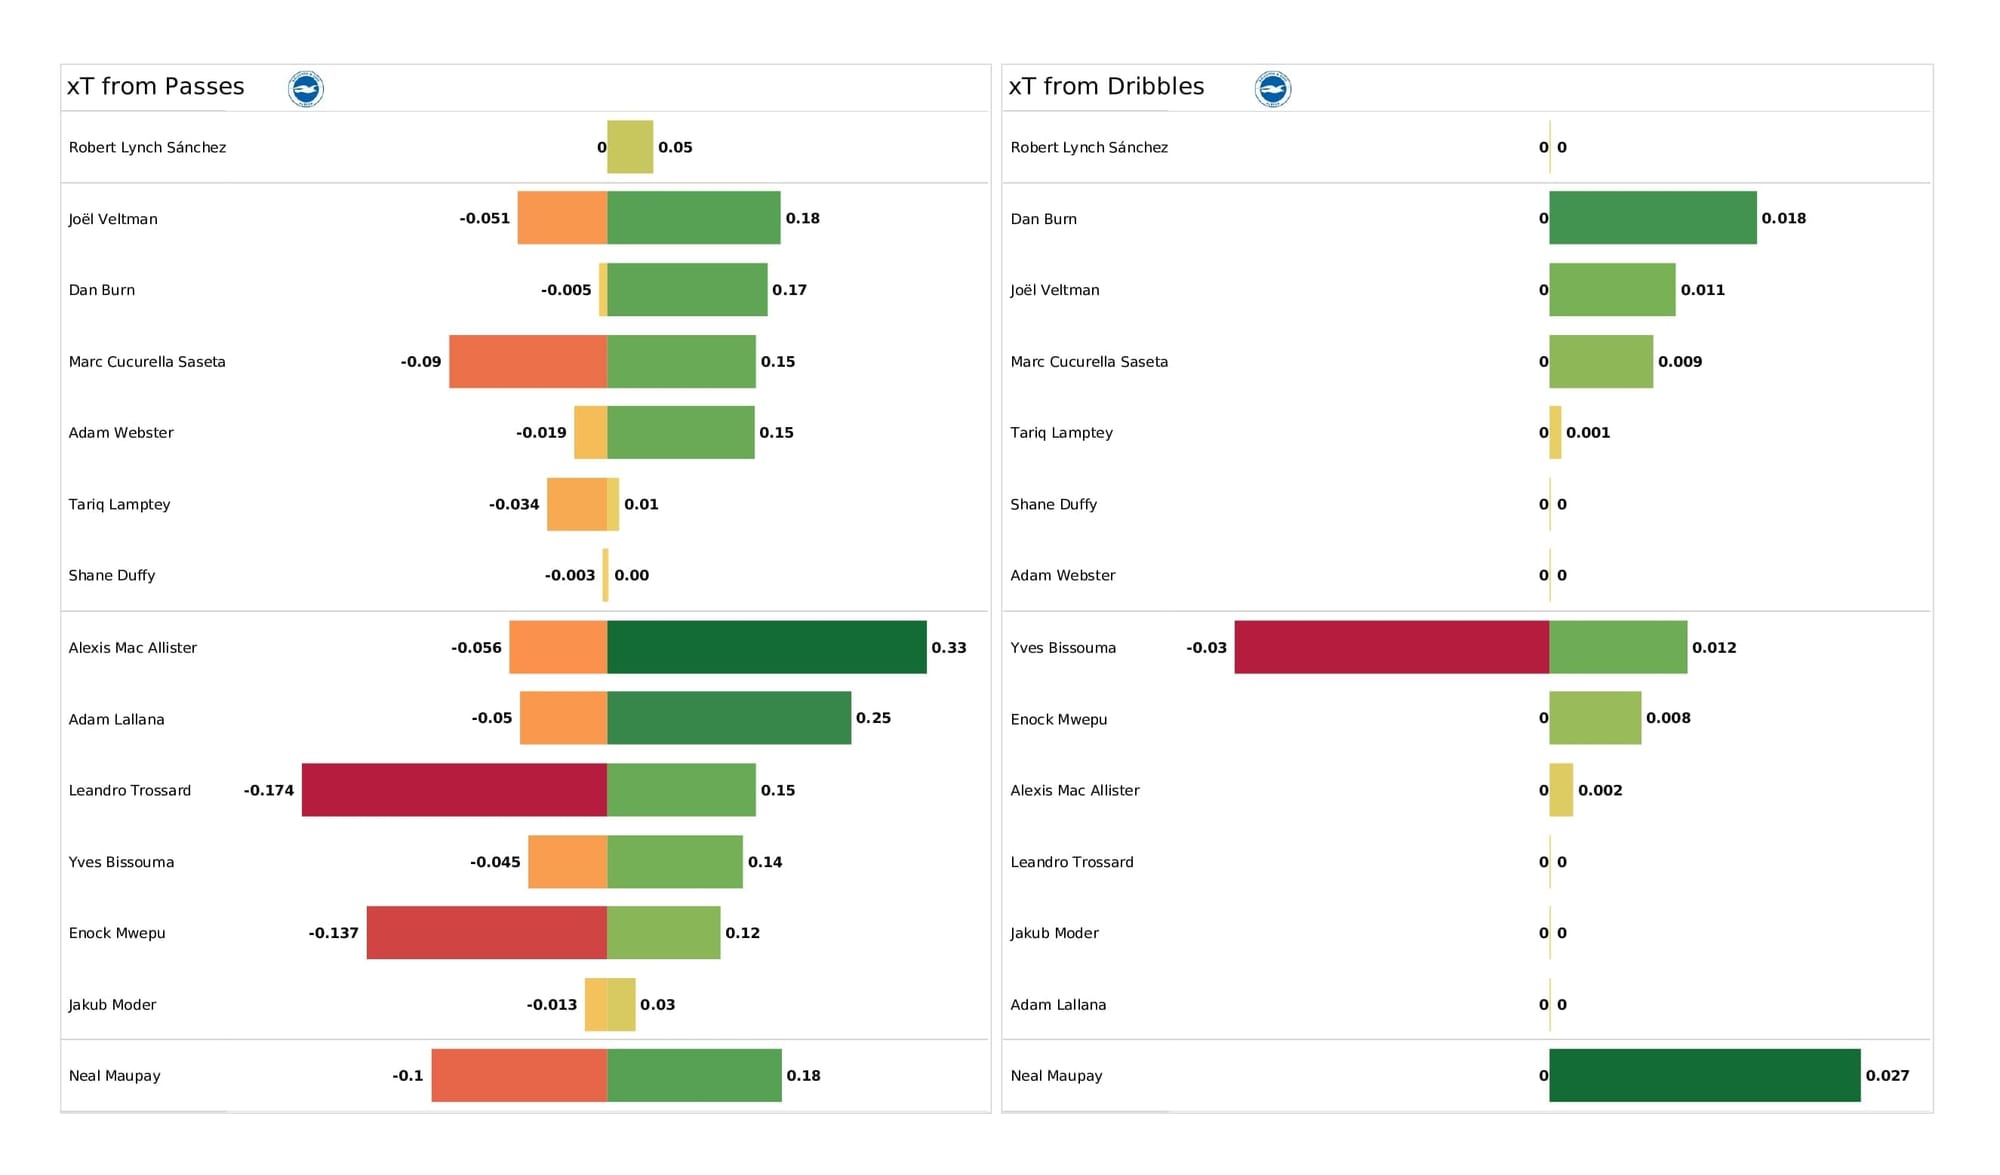
* xT (expected threat)
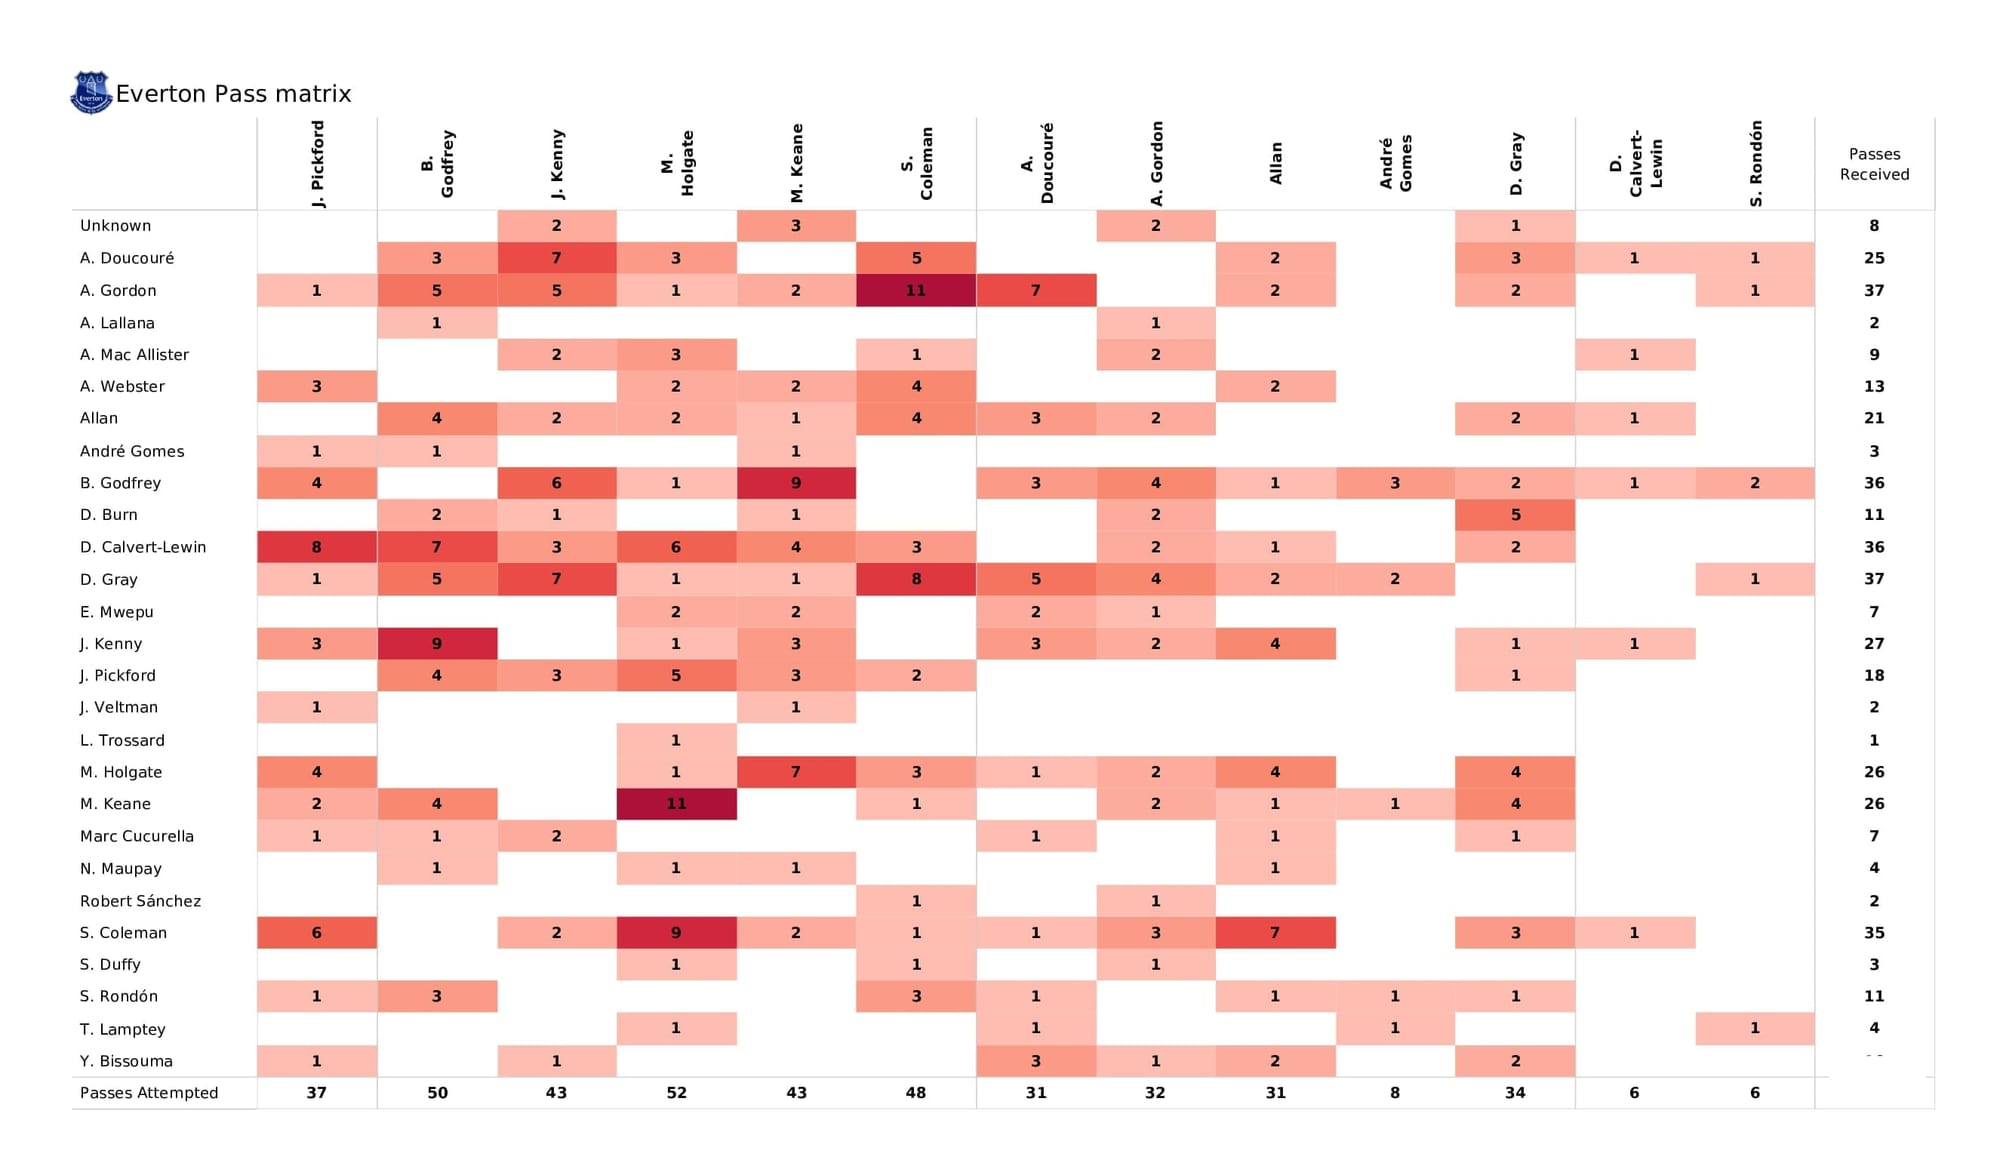
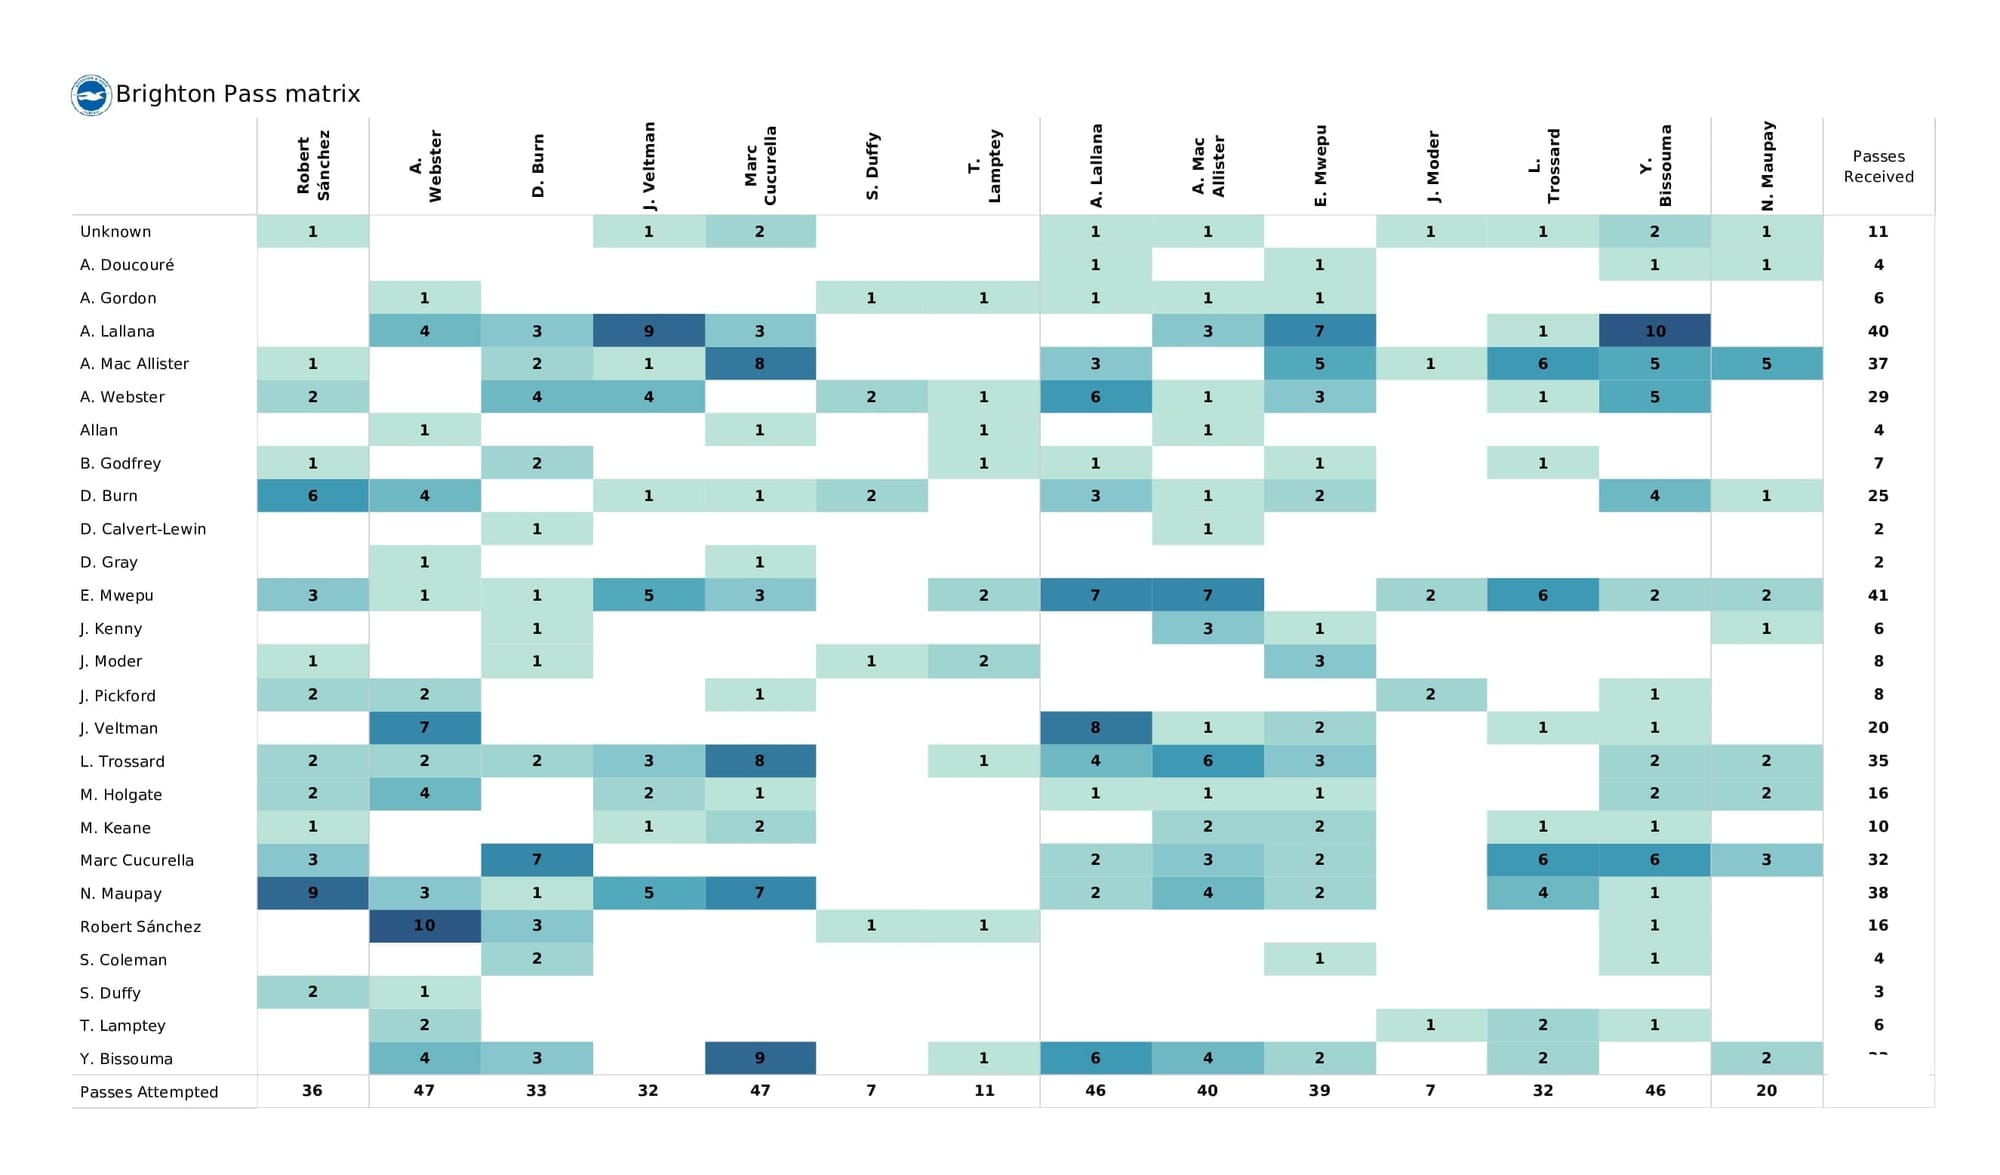
* pass networks
* xG timelines
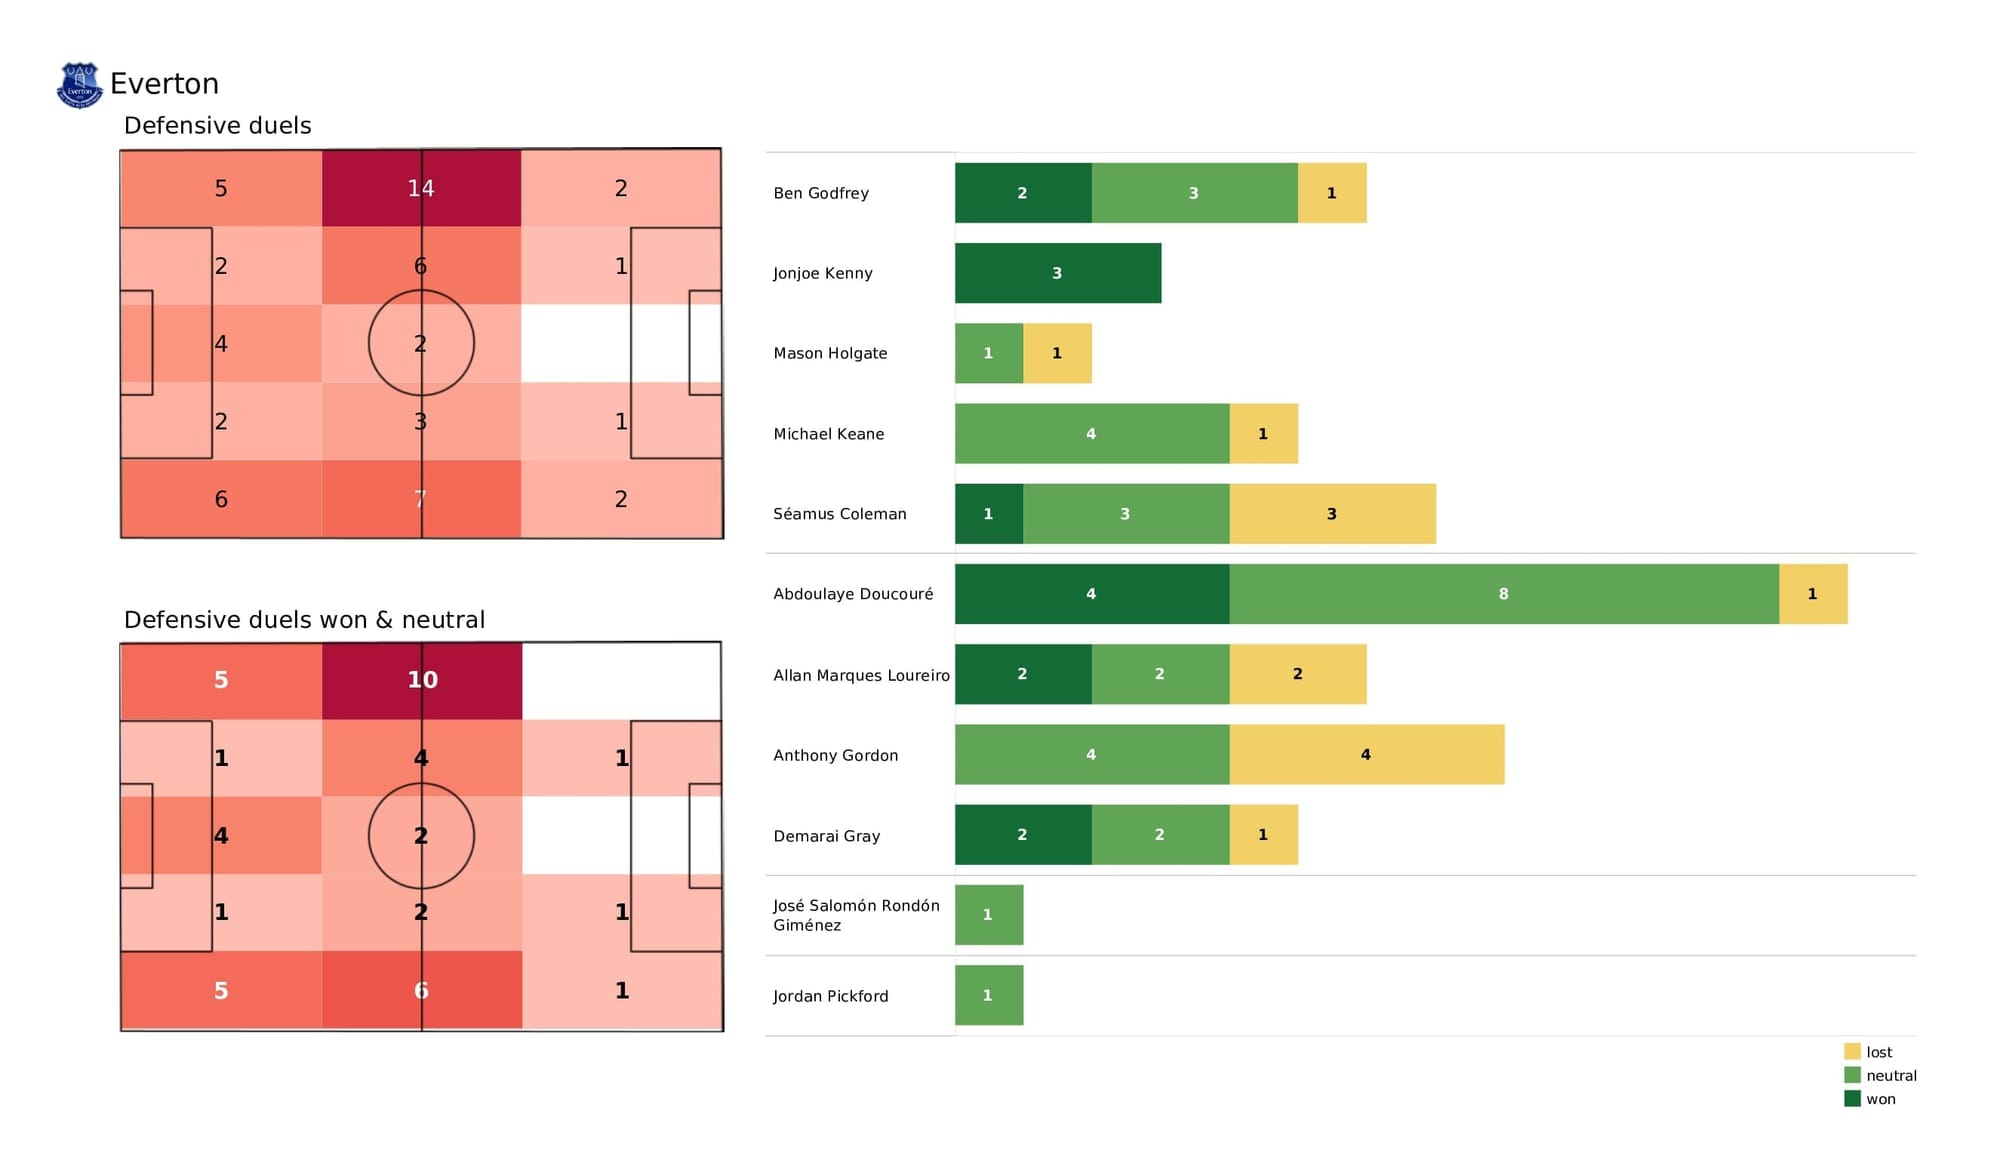
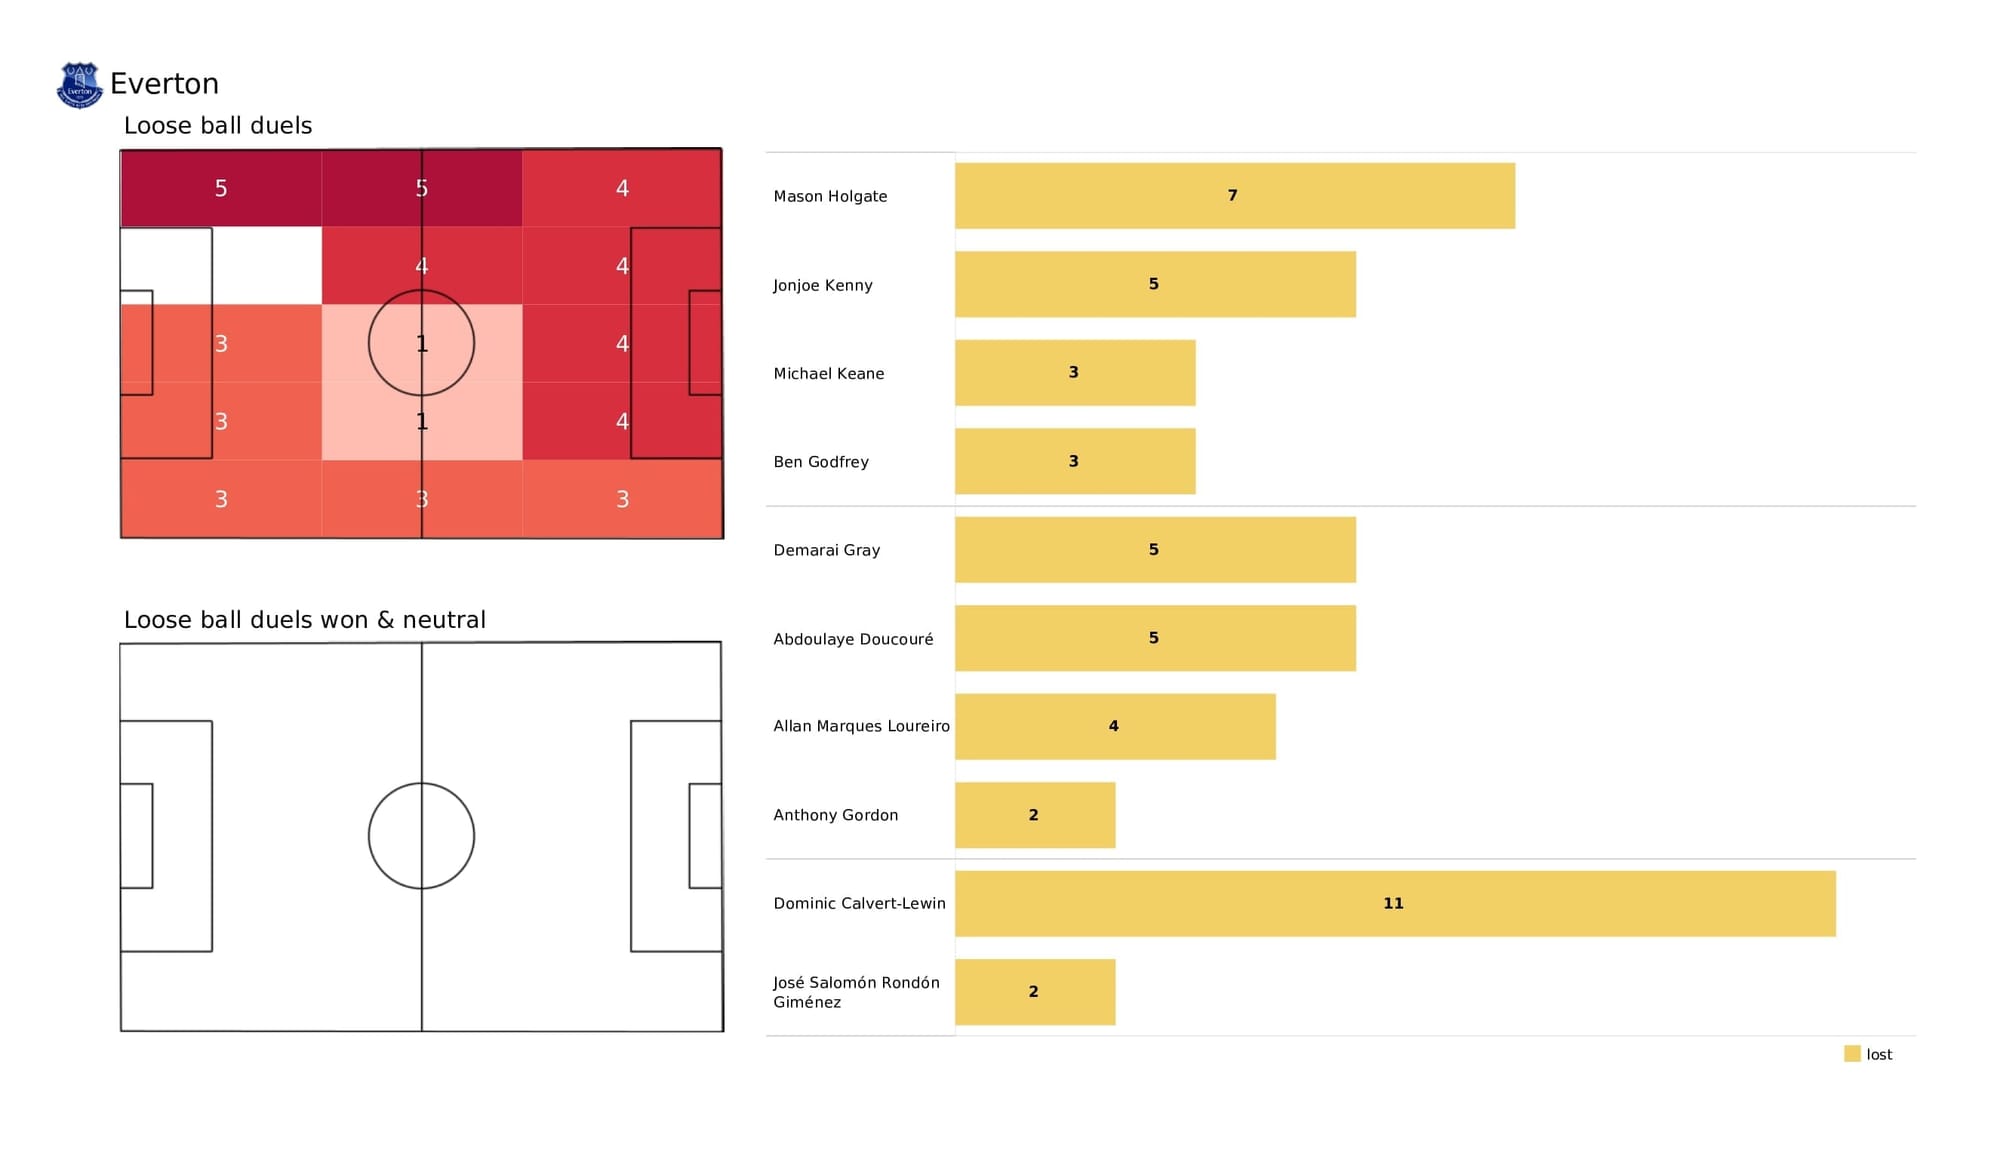
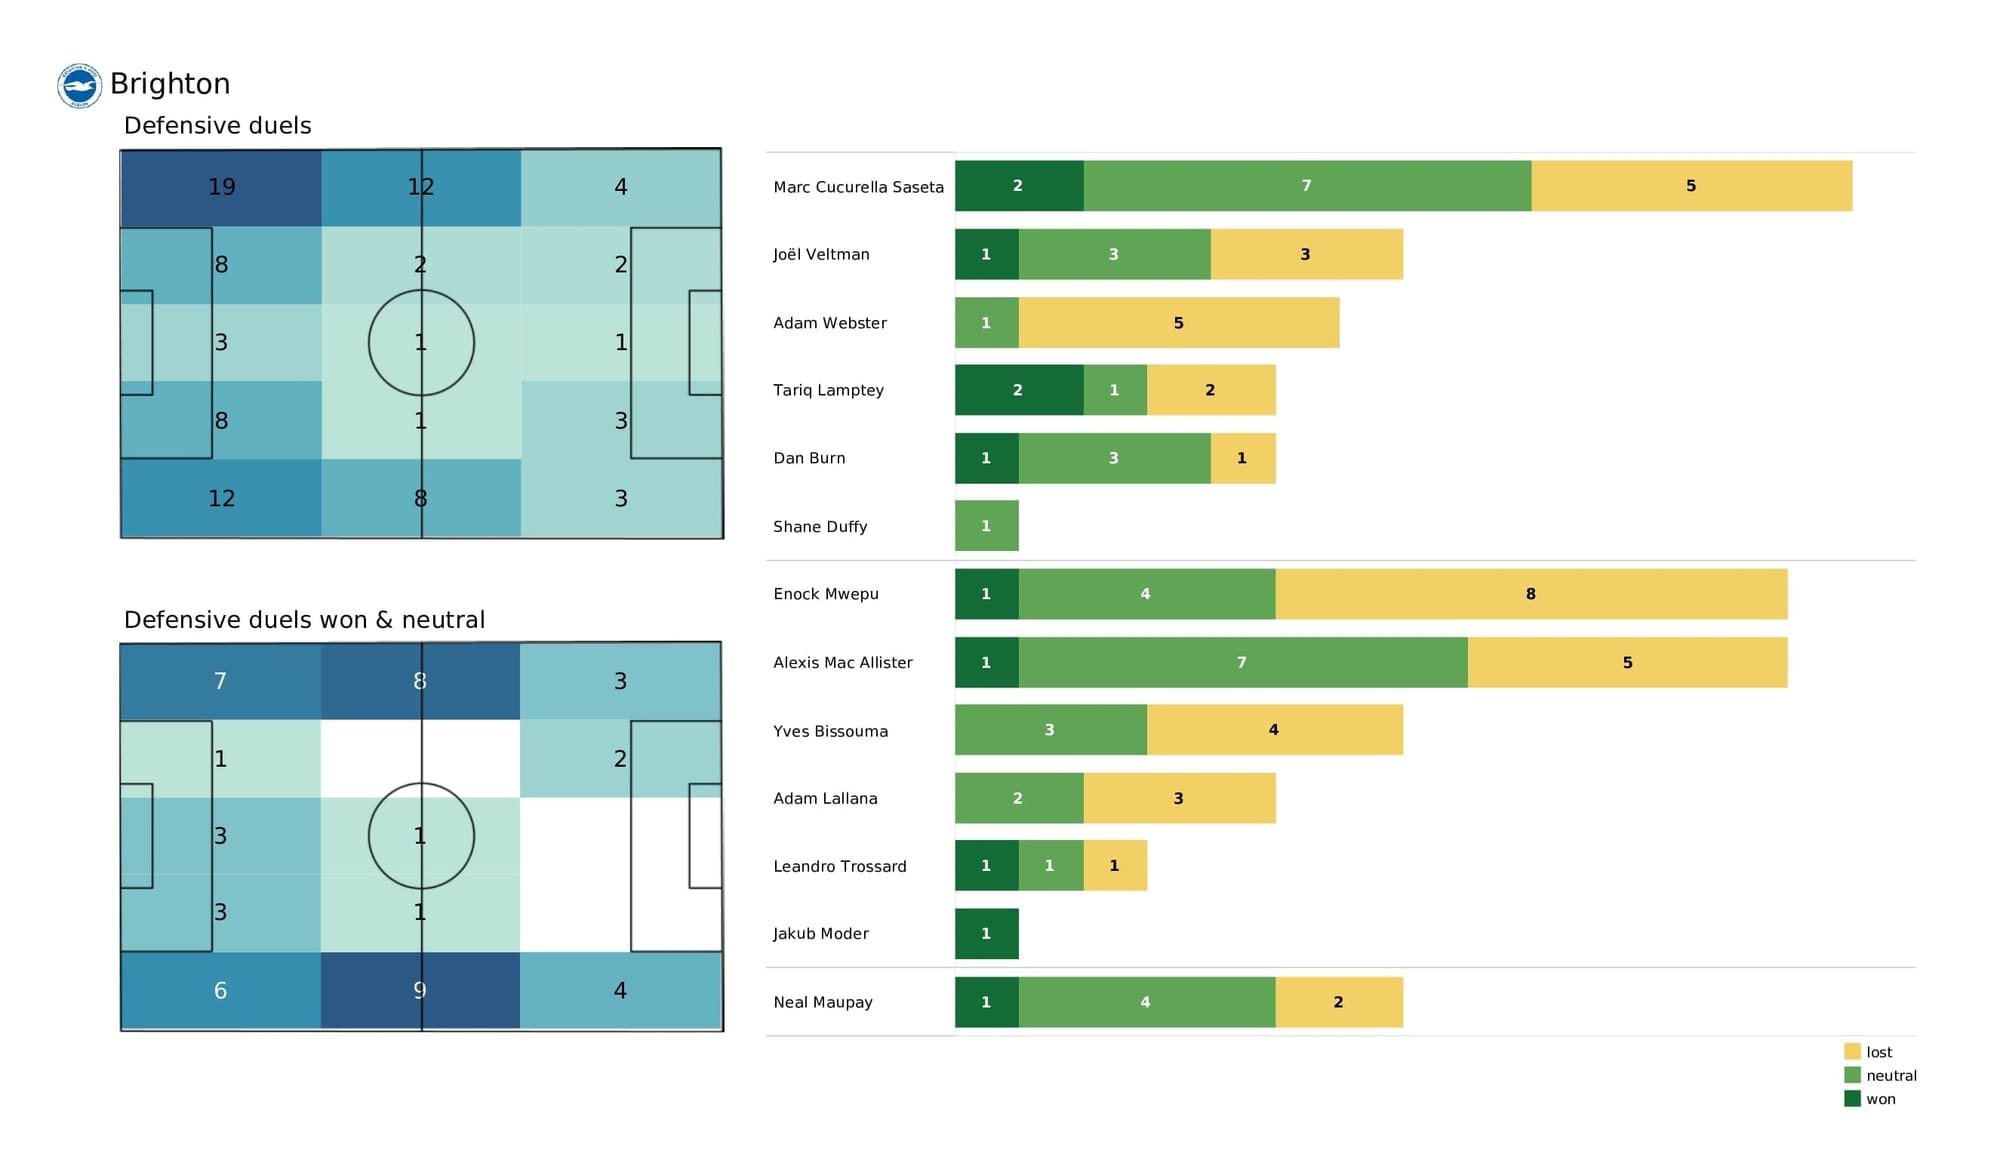
* defensive duels
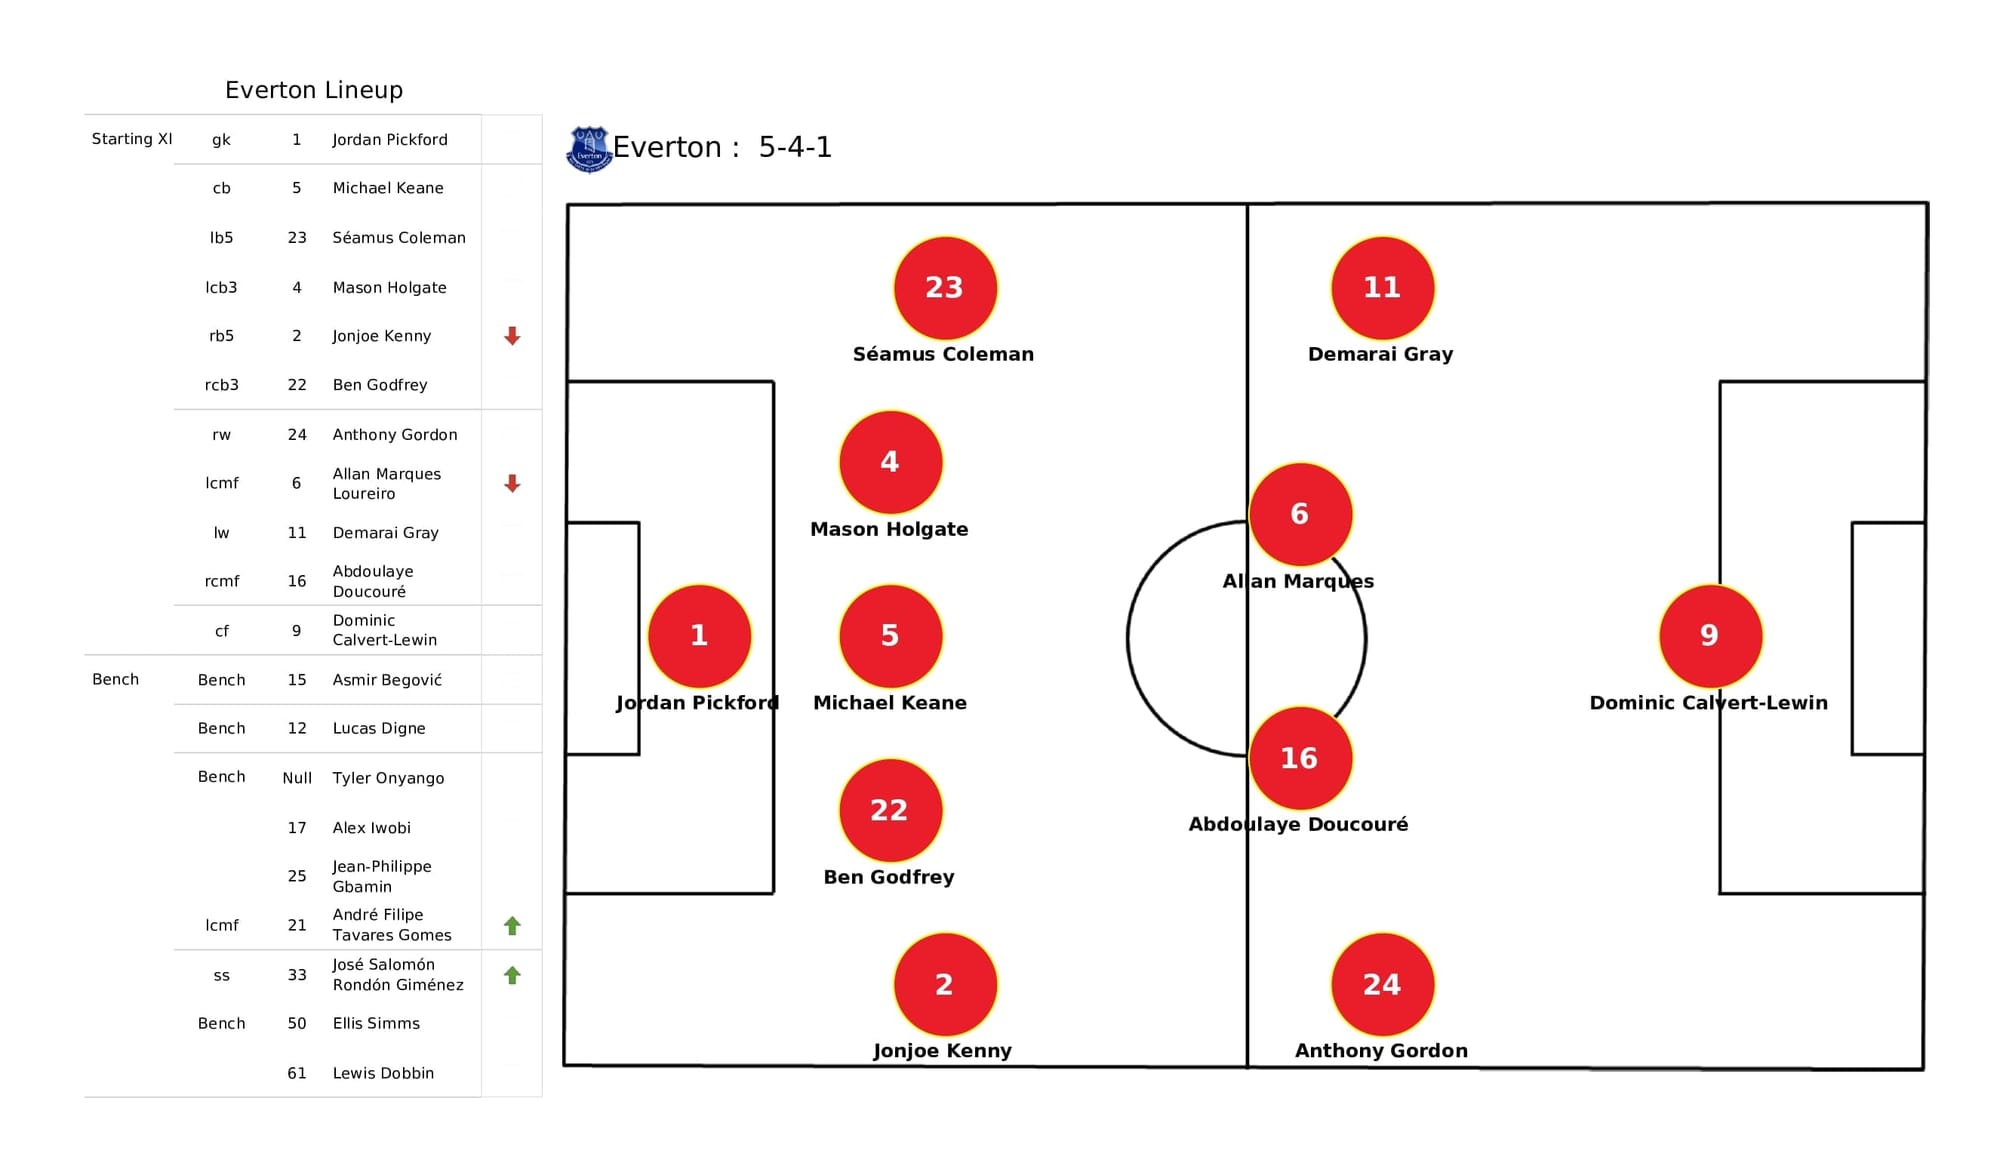
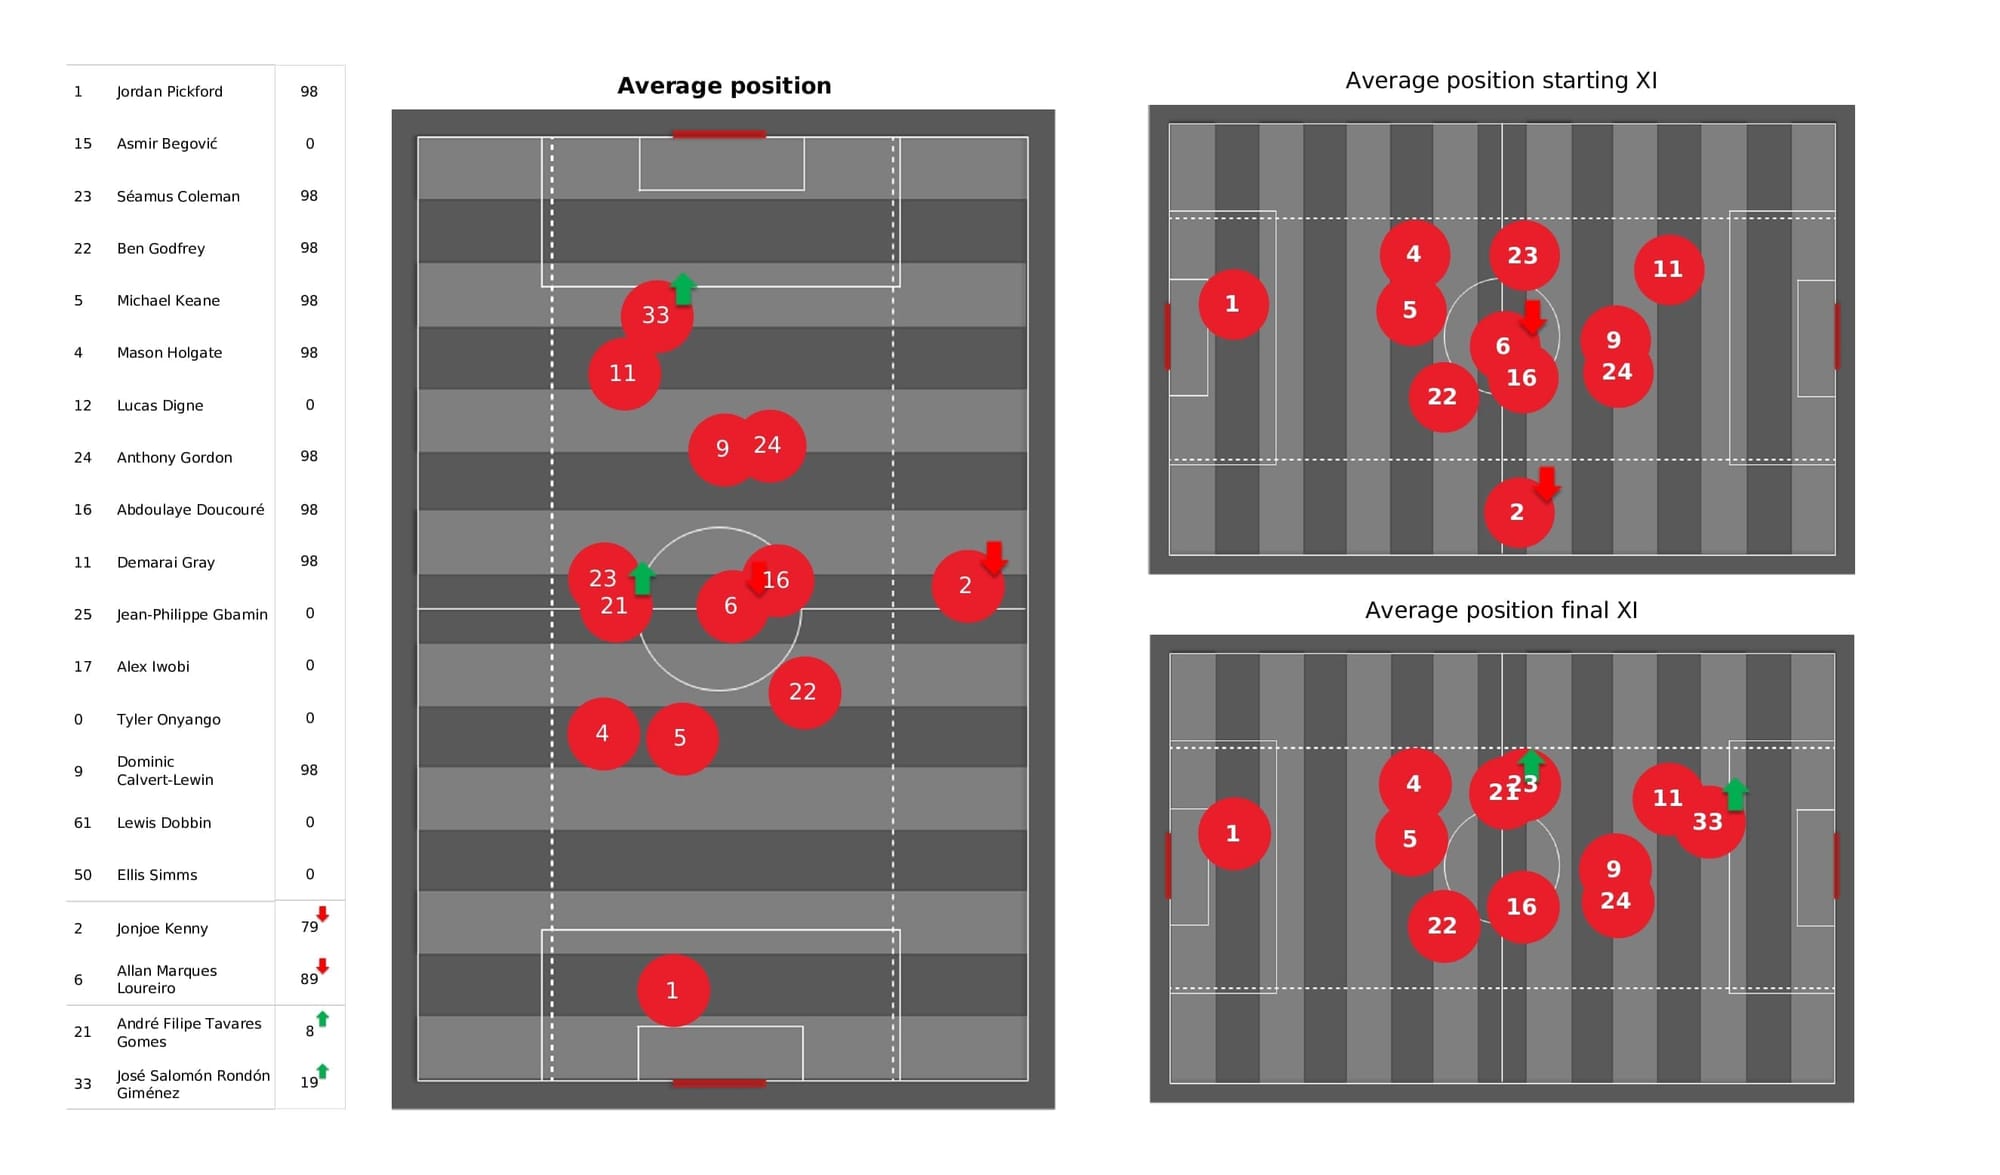
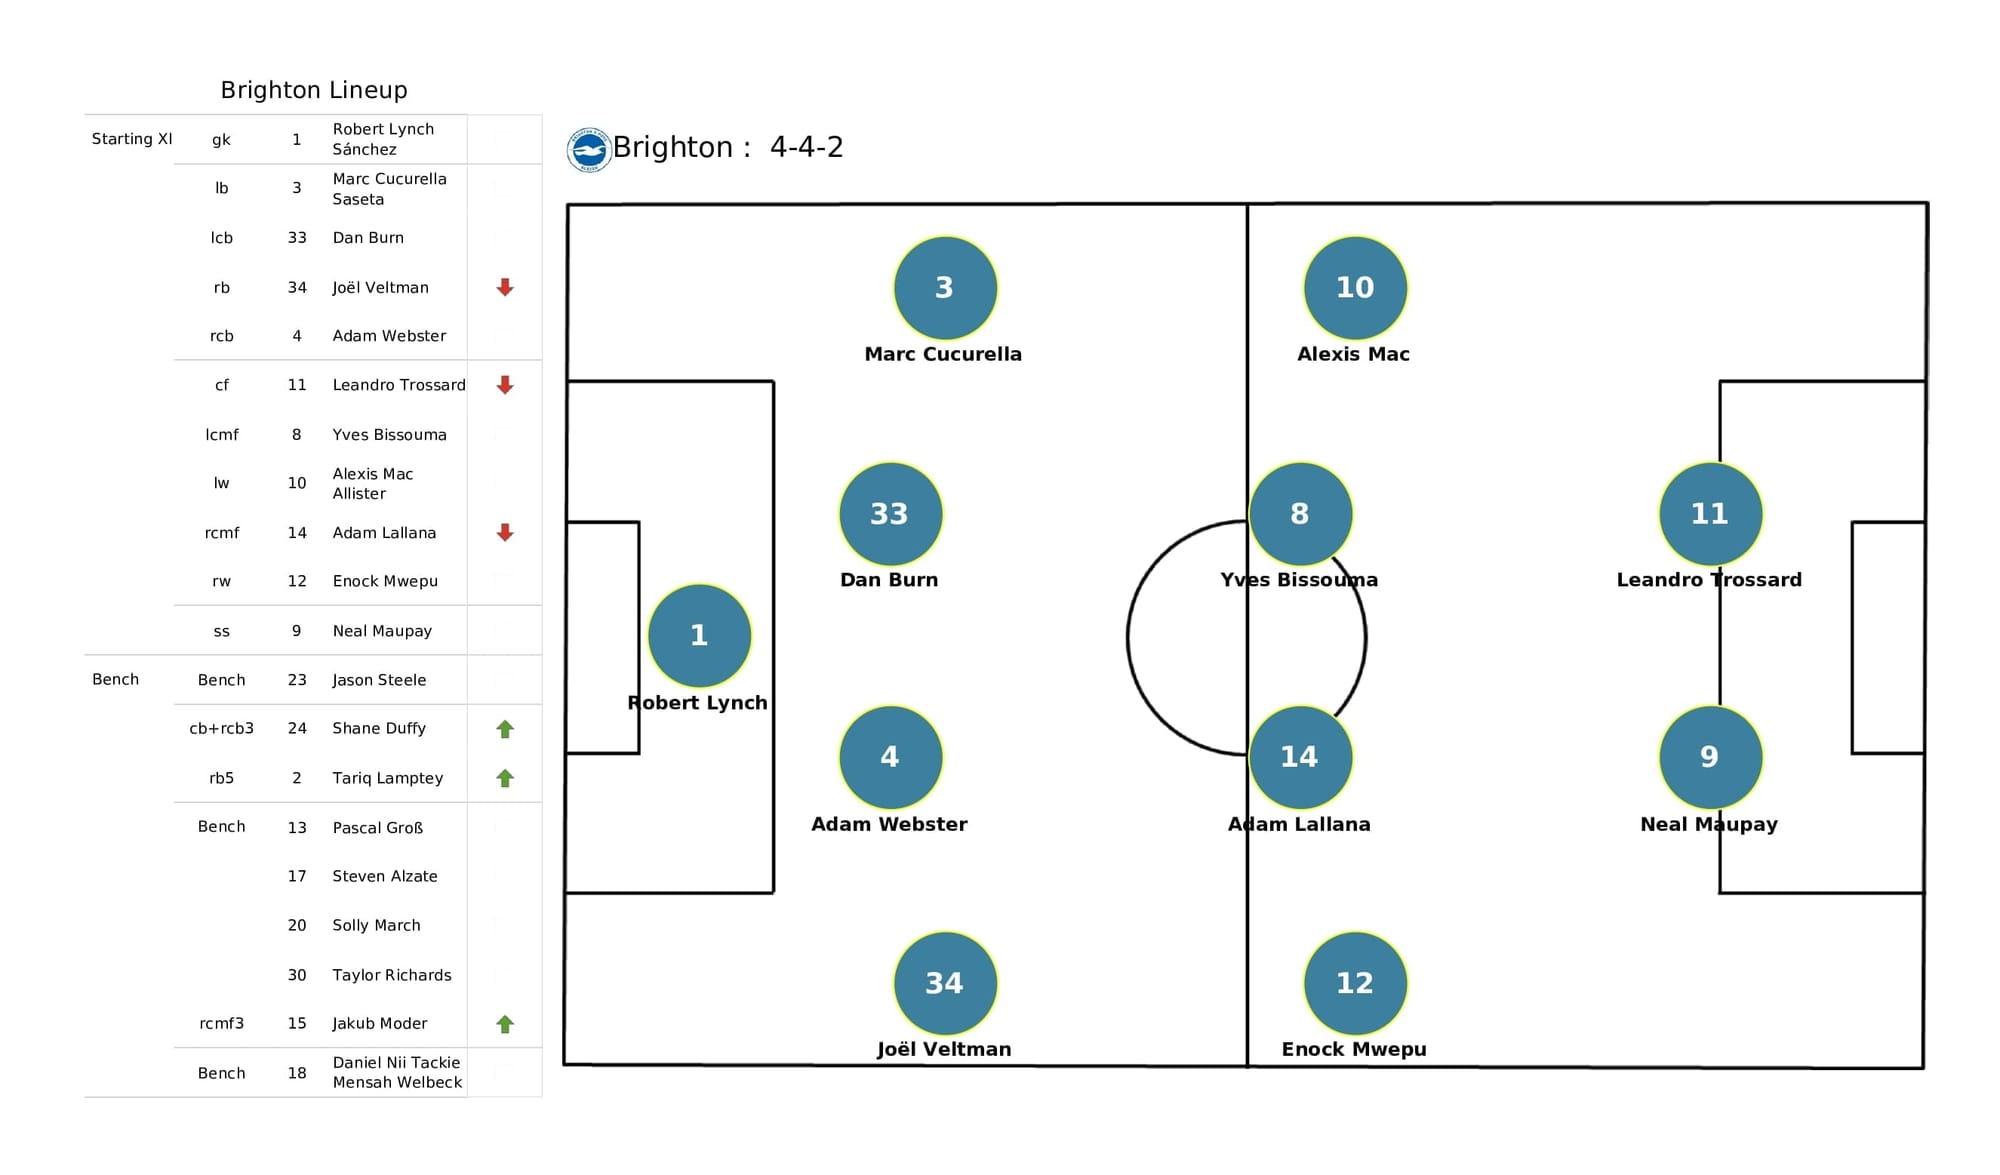
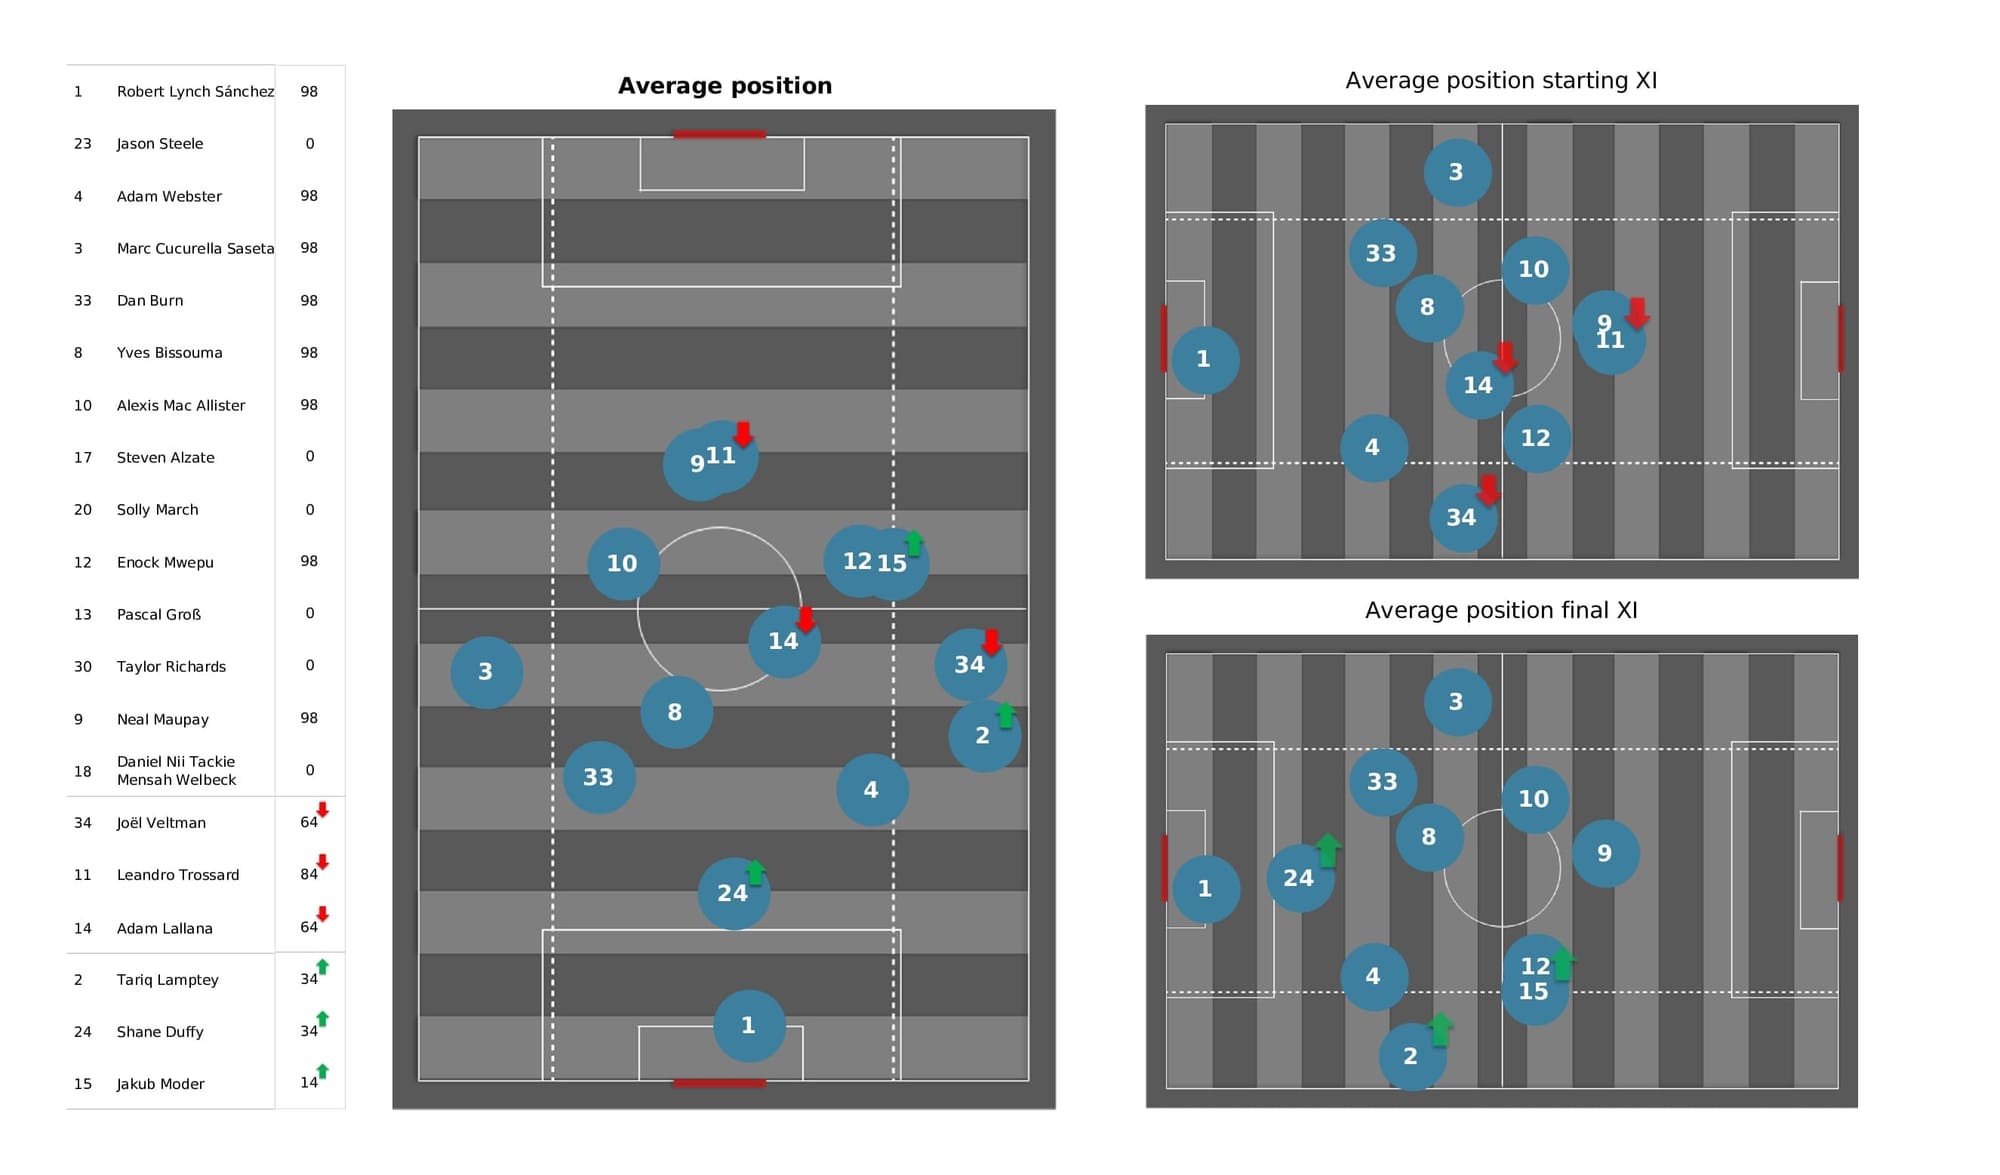
* average positions and much more!
We also try to answer some questions for you with the visuals;
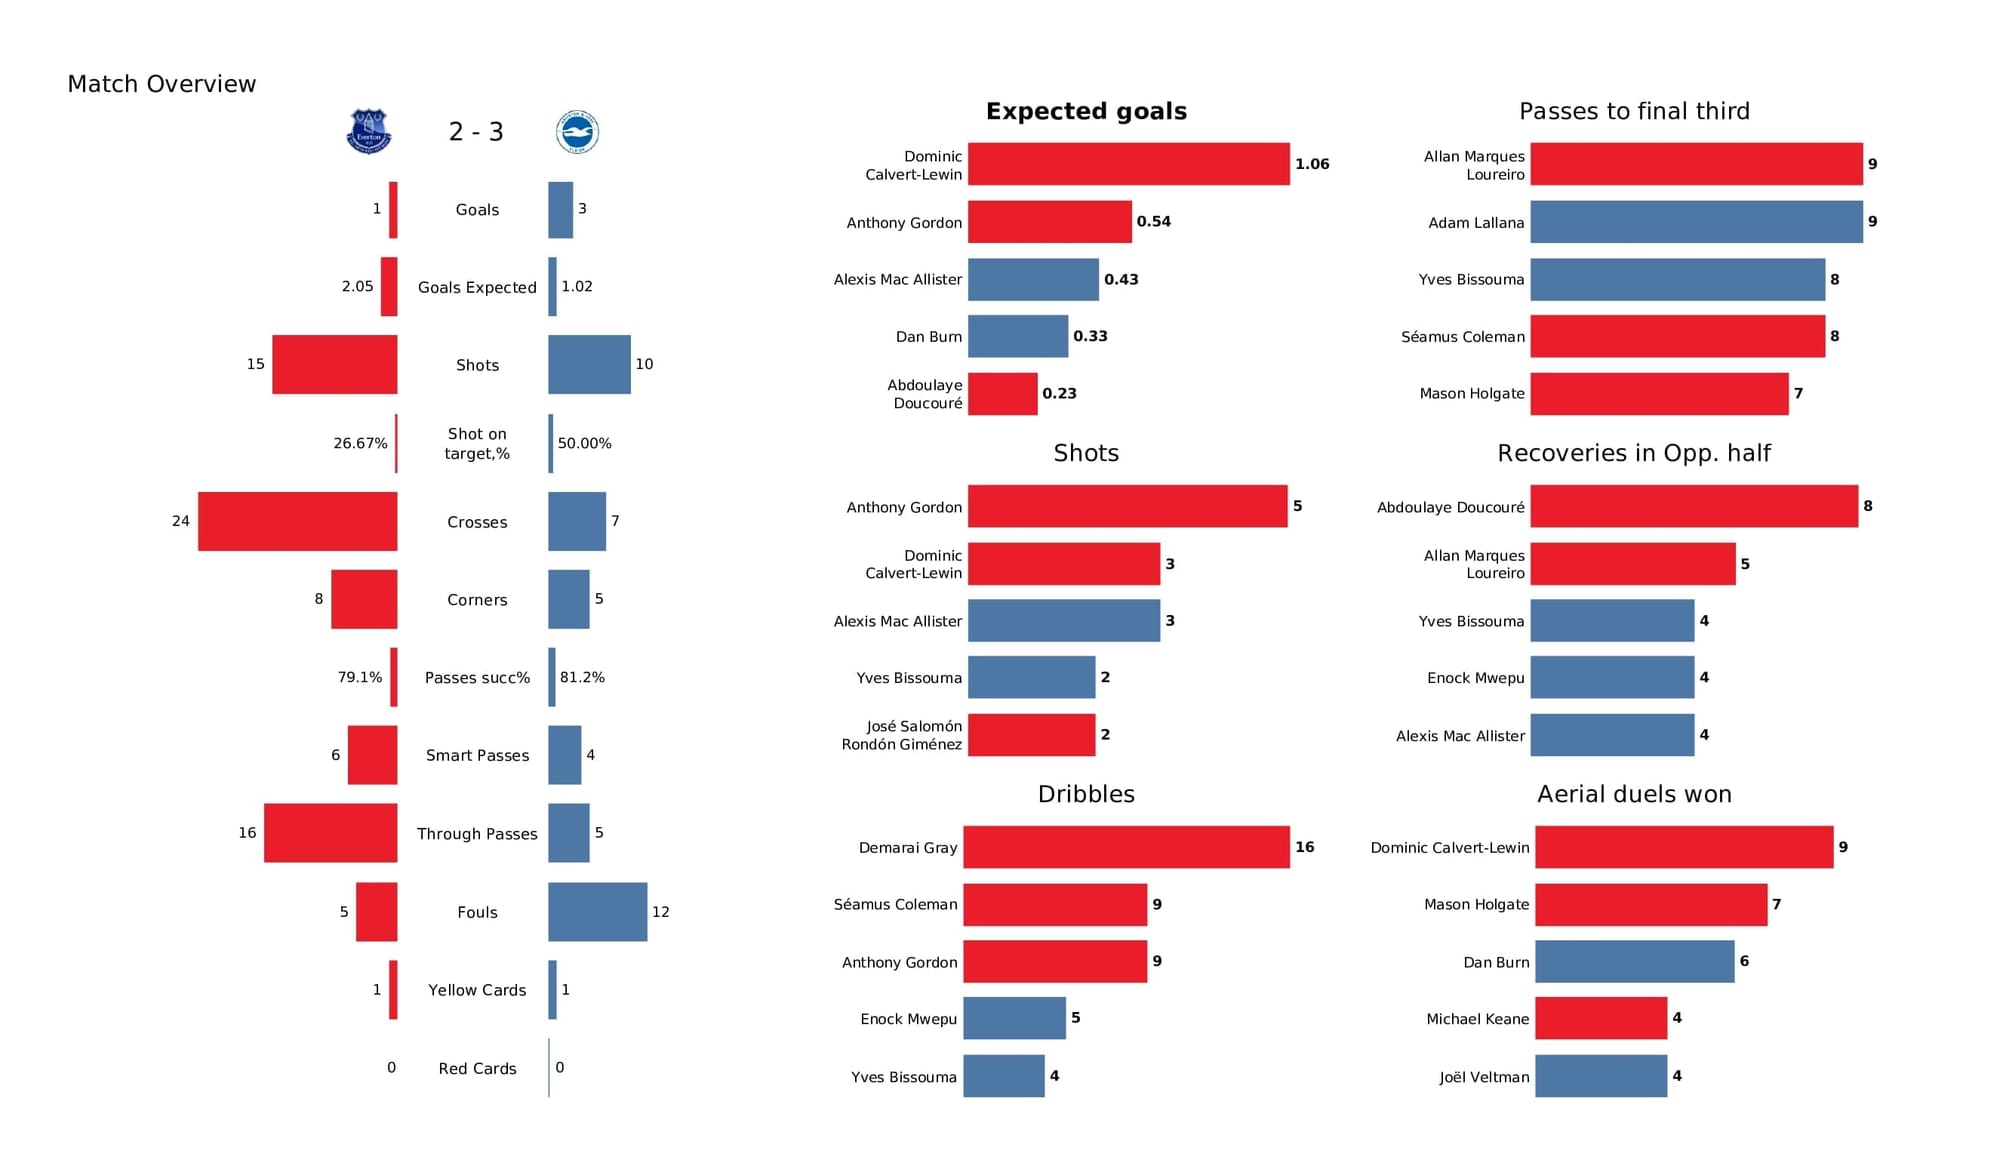
Who was Brighton’s biggest threat? Who made the most recoveries in the opposition half? Who had the highest xG in the match?
To navigate the stats gallery simply click on the numbers to move through the pages.
Don’t forget, if you take out a free membership to Total Football Analysis, you can receive our weekly Premier League Analytics Pack free of charge which includes all the analytics from every match, team benchmarking tables and player benchmarking tables – well over 150 pages of information after every matchweek is complete!

Comments