Raphael Guerreiro is a well known name in European football, the Portuguese wing-back completed a move from FC Lorient to Borussia Dortmund in 2016 and since then has showed both consistency and improvement. Guerreiro has played a big part in Dortmund’s strategy and success, performing at the highest level in different roles, he is involved in a lot of different moments of the game and that often makes for an interesting statistical profile.
In this data analysis we will use statistics to analyse Raphael Guerreiro’s output, as well as compare him to other players from his main position in the European top divisions. Data should allow us to see the difference between his statistical profile and the other players, reflecting Guerreiro’s versatility and ability to fulfil different roles.
Methodology
For this data analysis our data pool will be all full-backs and wing-backs from the top 5 European leagues since those are Raphael Guerreiro’s main positions. Data was filtered to show players with at least 600 minutes played this season in order to make the analysis a more realistic one, leaving us with a data pool of 351 players.
Comparing Raphael Guerreiro with the mentioned pool of players will allow us to build his statistical profile as well as to see the impact his versatility has on his statistical output. We will analyse key metrics for the mentioned positions that reflect the modern role of a full-back and wing-back, covering defending, ball progression, passing, chance creation and goal contribution.
Player Profile
Raphael Guerreiro is a 26 year-old Portuguese left-back that also plays as a wing-back or midfielder on the left side. Like it was already mentioned, he is a very versatile player that can play in different positions but also interpret and perform in different roles within the same position. In the 2019/2020 season he mostly played as a left wing-back in Dortmund’s 3-4-3 system, although early in the season he played as a full back due to Favre’s tactics. In the image below we can see Raphael Guerreiro’s heat map for this season, it highlights the areas of the pitch where he has the most actions therefore showing us the spaces where he mostly operates.
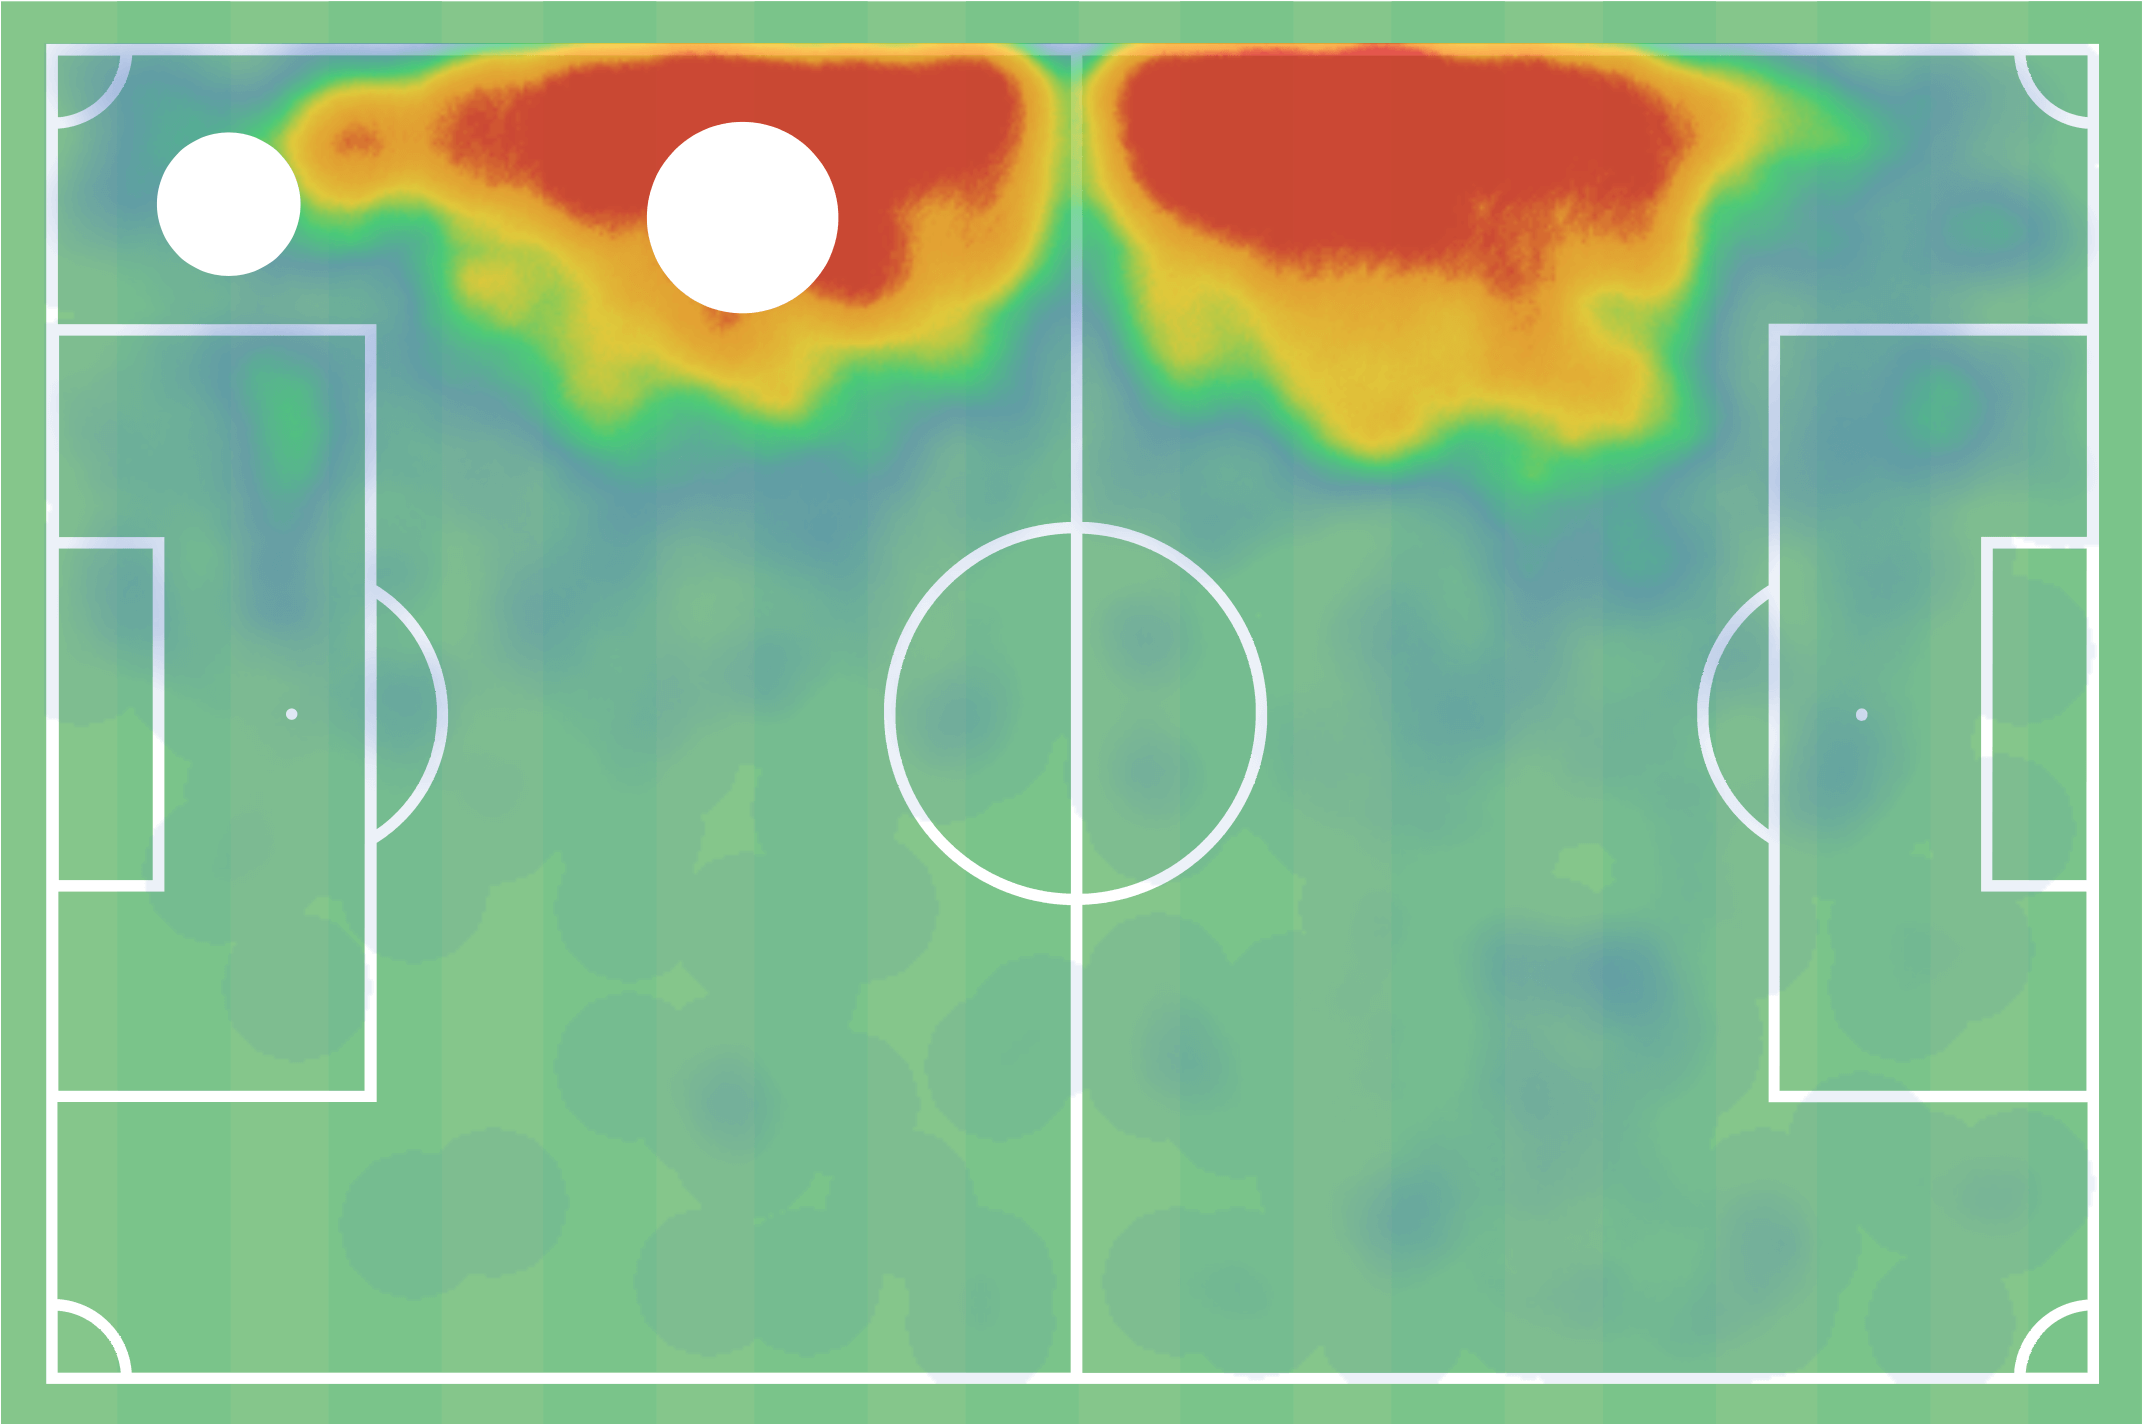
The concentration of actions on the left side of the pitch shown by the heat map above is nothing surprising as it perfectly corresponds to Guerreiro’s main positions. The spread of the heat between the two halves if the pitch also reflects both Guerreiro’s positions and roles showing how he is capable of taking responsibility for the left side of the pitch.
Raphael Guerreiro is a player that shows great technique in pretty much all dimensions, passing, shooting, ball control and crossing are all things he is able to execute very well. Apart from the technical side, Guerreiro is also an intelligent player capable of reading the game and acting accordingly and that is of great importance both defensively and in attack. On the physical side, Raphael is not the strongest or tallest of players but he has good balance, agility, and decent speed both with and without the ball.
We will now analyse different metrics that cover different aspects of the game to determine Guerreiro’s statical profile and compare him with other players form the top 5 European leagues that play in the same positions as him.
Defending
Starting with the defensive metrics, this next scatter plot measures three key metrics to evaluate a player’s defensive output: percentage of defensive duels won, percentage of aerial duels won, and PAdj interceptions. Possession adjusted metrics are is an attempt to attenuate the differences in defensive stats seen between players in teams with more and less possession of the ball.
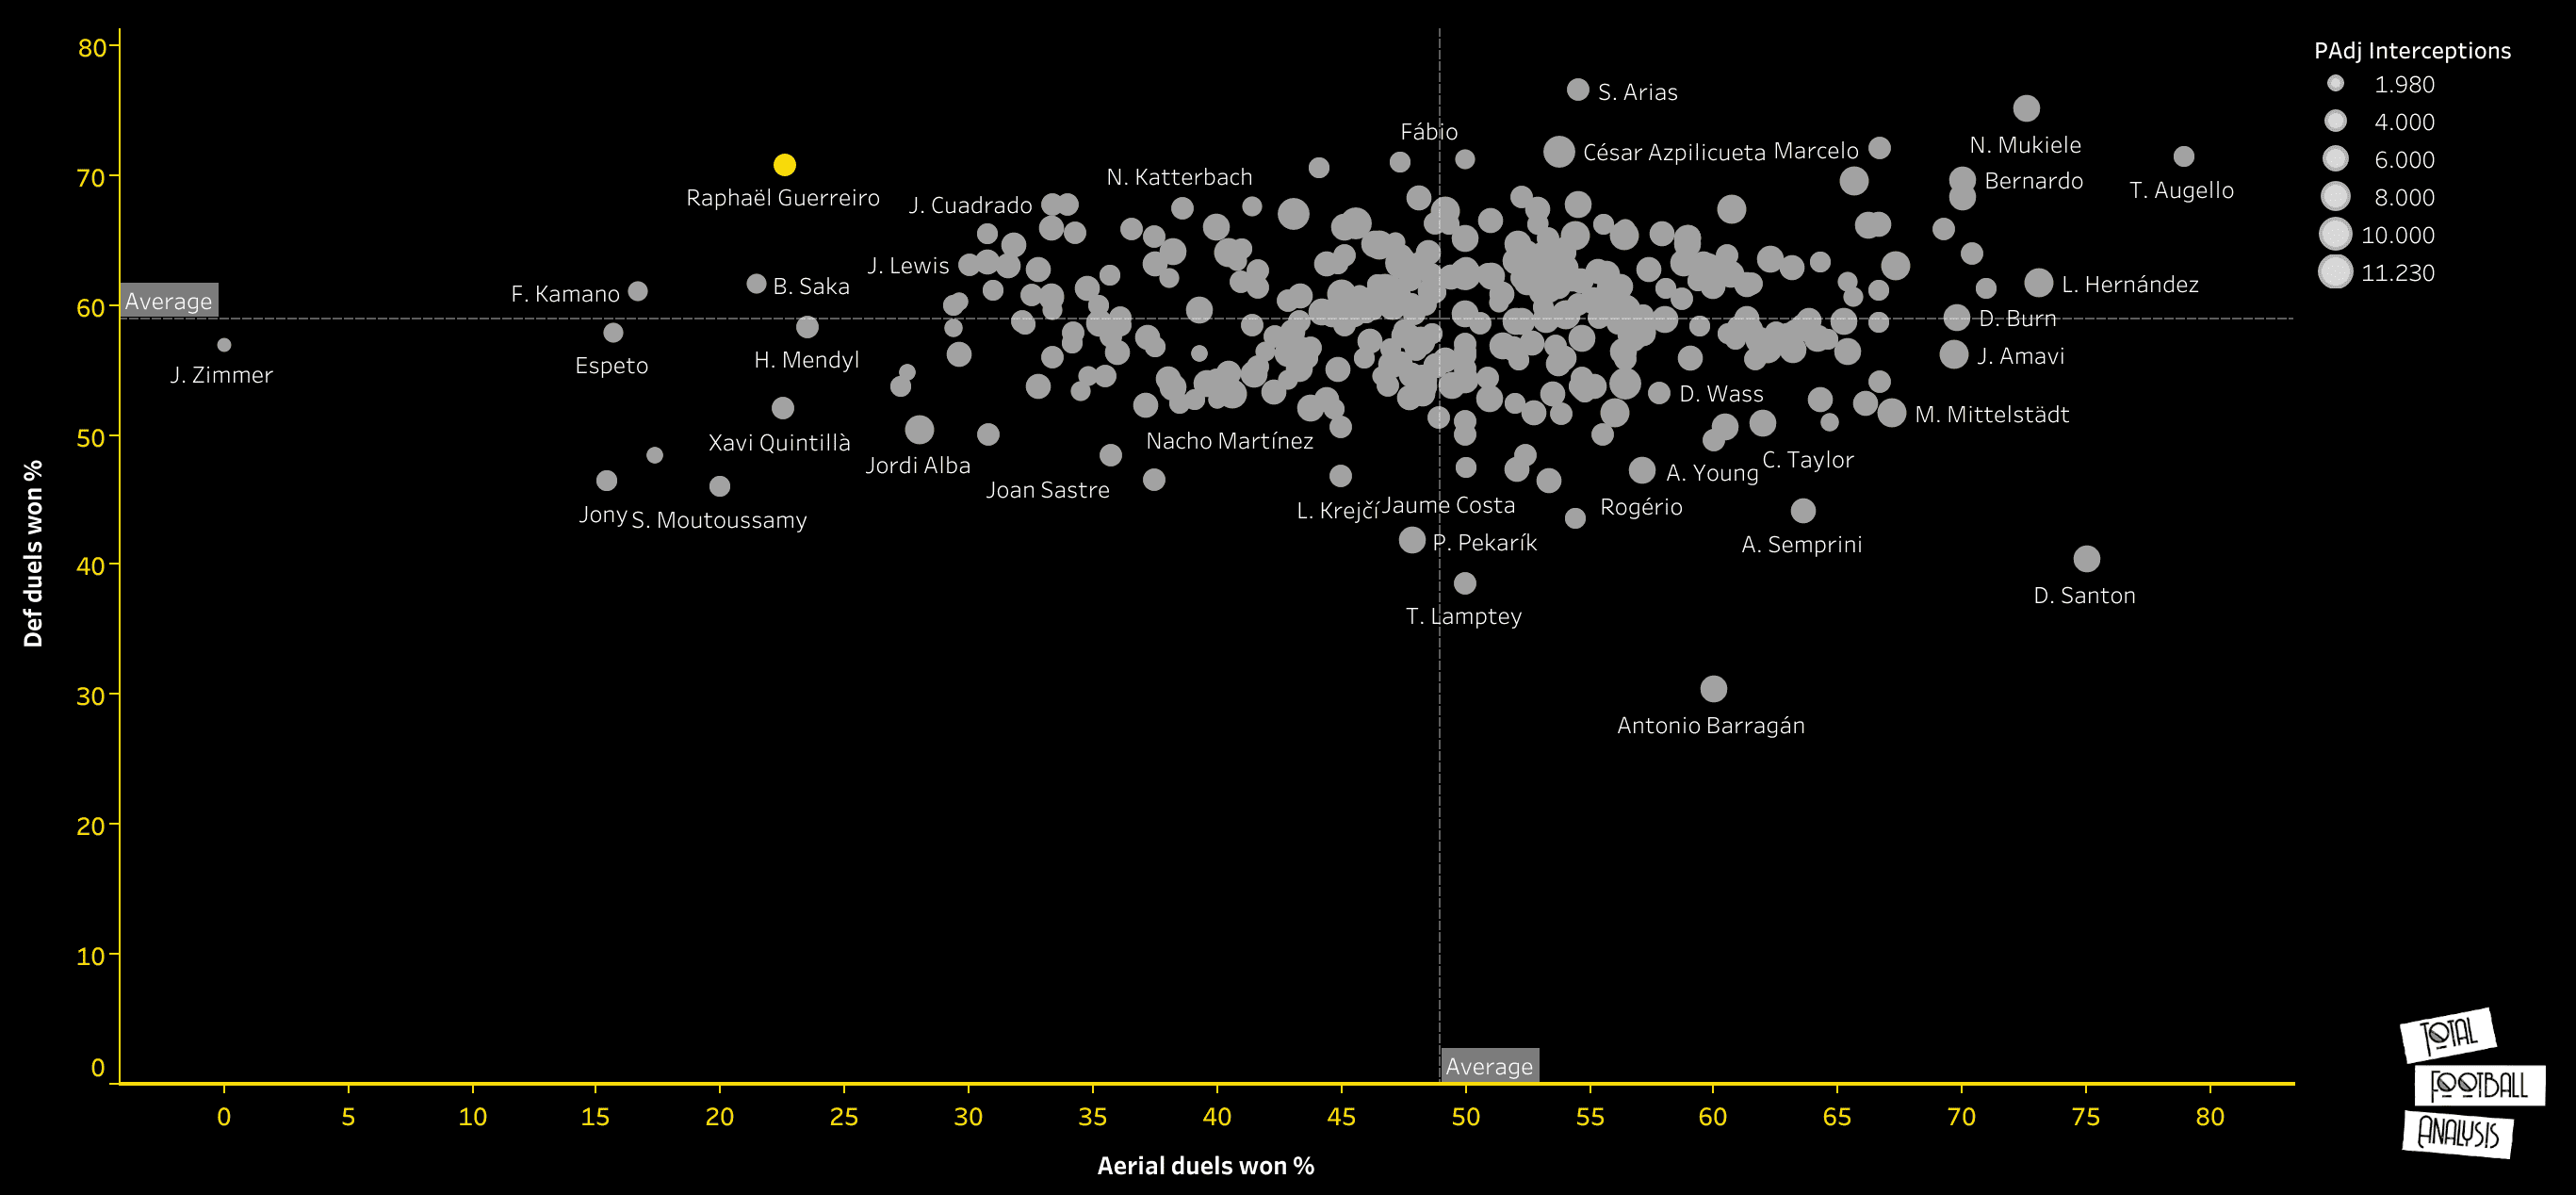
An analysis of this first scatter plot shows us one strong point of Raphael Guerreiro’s game but also one of his weaknesses. Looking at the graphic we can see how Raphael Guerreiro ranks well above average when it comes to defensive duels won with a win rate of 70.80%. This shows Guerreiro is strong in defensive duels and able to tackle opponents quite often, in fact, in the entire data pool, only 7 players have a higher win rate when it comes to defensive duels with Santiago Arias from Atletico Madrid ranking first in this metric with 76.54%. Looking at PAdj interceptions, Guerreiro’s numbers are not as impressive but they are definitely not bad. With an average of 5.61 PAdj interceptions per 90, Guerreiro falls just below the average of 6, a number that shows he can improve but also that reflects the offensive nature of his usual role.
Finally, looking at the percentage of aerial duels won, we can easily spot that this is the aspect where Raphael Guerreiro has less success. At 1,70m Guerreiro is not very tall and that certainly has a big influence on his low win rate when it comes to aerial duels, falling well below the average, Guerreiro only wins 22.58% of his aerial duels.
Knowing Guerreiro’s defensive output, we will now look at a map that shows us the areas of the pitch where he mostly recovers the ball. This will allow us to have a better understanding of his defensive behaviour as well as to know which are the ways Guerreiro recovers the ball more often.
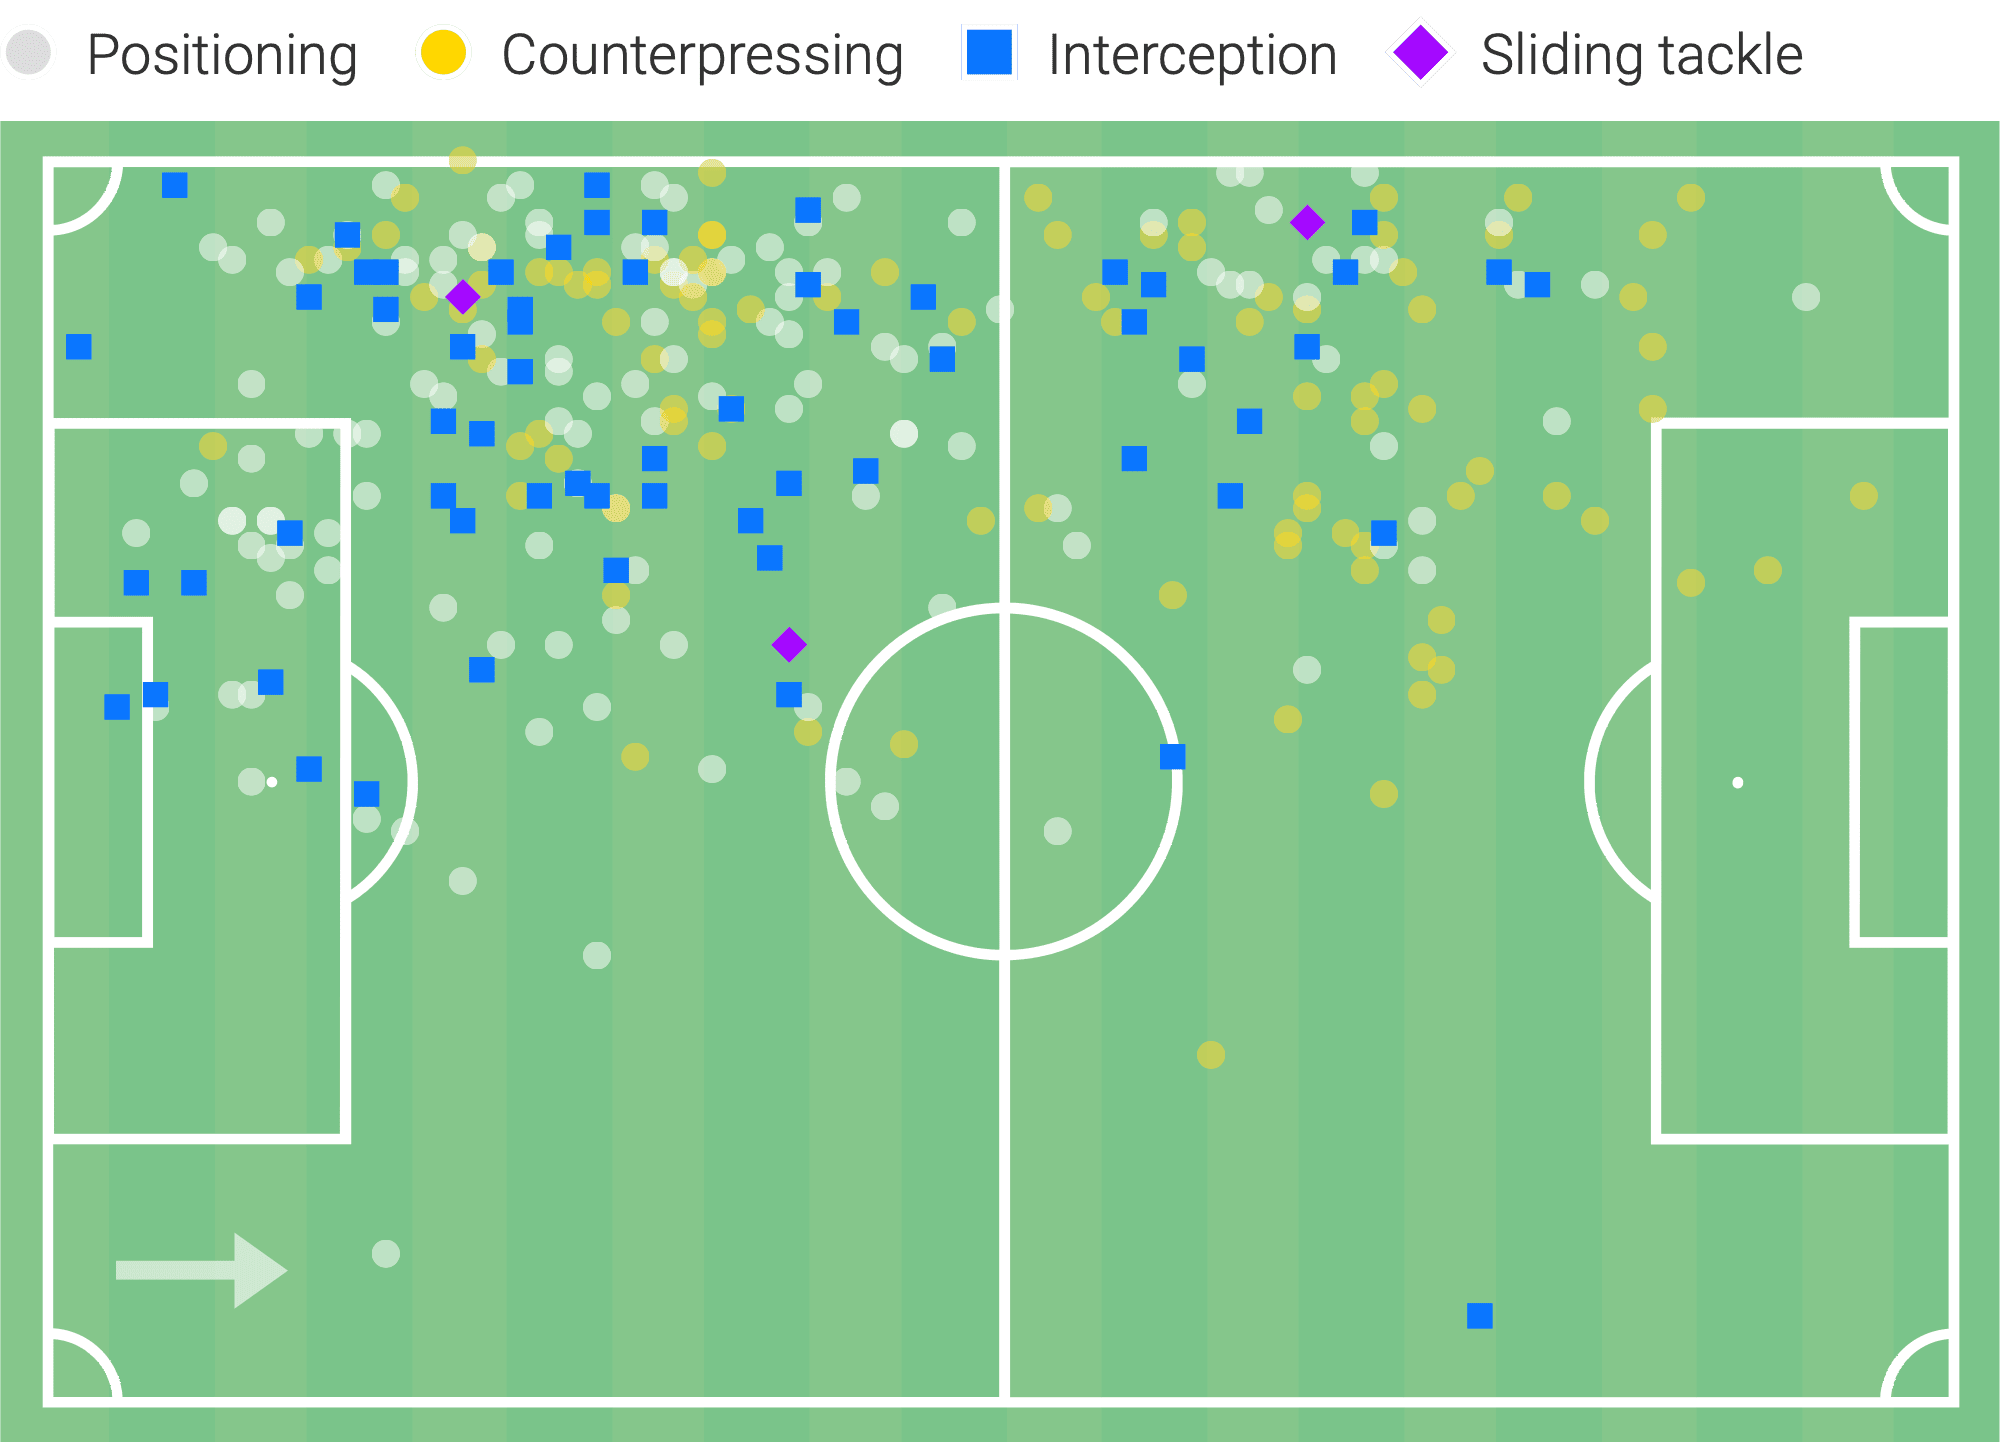
Looking at the map above we naturally see that most of Guerreiro’s ball recoveries are on the left side of the pitch, however, it is interesting to see how high in the pitch the recovery happens and what type of recovery it is. Guerreiro gets the ball back both in his half and in the opposition’s half, in the latter case however, most of his recoveries are through counter-pressing and that reflects Dortmund’s style of play and desire to win the ball back as high and as soon as possible when they lose it. Being used to play in a high pressing side, Guerreiro is effective with his pressing and, the already mentioned ability to win duels also allows him to recover the ball more often.
Passing
In this next section we will measure the player’s passing abilities by creating a scatter plot with two metrics: passes per 90 and passing accuracy%. These metrics will allow us to see which players see more of the ball and execute more passes as well as the ones who that with the better accuracy.
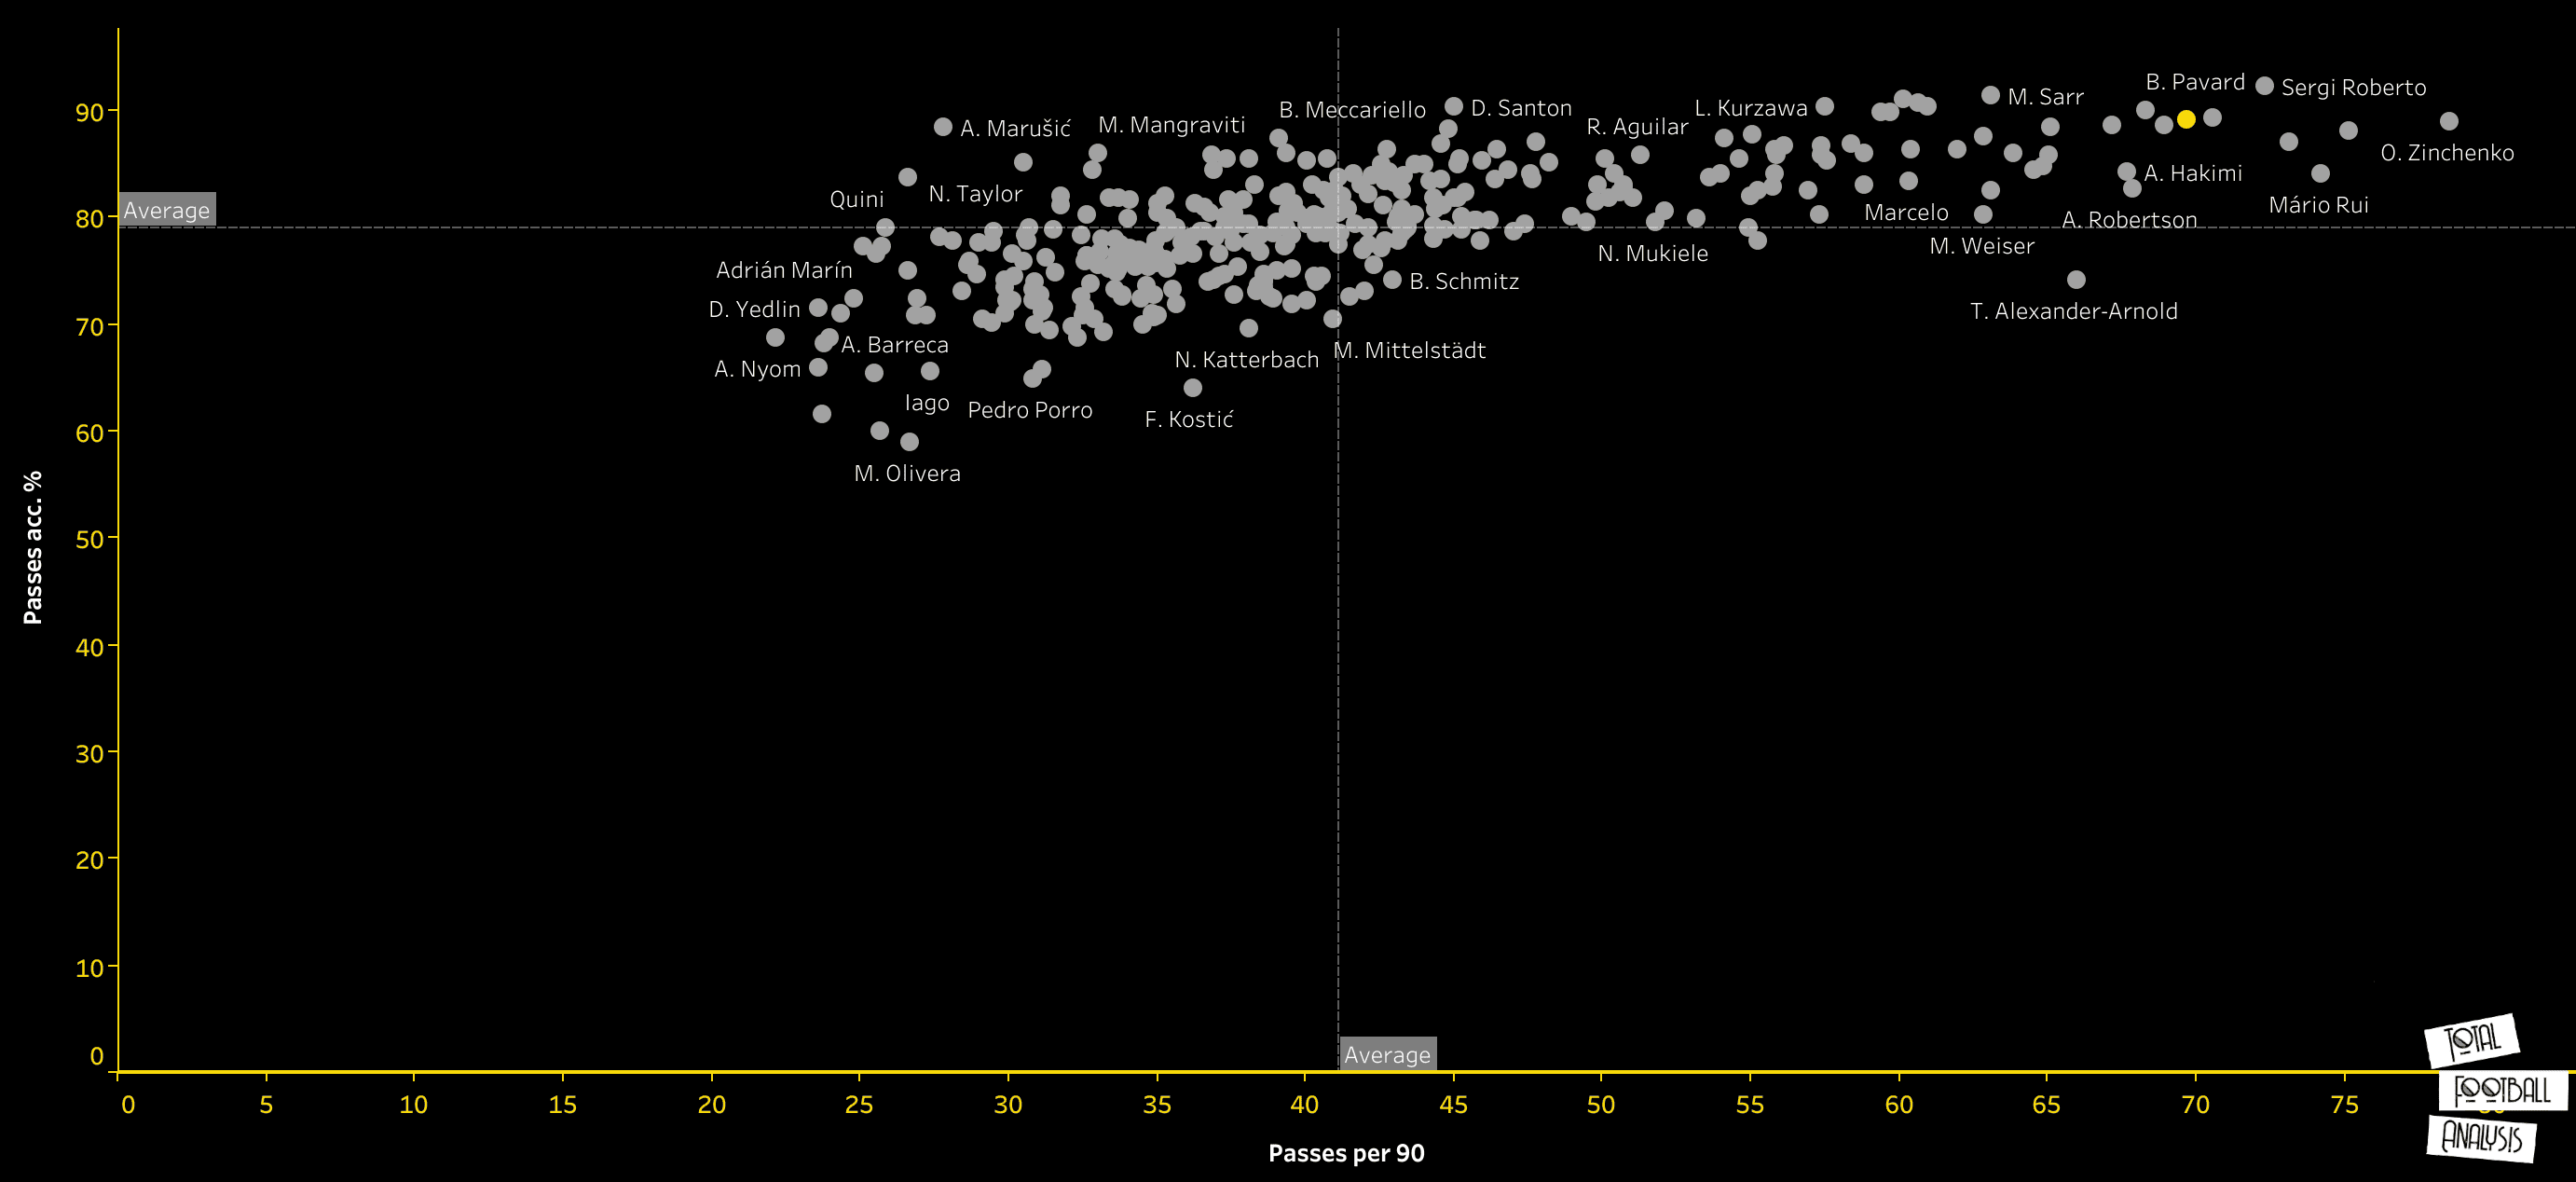
Represented by the yellow dot, Raphael Guerreiro really stands out in the analysed metrics. The Portuguese averages 69.71 passes per 90 with a 89.13% completion rate showing just how involved he is in the team’s build-up play. He appears with a similar profile to João Cancelo and Benjamin Pavard, two players that play in possession-based teams and also participate a lot in ball circulation and build-up play. This is a key aspect of Guerreiro’s game as he is much more involved in passing and positional play as opposed to is fellow wing back from the other side this season Hakimi who is a more vertical and explosive player who likes to receive the ball into space.
Ball progression
In this section we will take a look at the player’s ball progression capabilities by creating a scatter plot with the metrics progressive passes per 90 and progressive runs per 90 on both axes. We will then analyse forward passes per 90 to passes into the final third per 90 ratio to determine the players’ ability to progress the ball directly to the final third and see how often they attempt this type of action.
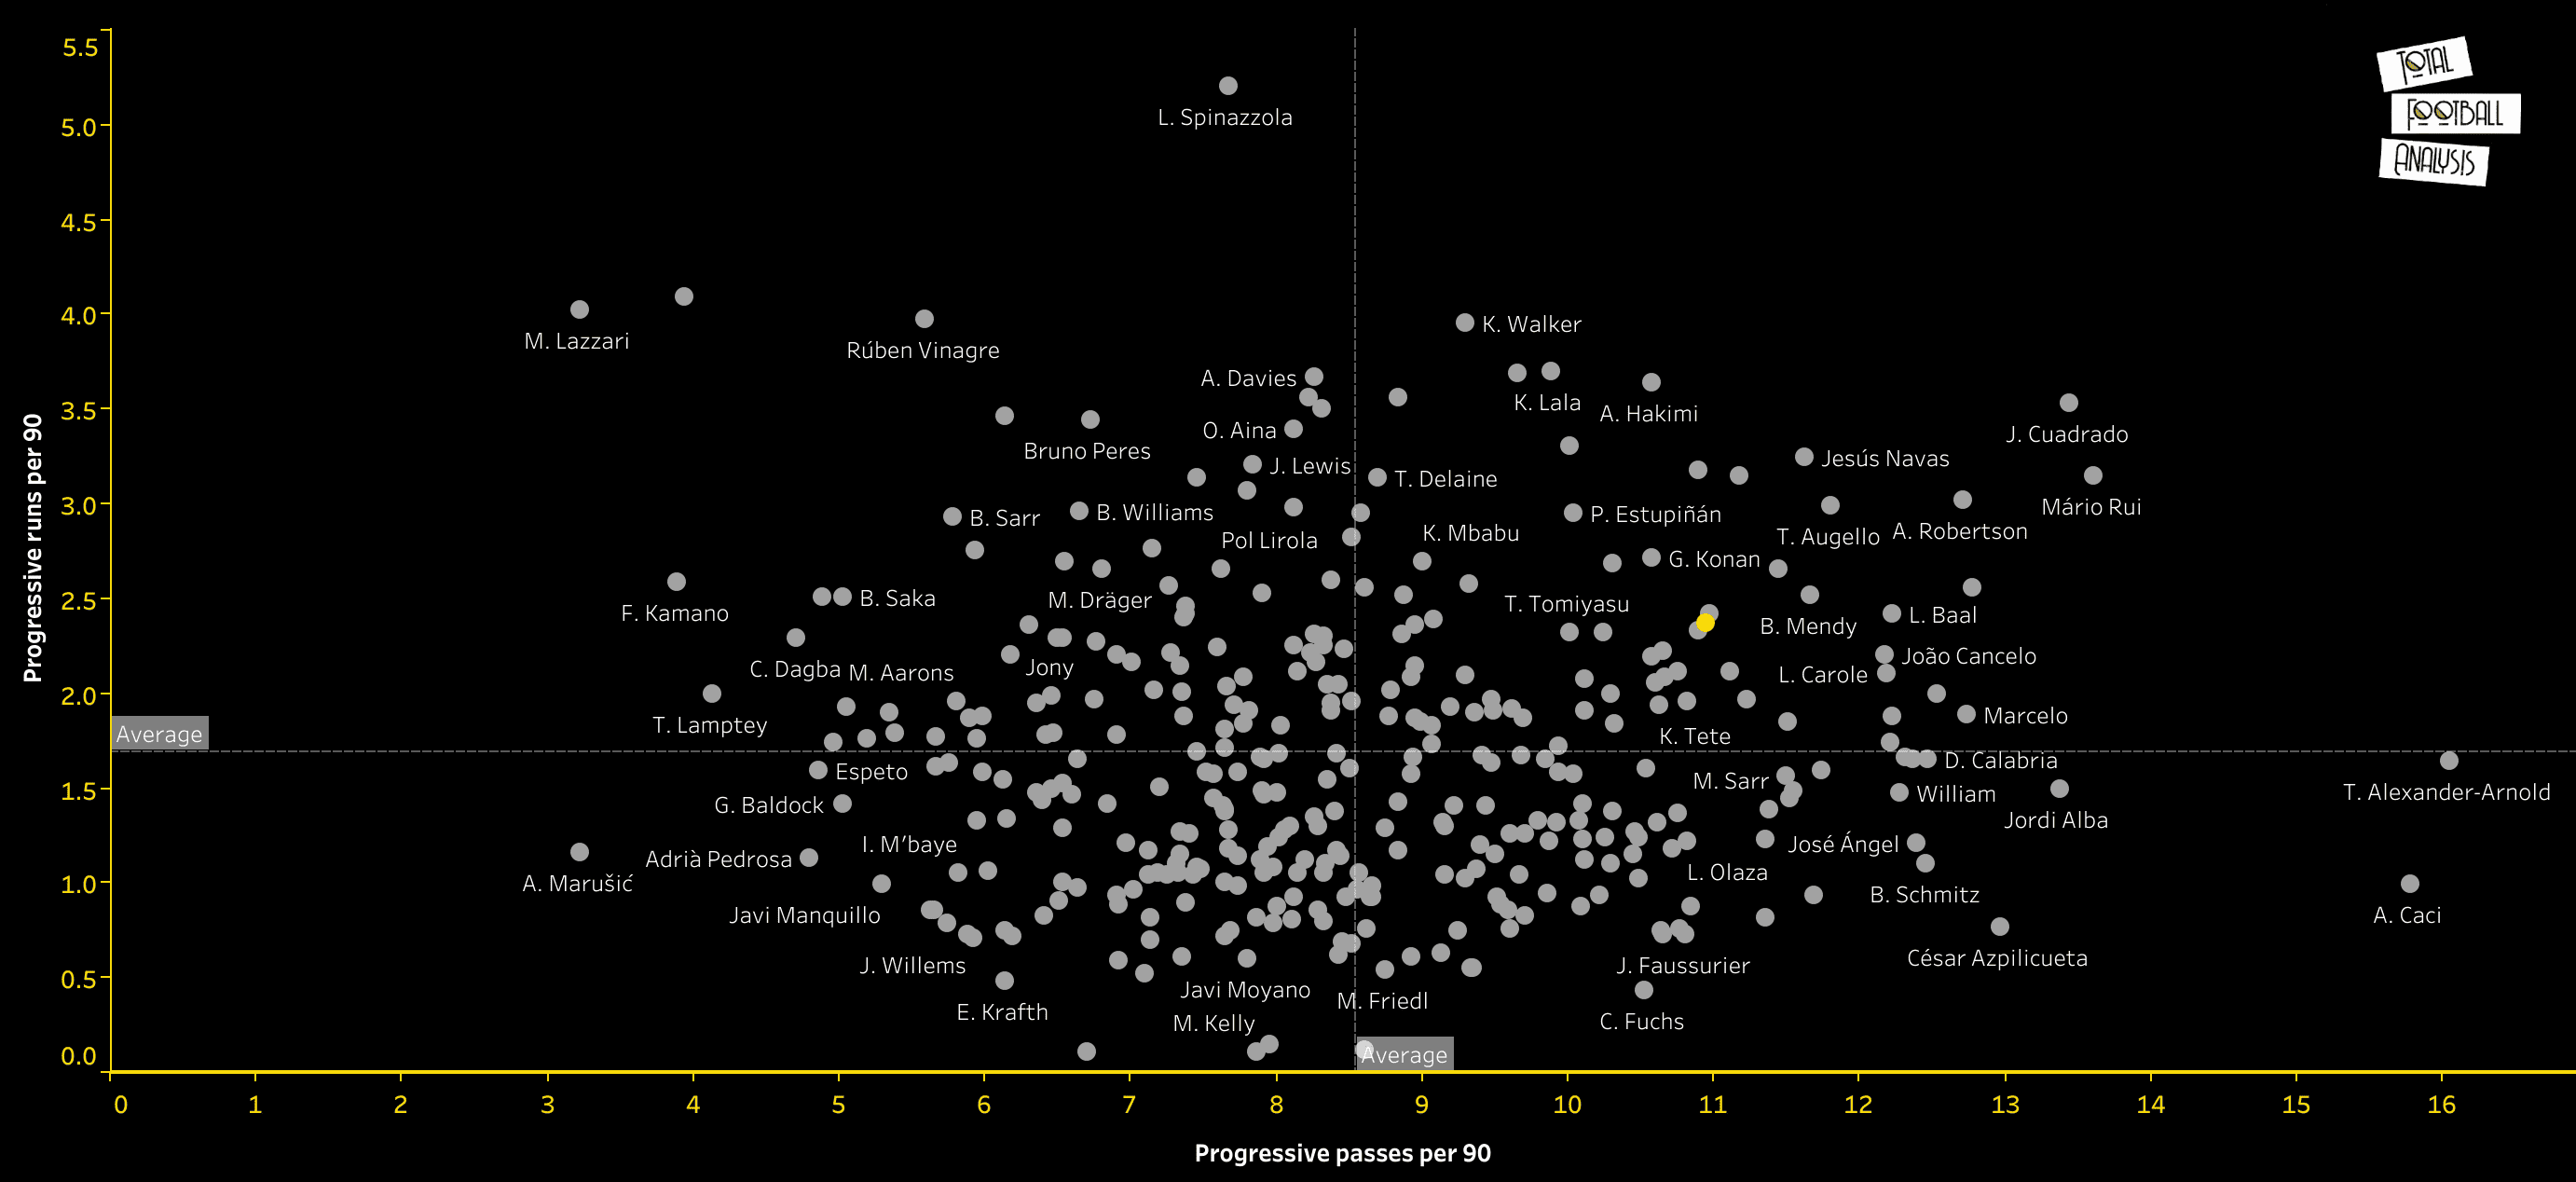
Again represented by the yellow dot, Guerreiro appears in the right upper quadrant of the graphic with numbers above average on both analysed metrics. Starting with progressive passes, Guerreiro averages 10.94 of those per 90 which puts him with similar numbers to Dani Carvajal for example. Although he is not amongst the players with the highest number of progressive passes, his numbers are quite good, and his profile is balanced with an above-average 2.37 progressive runs per 90. This shows that Raphael Guerreiro is able to progress the ball up the pitch both ways and we can see the difference between him and Hakimi once more as the Moroccan averages much more progressive runs per 90 than him (3.64)
The next map shows us the areas of the pitch where Raphael Guerreiro performs his progressive actions the most, allowing us to identify trends related to where he tries to get the ball to.
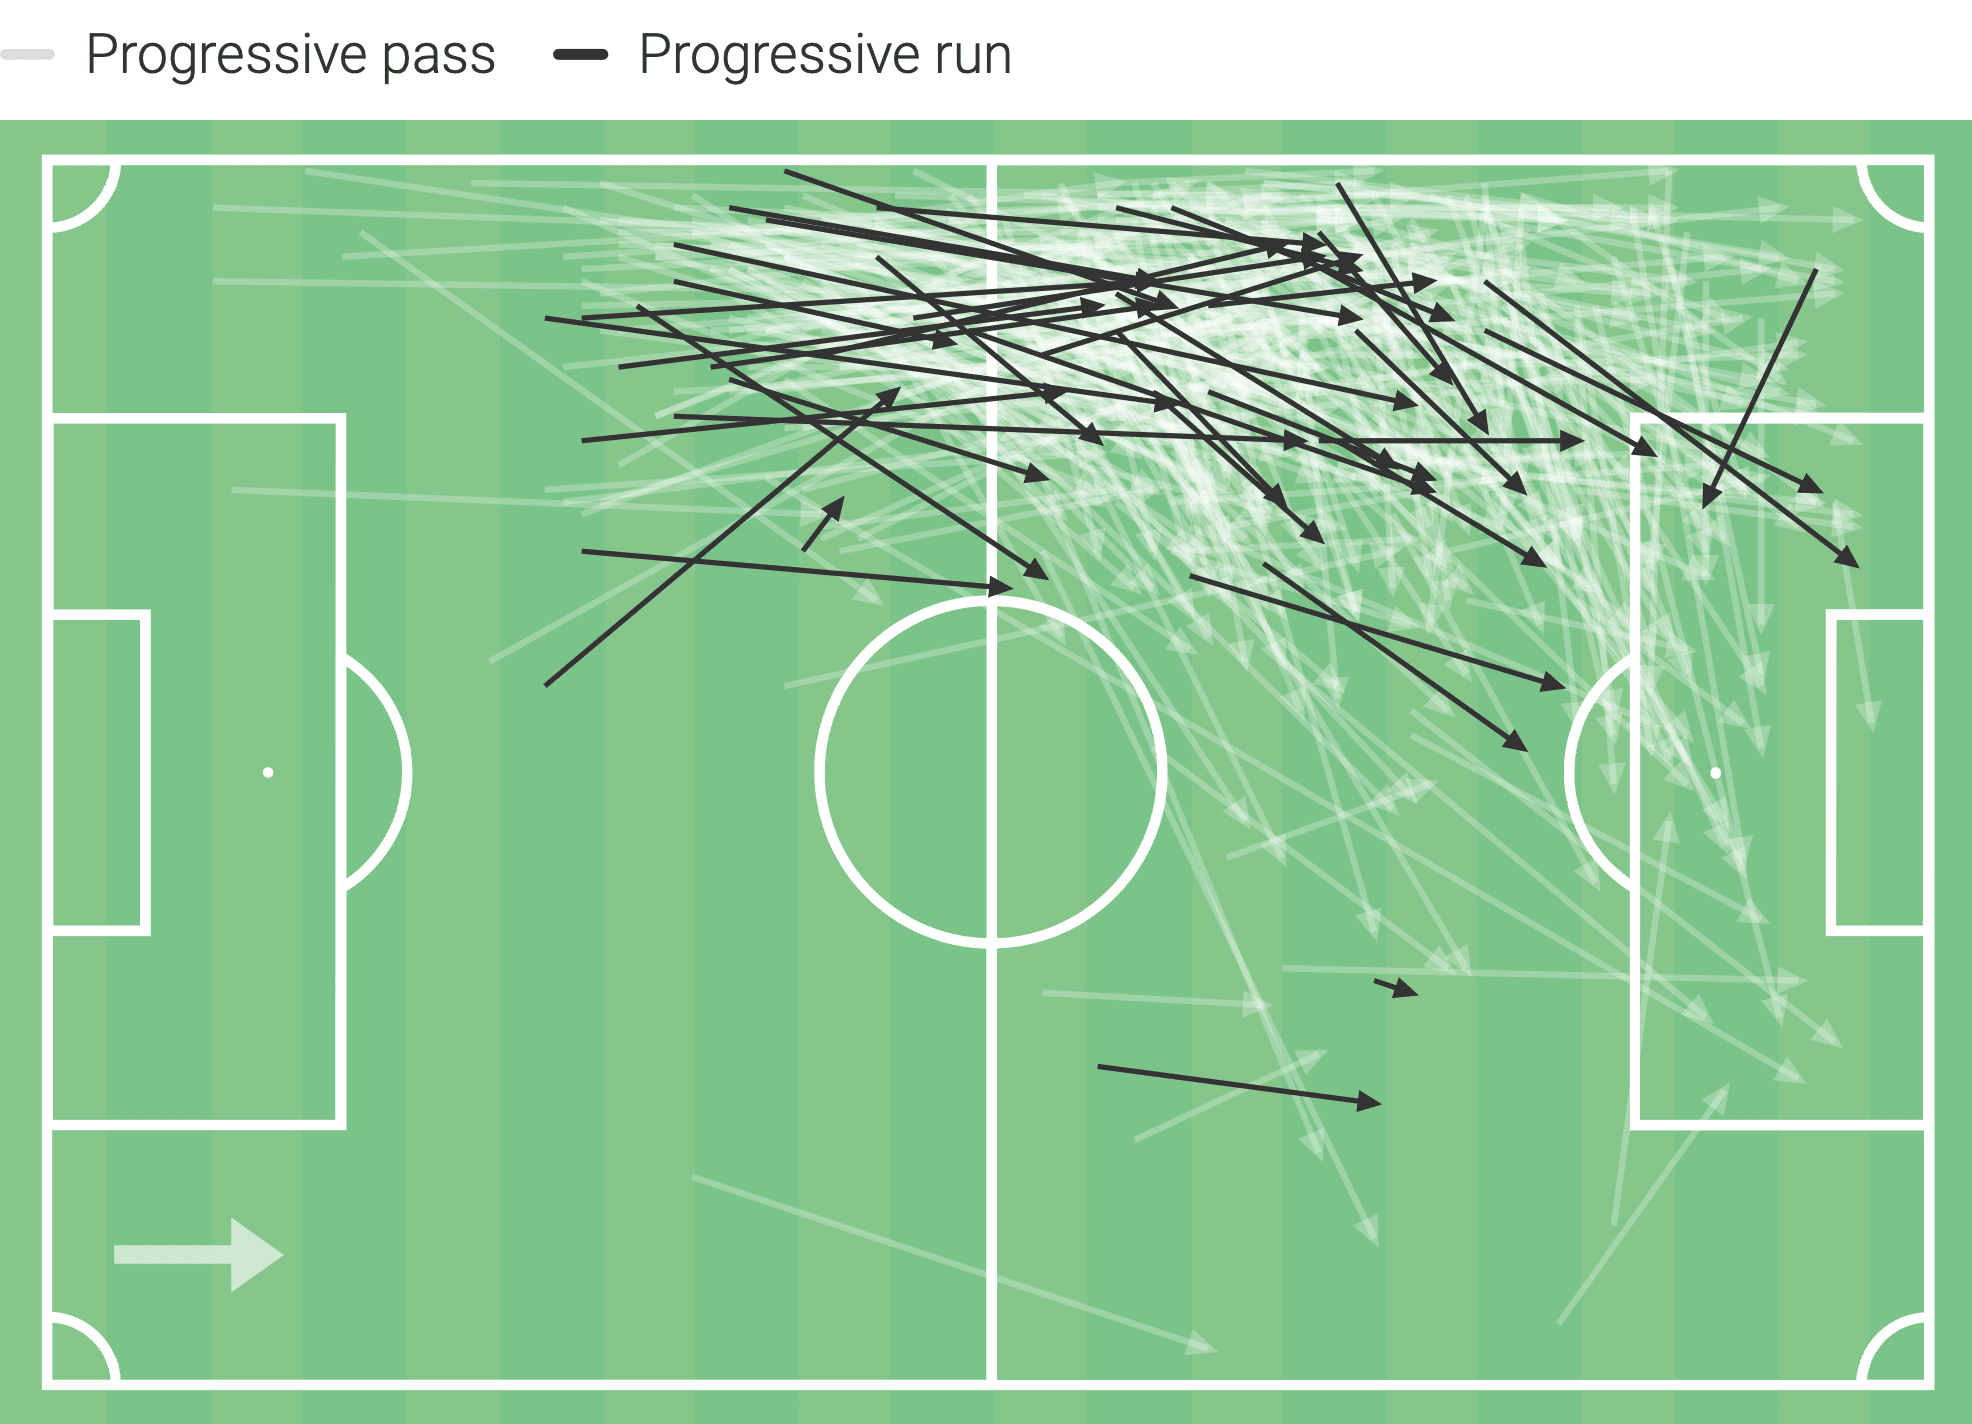
An analysis of the map shows us how Guerreiro has a lot more progressive passes than progressive runs but also that most of the latter are strictly in wide areas. On the other hand, Guerreiro’s progressive passes come mostly from and to the wide areas but some of them are directed to the inside of the penalty box, this shows that he doesn’t attempt to carry the ball to those areas himself and prefers to deliver it through passes.
In this next scatter plot we will take a look at the amount of forward passes per 90 and the percentage of those that are made to the final third, the goal is to see how often a player tries to find a teammate in the final third with a pass in relation to the amount of times he plays forward. In other words, we will try to see which players take more risks when playing progressively and, as a consequence, create more danger for the opposition by breaking their lines.
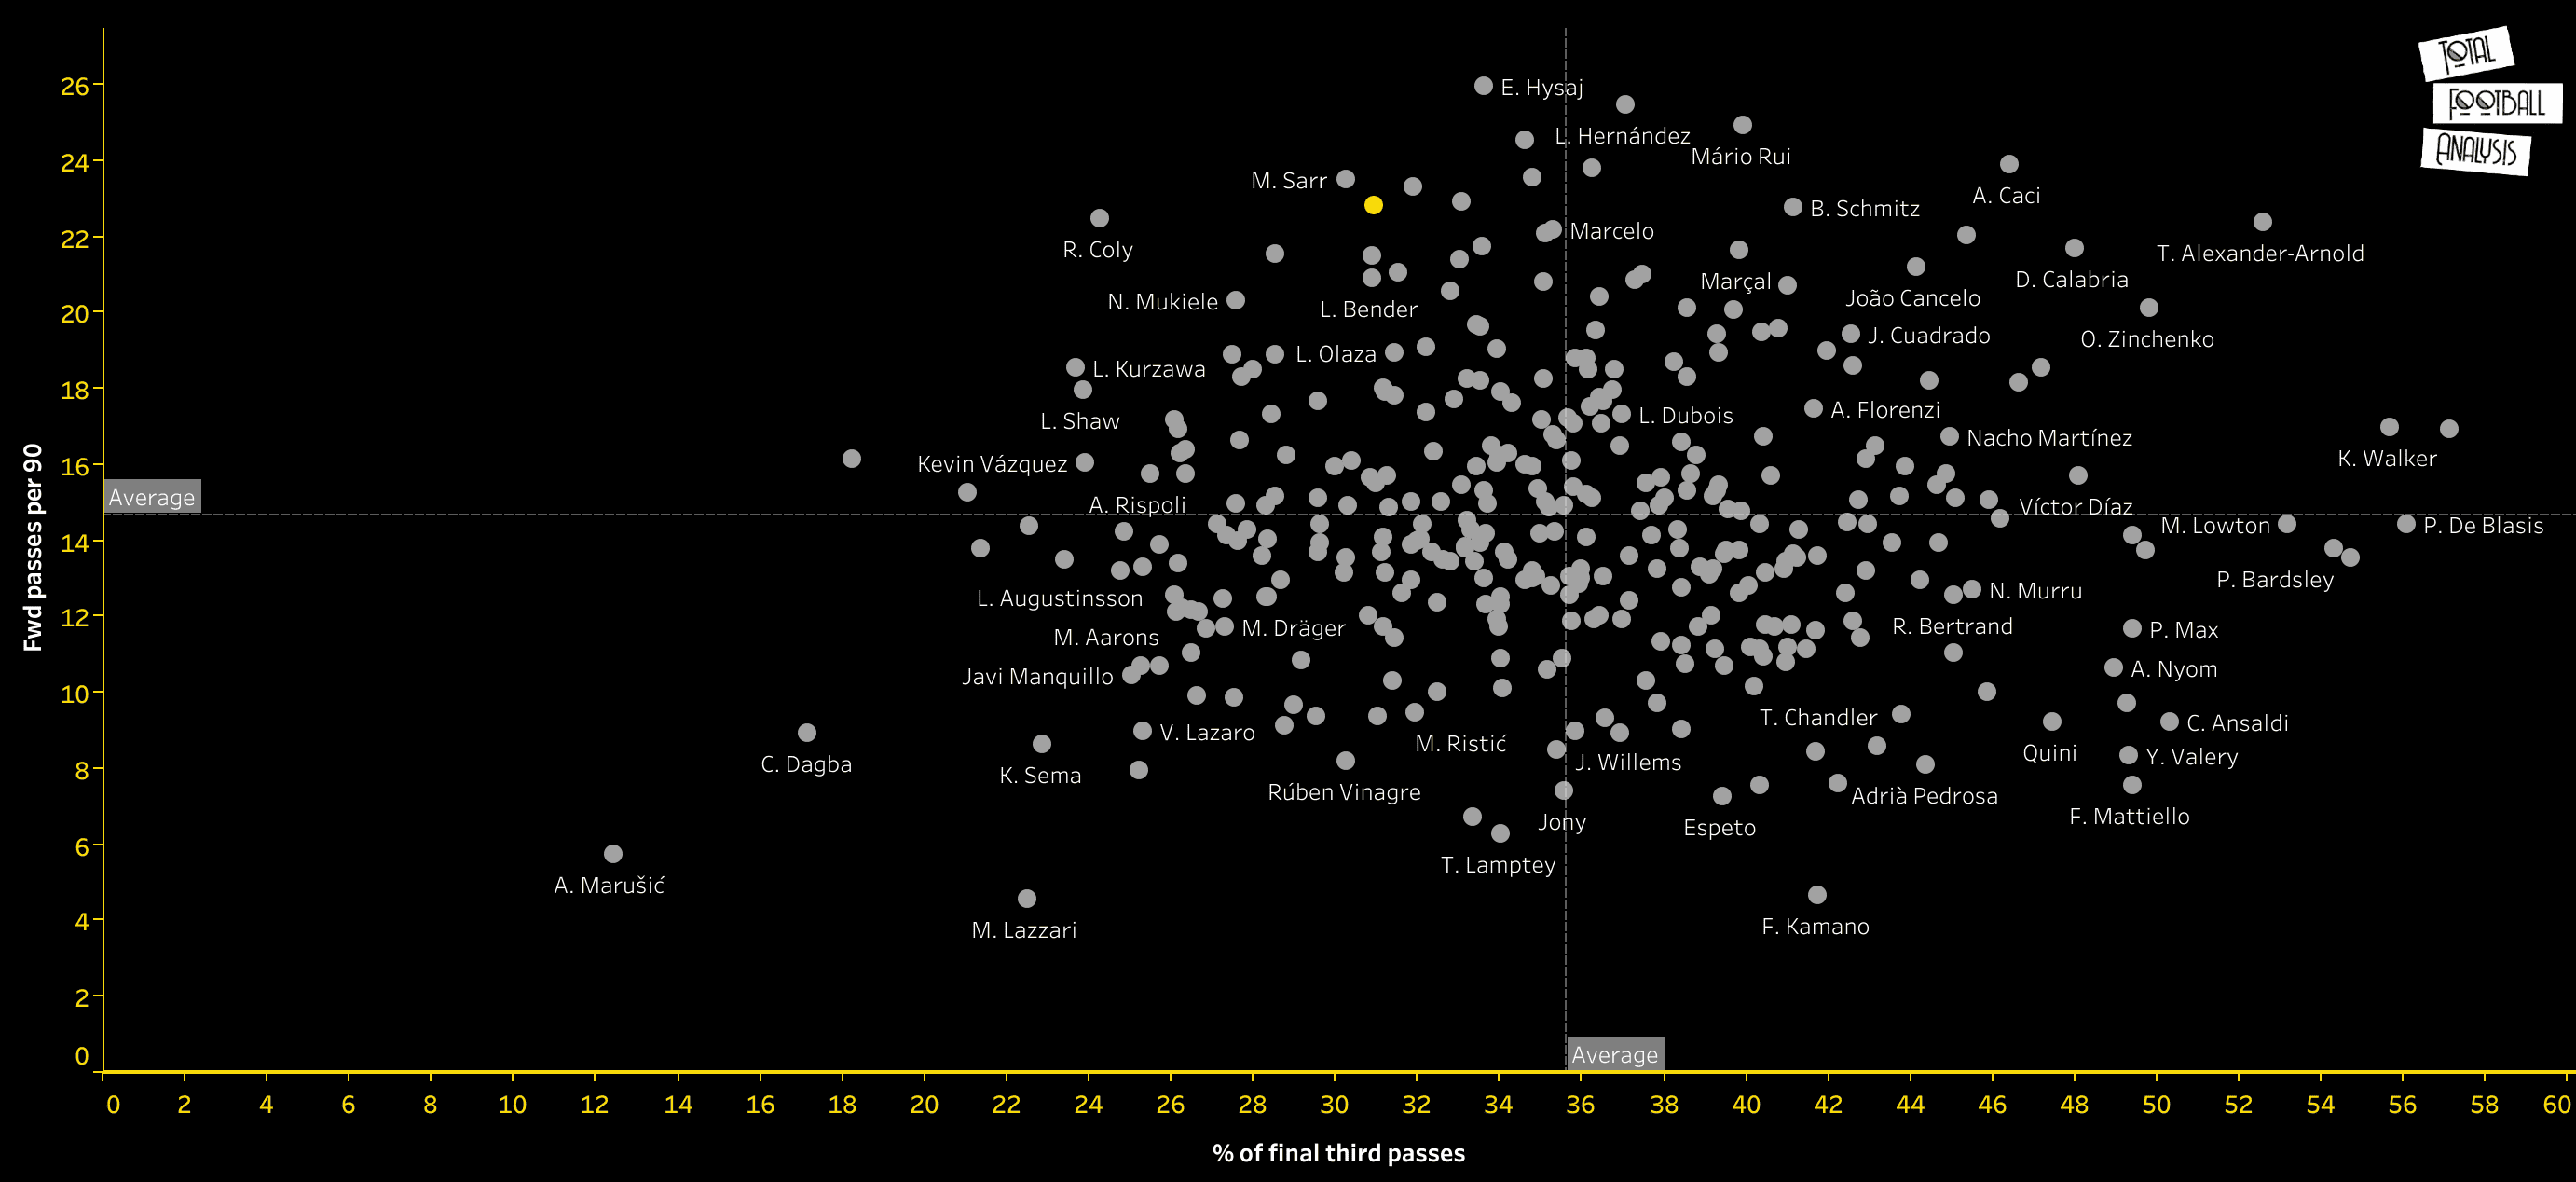
An analysis of the graphic above shows us how Raphael Guerreiro is a player that plays a lot of forward passes but not many of them are made into the final third. The Portuguese averages 22.80 forward passes per 90 which ranks him 11th in this metric, however, only 30.96% of those are made to the final third which is a percentage below the average of 35.62%. This shows that Raphael Guerreiro does like to play forward but prefers to play shorter passes and try combinations in order to get the ball to the final third instead of trying a pass that gets it there directly.
Chance creation and creativity
In this section we will analyse the amount of chances created by the players as well as their creativity to play passes into dangerous areas. The first scatter plot shows us two metrics that serve the purpose of measuring the ability of the players to play dangerous passes or crosses. Dangerous passes per 90 is a metric created by adding passes into the final third per 90, deep completions per 90 and passes into the penalty area per 90 and dangerous crosses per 90 is a metrics created by adding crosses into the goalie box per 90 and deep completed crosses per 90.
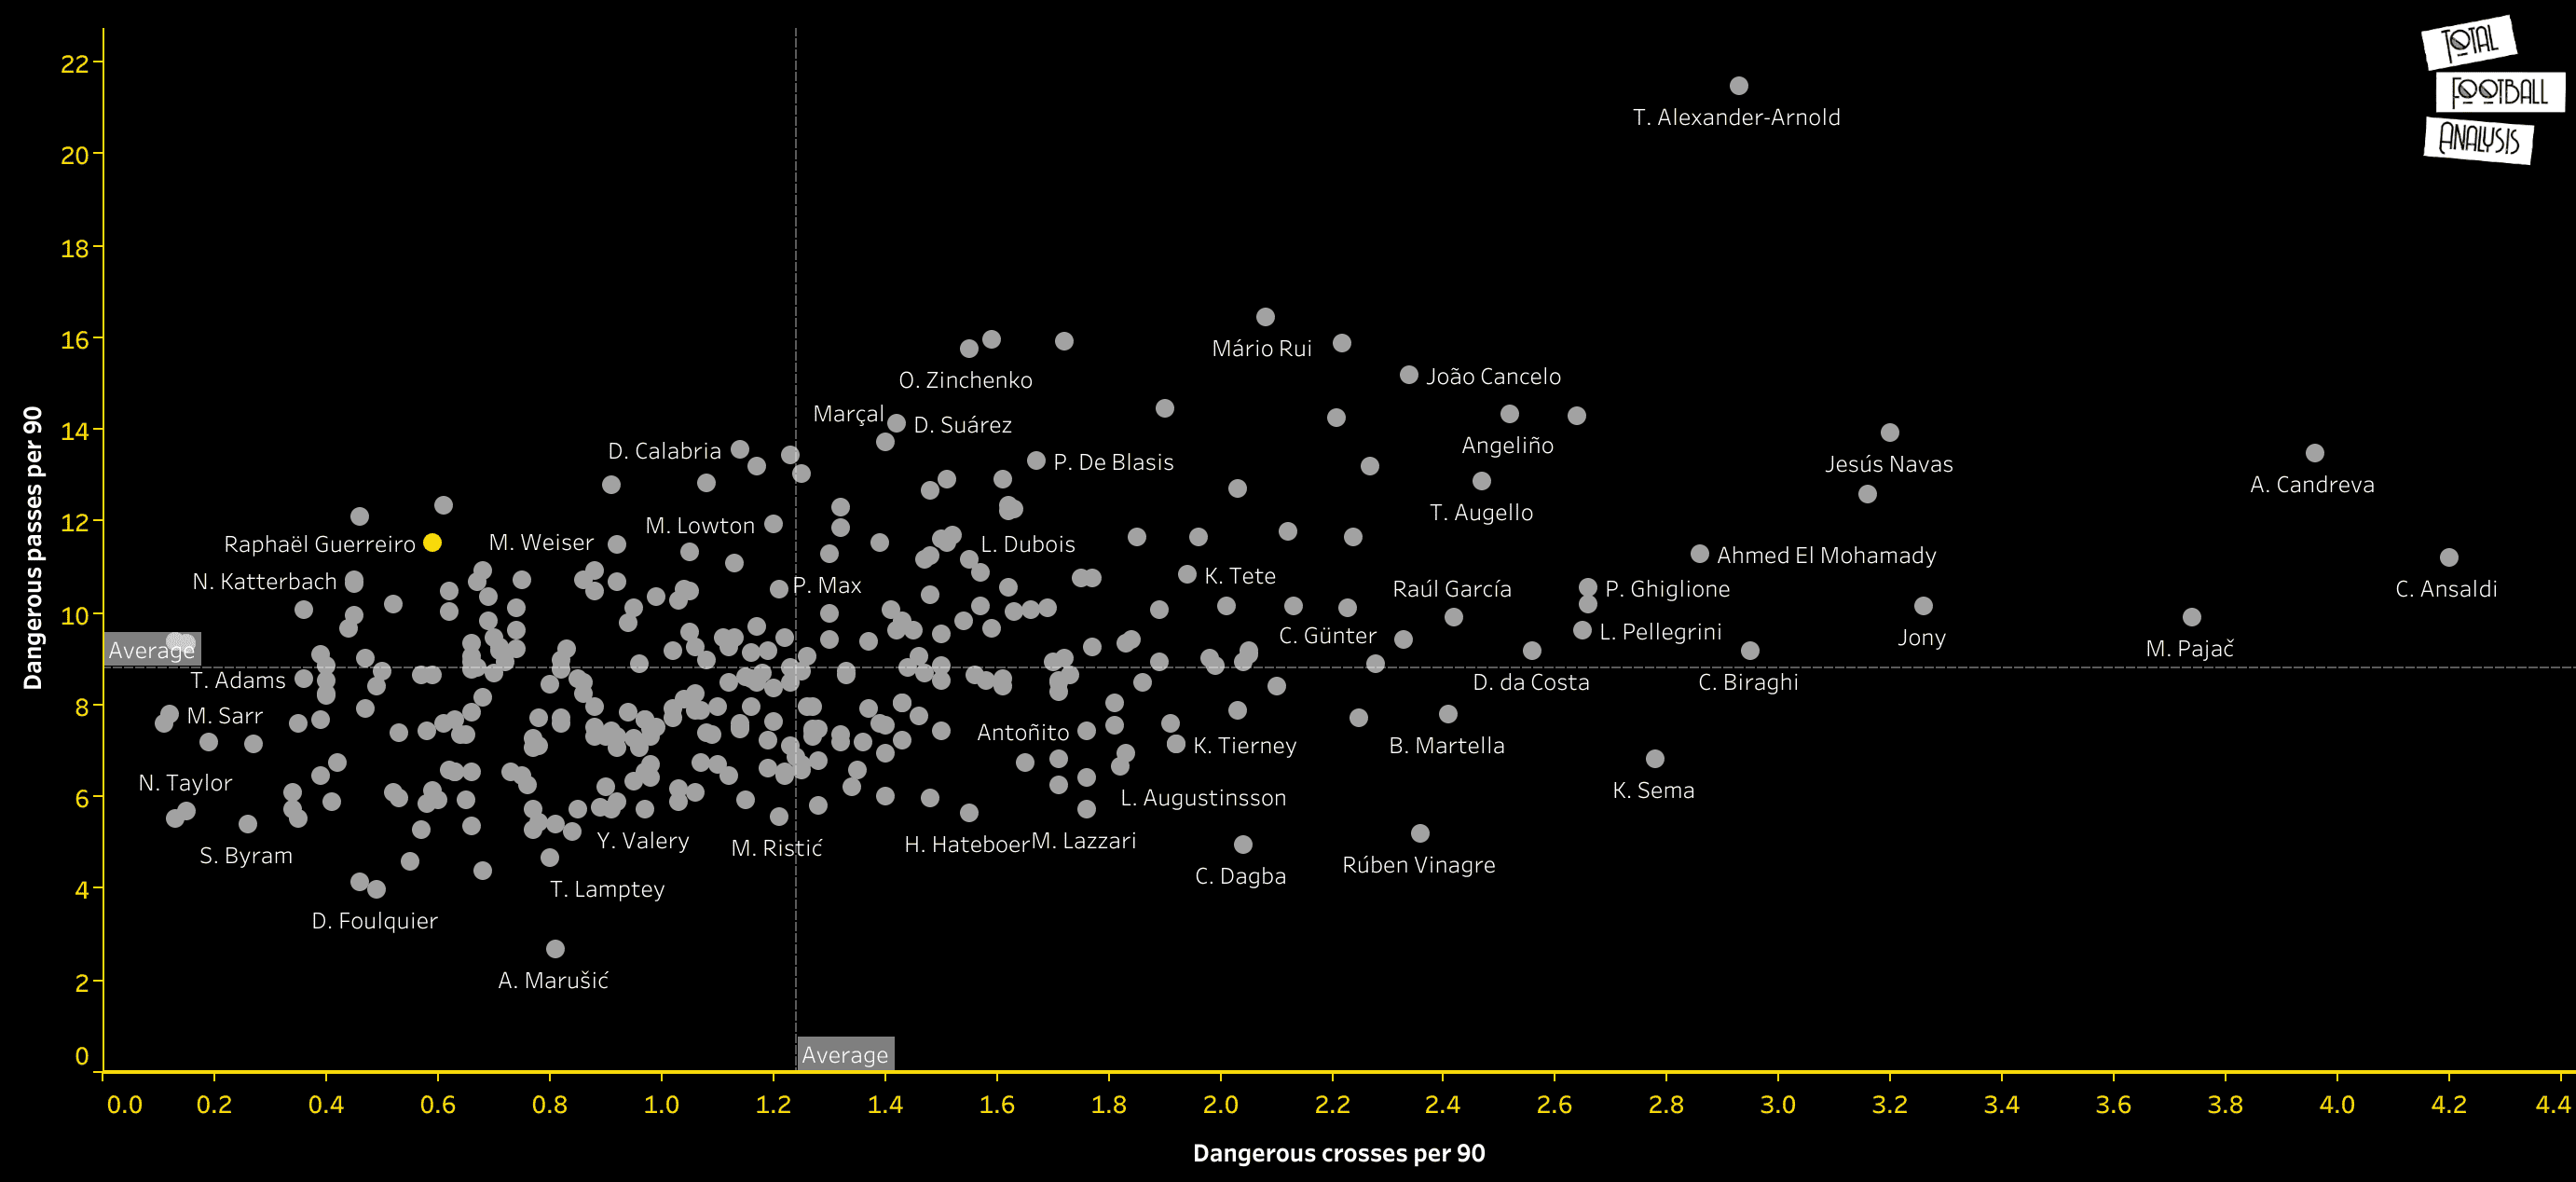
The scatter plot above allows us to draw multiple conclusions, first of all, we can see how Raphael Guerreiro is well above average when it comes to dangerous passes per 90 (11.53), reinforcing once again his great passing ability. His high rank in this metric, when seen side by side with his low number of dangerous crosses per 90 (0.59), shows us that Guerreiro not only tries to get the ball to dangerous areas through passing a lot more than through crossing, but that he is also more successful this way, which is consistent with the already mentioned characteristics of the Portuguese. Furthermore, seeing Guerreiro with a similar profile to Sergi Roberto and Danilo in this graphic shows us how he resembles a midfielder statistically as both mentioned players can also play in the midfield.
The next scatter plot attempts to measure the ability players have to create chances as well as their deliveries into the opposition’s penalty area using the metrics passes into the penalty box per 90 and chances created per 90. Chances created per 90 is a metric achieved by adding key passes per 90 and assists per 90.
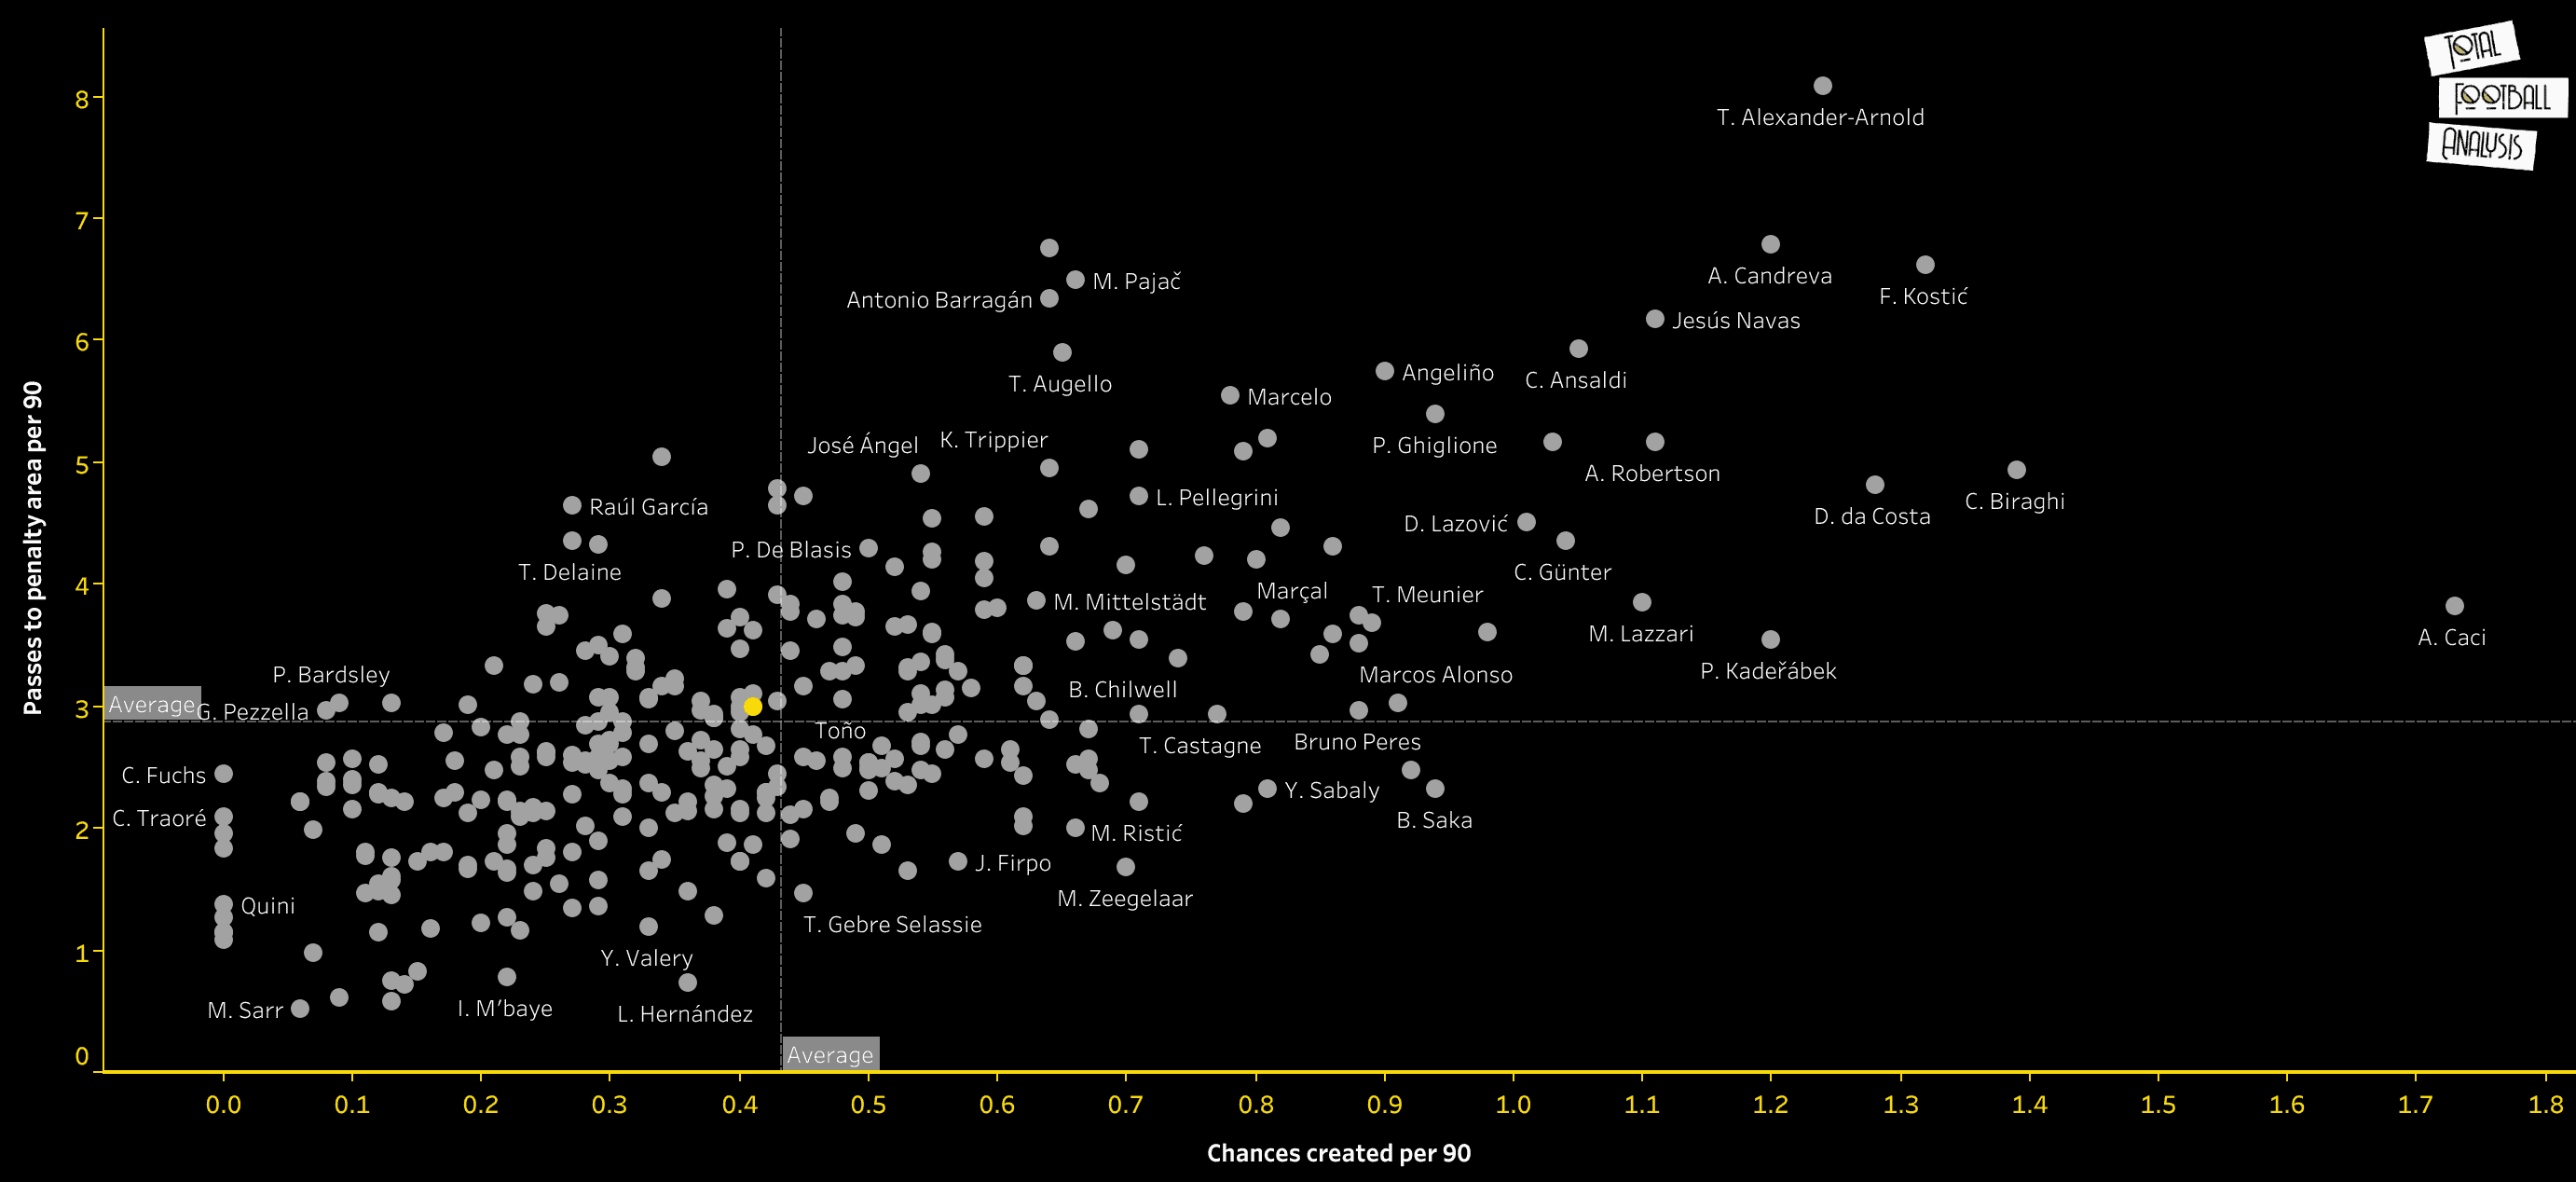
An analysis of the graphic above shows us that Raphael Guerreiro doesn’t create many chances for his team nor does he play a lot of passes to the penalty area. The Portuguese averages 2.99 passes into the penalty area per 90 and creates 0.41 chances per 90, if we compare this stats with Hakimi’s, his teammate from the other side of the pitch, the difference in the roles and style of play appears once again. We can say that Raphael Guerreiro is more important in progressing the ball to the final third and less involved in the final pass and in the creation of scoring chances.
Goal contribution
Last but not least, we will take a look at the player’s raw contribution to their team’s goals. The scatter plot below has the metrics goal contribution per 90 and xG contribution per 90 in both axes. Goal contribution per 90 is a metric achieved by adding assists per 90 and goals per 90 while xG contribution per 90 is achieved by adding xG per 90 and xA per 90.
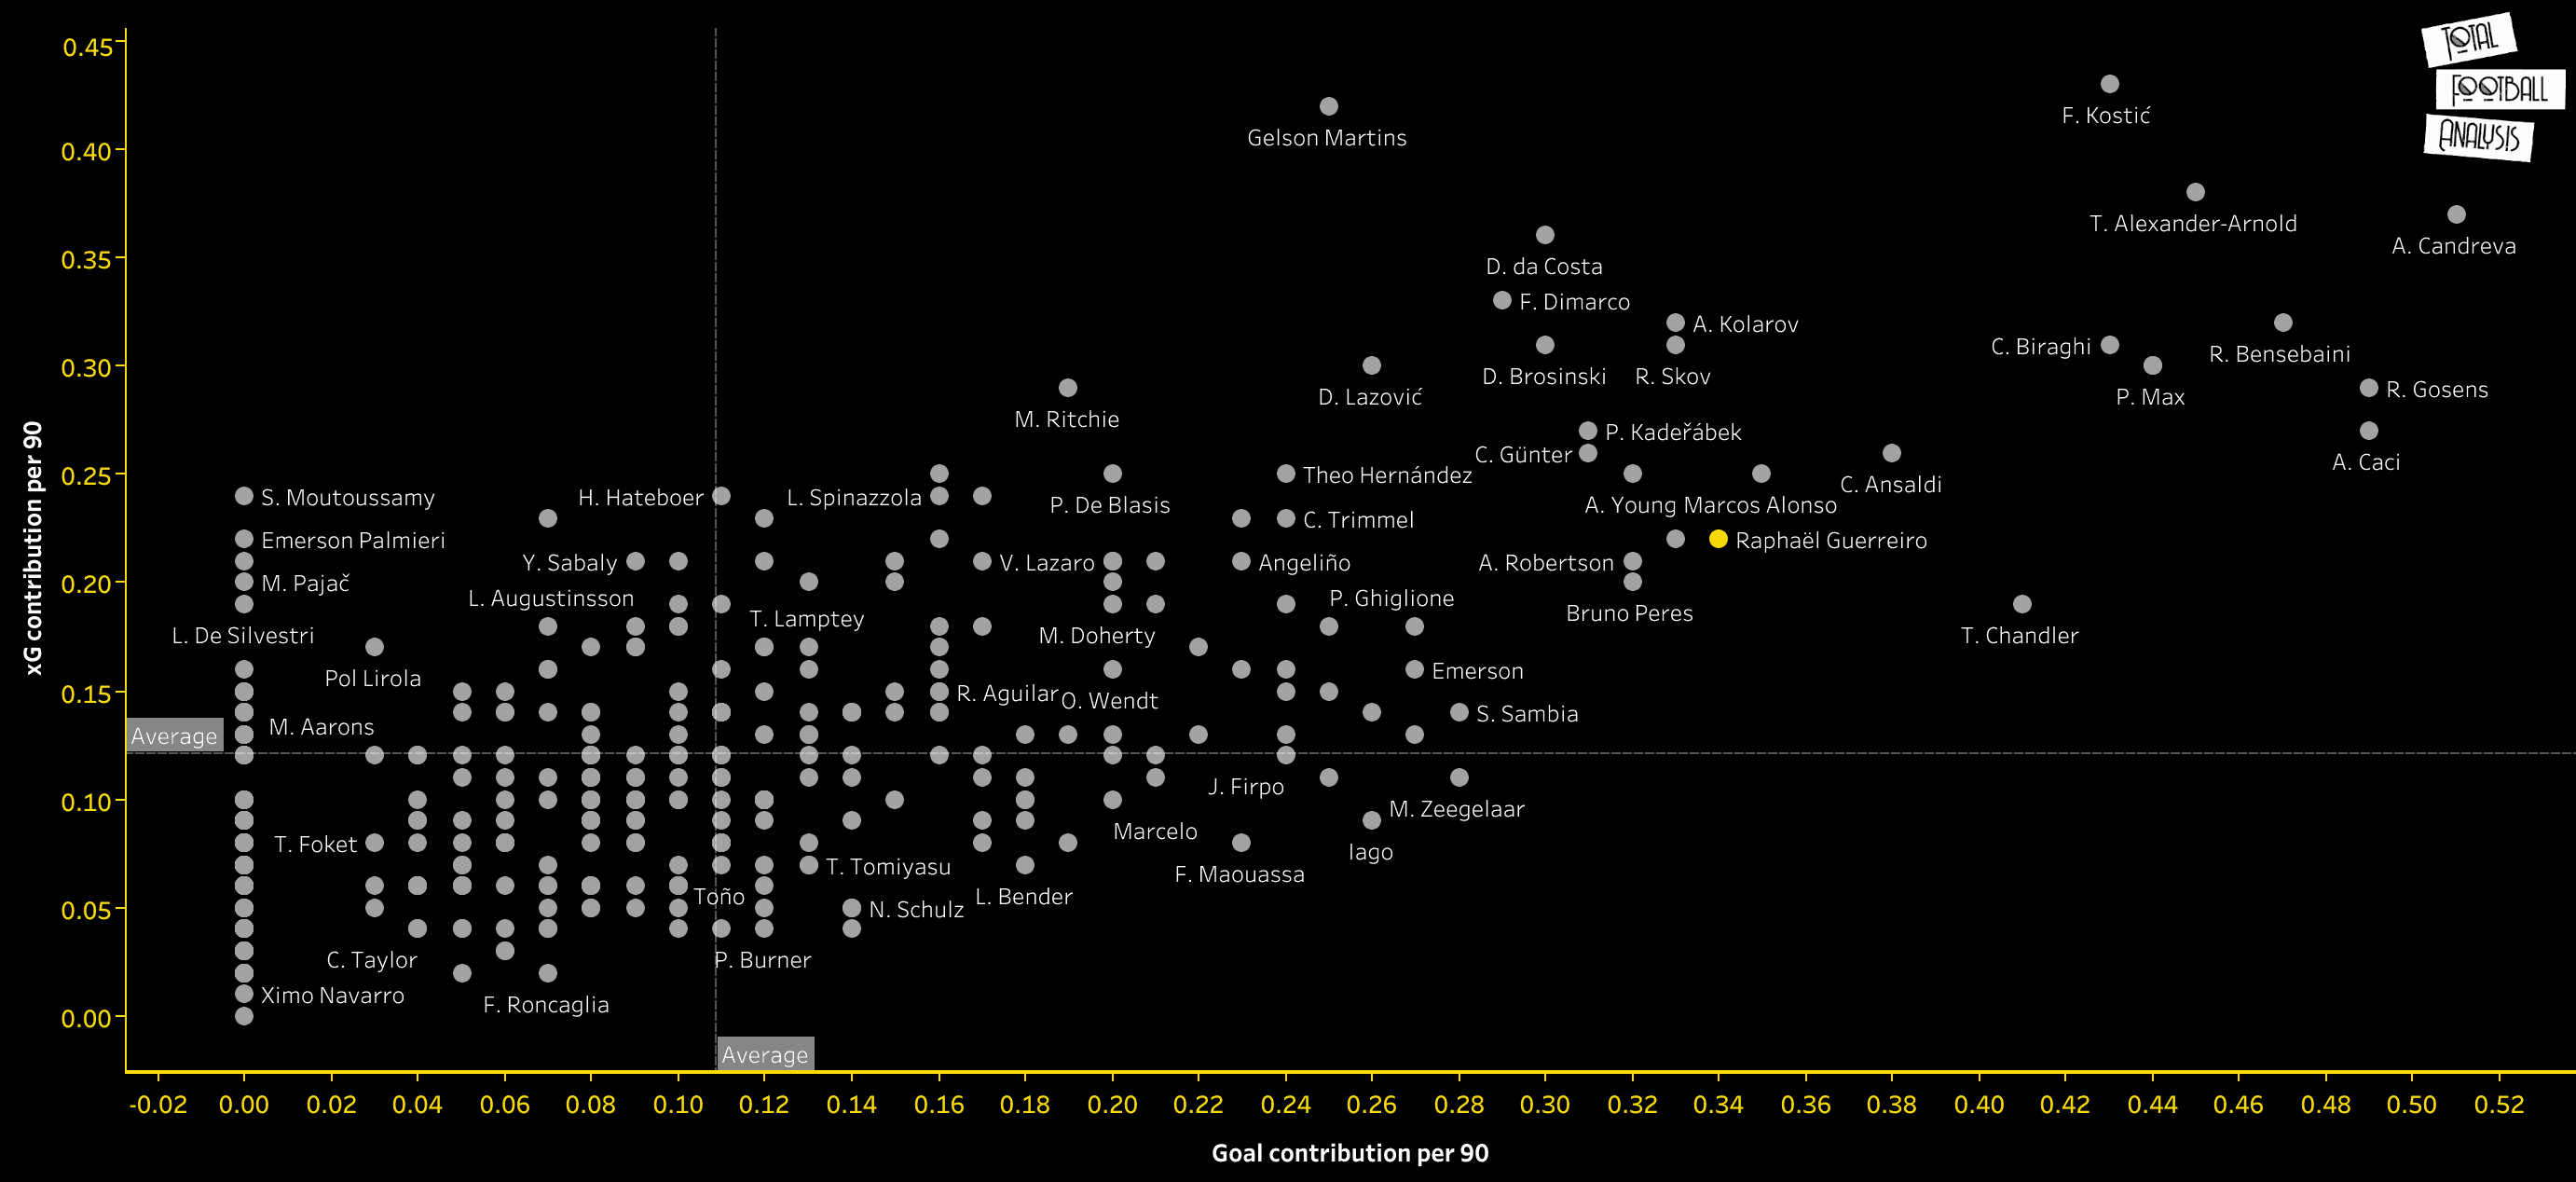
Raphael Guerreiro appears in the right upper quadrant of the scatter plot, meaning he is above average both analysed metrics. With a 0.34 goal contribution per 90 that surpasses his 0.22 xG contribution per 90 Guerreiro has a similar profile to Bukayo Saka or Andy Robertson, two players that contribute a lot to their respective team’s offensive output. Despite the low numbers Guerreiro displayed in terms chance creation he ends up having a very good offensive output having scored 8 goals and provided 5 assists for Borussia Dortmund this season.
Conclusion
All in all, Guerreiro is a versatile player that excels at passing and ball progression while also being consistent at defending. Despite his low numbers in terms of chance creation, he has a good amount of goals for a player of his positions and a decent amount of assists. Below is a small statistical profile that shows Guerreiro’s percentile ranks when compared to other players in his position from the top 5 European leagues that allows for a clear picture of some of his strengths and weaknesses.

This data analysis allowed us to determine Raphael Guerreiro’s statistical profile and compare him to other players from the top 5 European leagues that play in the same position. In the end, the analysis showed us how Raphael Guerreiro plays a big role in his team’s build-up play passing and progressing the ball up the pitch. His statistical profile has a lot of similarities with one from a central midfielder and perhaps that’s why he has played in that position sometimes for Dortmund in the Bundesliga and the Champions League.





Comments