In a wild summer that saw FC Barcelona pull lever after lever, part of me wondered if an Emperor’s New Groove joke was getting lost in the shuffle.
The other thought that came to mind was one of squad continuity and cohesiveness.
“Can they make this work? Between the January signings and seven new arrivals, several of whom could see significant playing time, will they be a cohesive team? Can this collection of exceptional talent, albeit from a host of footballing backgrounds and cultures, carry out the Barcelona philosophy?”
It’s simply not that easy to plug so many holes in the ship that quickly.
At least that was the initial thought.
This data analysis is designed to put those thoughts to the test. Challenging these assumptions with data, we’ll break down transfer statistics in a few ways. First, we’ll follow the money and look at the past 5 years of spending in the EPL. Then, we’ll look specifically at clubs with an inherently greater need for player investment, the newly promoted clubs. Finally, since it’s Barcelona’s spending that piqued the topic, we’ll look at the implications of elite clubs spending big in the transfer market.
Ultimately, we want to see if less is more in the transfer market or if clubs can splash the cash to buy their way out of trouble and up the standings. When rosters shuffle, is it rebuild or ruin that results? Let’s find out.
Is squad continuity important?
Though it’s Barcelona that inspired this magazine article, we’re going to follow the money to the EPL. We want to look at how teams spend their money, get an idea of how many players clubs will add to their functional roster each season and the concrete statistics produced by those players. We want to see if roster turnover has any correlation with movement in the league table, as well as the types of players clubs bring in. Did they spend a lot on a few players or is the model to strengthen the squad by adding more players at a lesser calibre?
Before we dig into the data, note that all statistics come from Transfermarkt. When completing the database, the goal was to identify incoming transfers who earned playing time during their first season with the club. The number of minutes contributed per player was noted as well, giving the total contribution by new players and the percentage of minutes claimed over the course of the season. We have recorded five years’ worth of transfer data from the EPL, as well as additional statistics to come from some of the biggest individual transfer windows in the history of the game.
The first question addressed was whether the percentage of total minutes contributed by new signings had an impact on their new clubs’ point totals for the season. If new signings garnered more of the minutes, did it help or hurt the team? Perhaps was it neutral or inconclusive?
Coming into this data analysis, there was an anticipation that clear trends would emerge from the data and that moment of great insight would hit. How naive.
While the data is more muddled than anticipated, the following data visuals give us some trends to work with. First, looking at EPL data from the 2017/18 season, we can see how the percentage of minutes contributed by new signings correlated to the club’s season point total. The average percentage of minutes contributed by new signings was approximately 20% of the team’s total 37,620 possible minutes on the pitch. Of the top seven finishers in the league, Tottenham had the lowest contribution by new signings at 12%. Manchester City led the way at 28%. Of the other five teams, we find that they fall very close to the median number of minutes afforded to new signings.
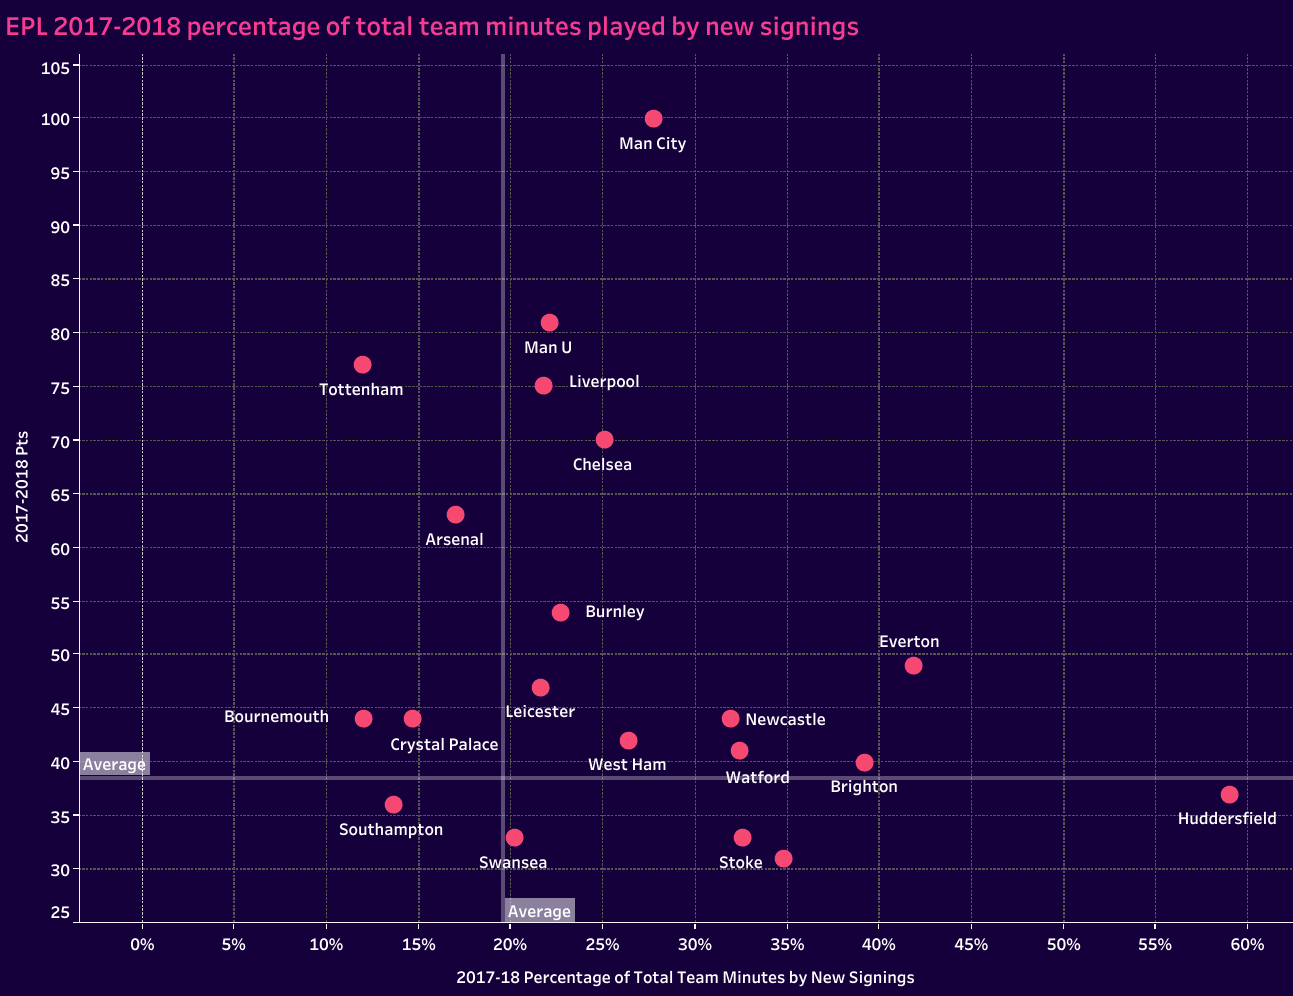
Once you get beyond the top seven, the data is a bit trickier to read. Of the top half of the table, only Everton and Newcastle gave newcomers more than 30% of the available minutes. The bottom half of the table features five teams in that category. Swansea City was ultimately relegated, but they were the club closest to the median. By no means is 20% a hard and fast rule. It doesn’t necessarily equate to success, but high turnover does stand out as a negative, at least for the 2017/18 campaign.
But what about those other four years of data collected for this article? Let’s take a look at the dashboard to see if the 20% trend holds water.
Keeping in mind that the higher the placement on each chart the better club has performed, we do find some shifts in the data. For one, after their splurge leading into the 2017/18 season, we find that Manchester City ranges from 4% to 13% for the next 4 years. Liverpool has one more year of significant newcomers in 2018/19, but then they scale back in the following three seasons, allocating a high of 10% available minutes to newcomers in 2020/21.
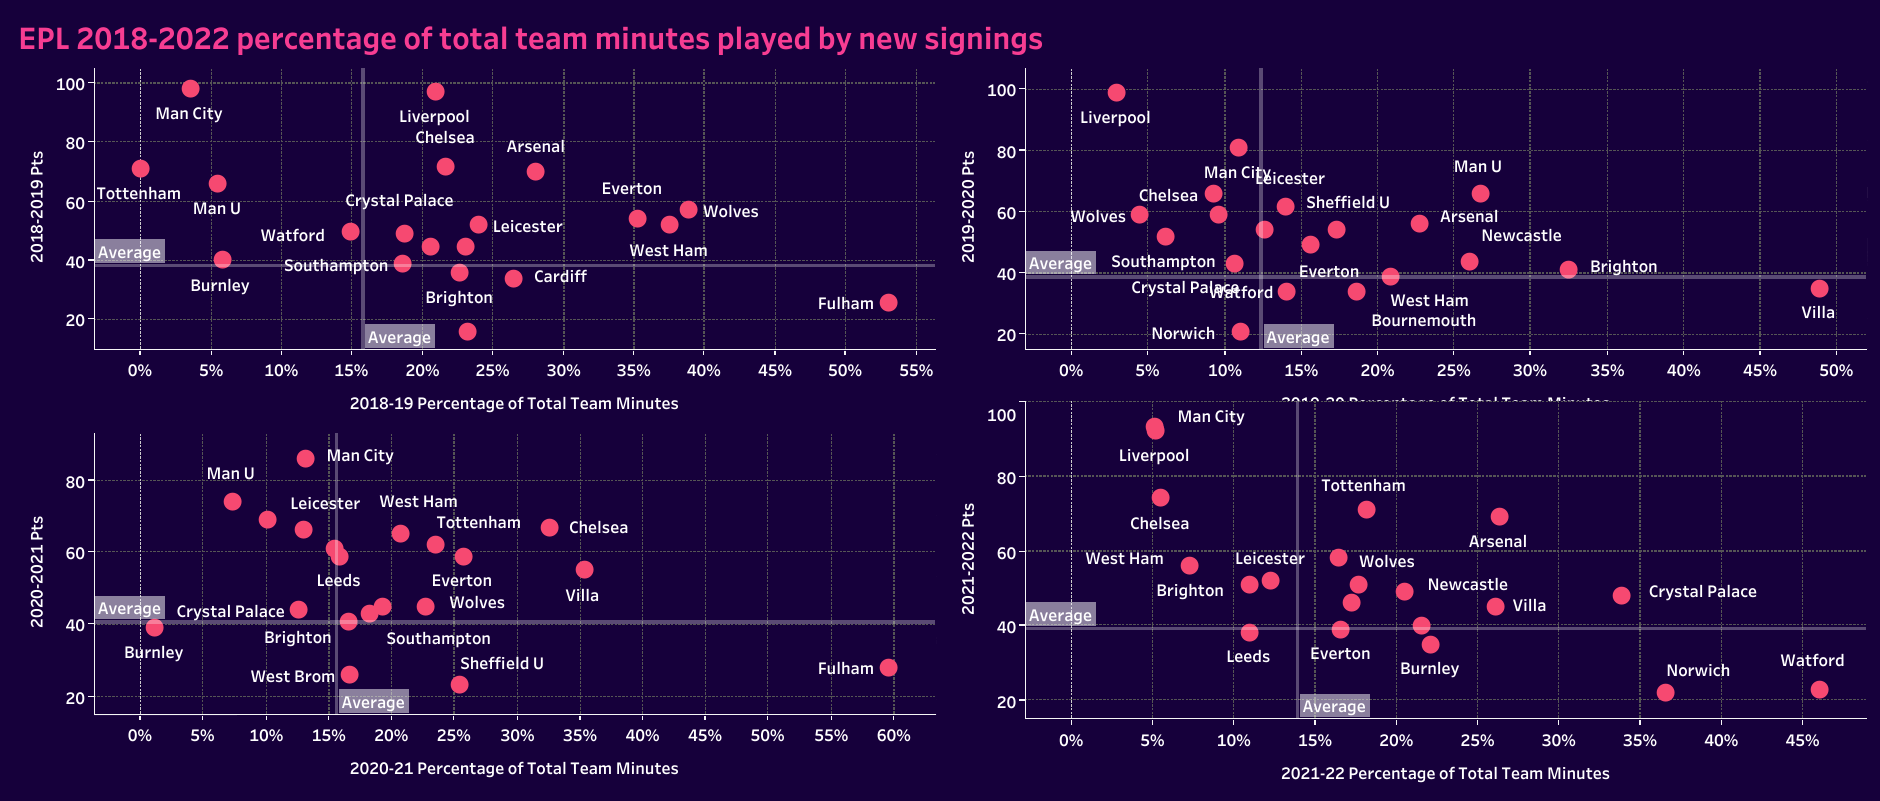
Looking elsewhere, Arsenal relied heavily on newcomers in 2018/19 and 2019/20 only to see their league placement fall to 8th in the table. Fulham suffered a similar fate in both 2018/19 and 2020/21. Essentially fielding a new squad each season, their extreme approach to roster turnover ended in immediate relegation.
On the other end of the scale, Burnley tended to alternate between years of higher activity and almost no roster turnover. Over the five years, the percentage of minutes that went to new signings were 23%, 6%, 13%, 1% and 22% respectively. Interestingly, they also spent those first few years alternating between the middle of the table and the relegation battle. By year five, an 18th-place finish sealed their doom. Those years that had 23% and 13% of minutes for newcomers came during seasons with 7th and 10th place finishes respectively. When new signings were neglected, they fell off the pace.
As the bigger clubs had more and more success, there’s certainly a trend of less reliance on newcomers. Though players like Jack Grealish have suffered unending criticism for the lack of contribution to their new clubs, the Man City’s and Liverpool’s of the world are well-oiled machines, only needing the occasional tune-up. As the saying goes, “don’t fix what ain’t broke.”
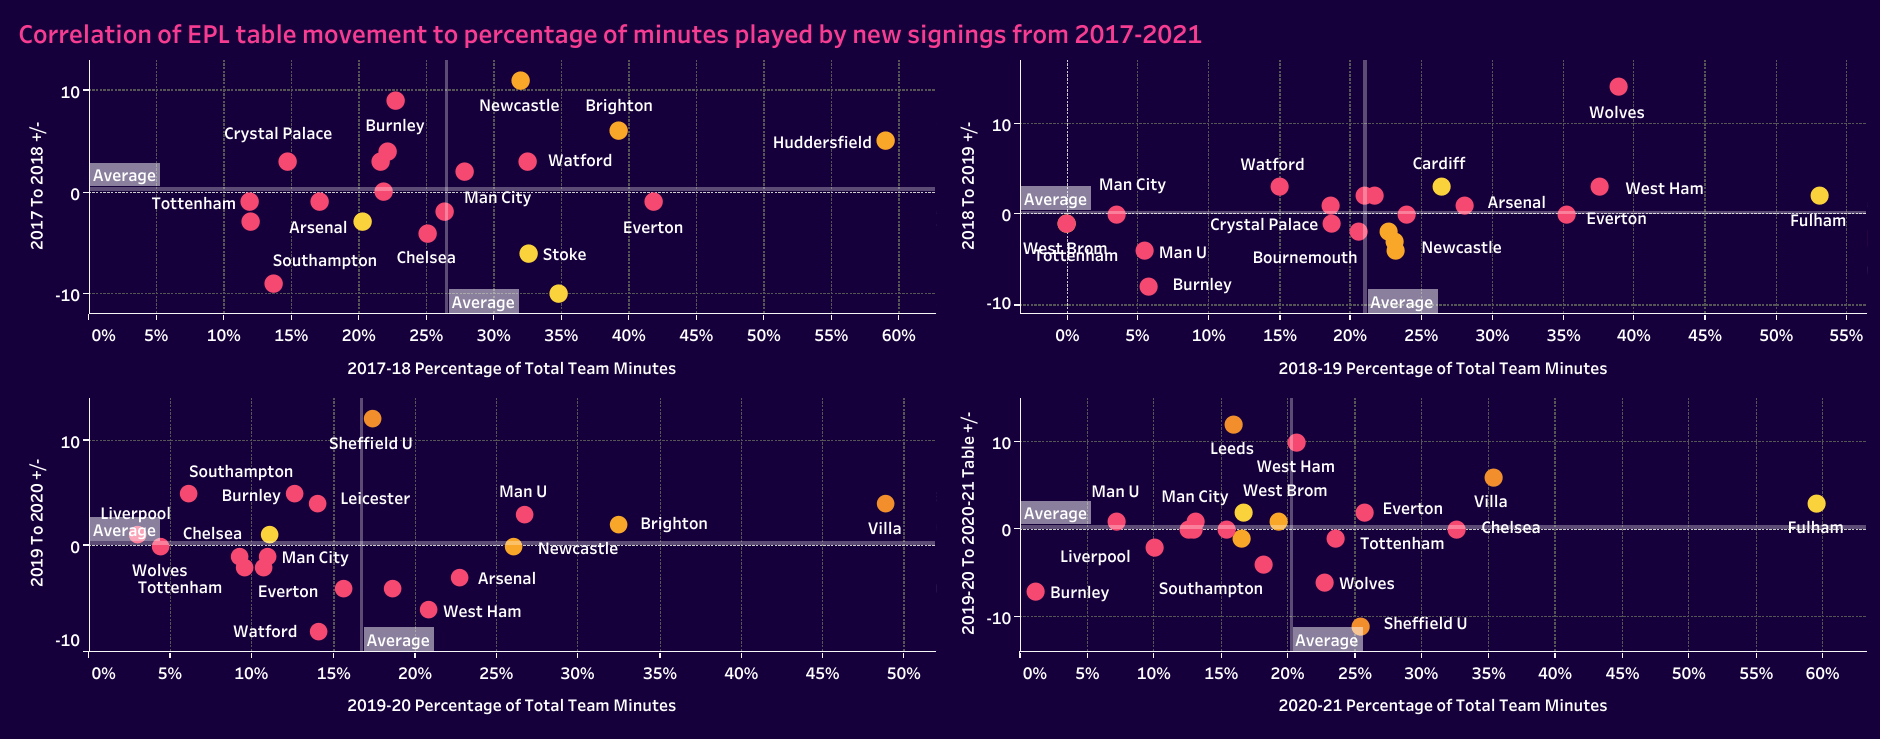
The first two charts give us an idea of the relationship between the percentage of minutes for newcomers and the club’s point total for that respective season. Those are concrete numbers, but we also want to get an understanding of the percentage of minutes relative to improvements or declines for each club in the league table. Let’s start with last season.
Looking at this chart, for bigger clubs, especially the Big 6, less movement is preferred since it shows less variance in league positioning. Liverpool and Chelsea each improved one spot in the table while Manchester City put in a repeat performance at the top of the table. Manchester United declined by four spots while Tottenham improved by three, as did Arsenal. For the newly promoted teams, the value allocated to them for the previous year’s performance was 21, indicating that they fell outside of EPL status, which is the reason Brentford tops the table with an eight-point improvement with their 13th-place finish. The three relegated teams are represented by yellow circles and Brentford was given an orange as the lone newly promoted team to escape immediate relegation.
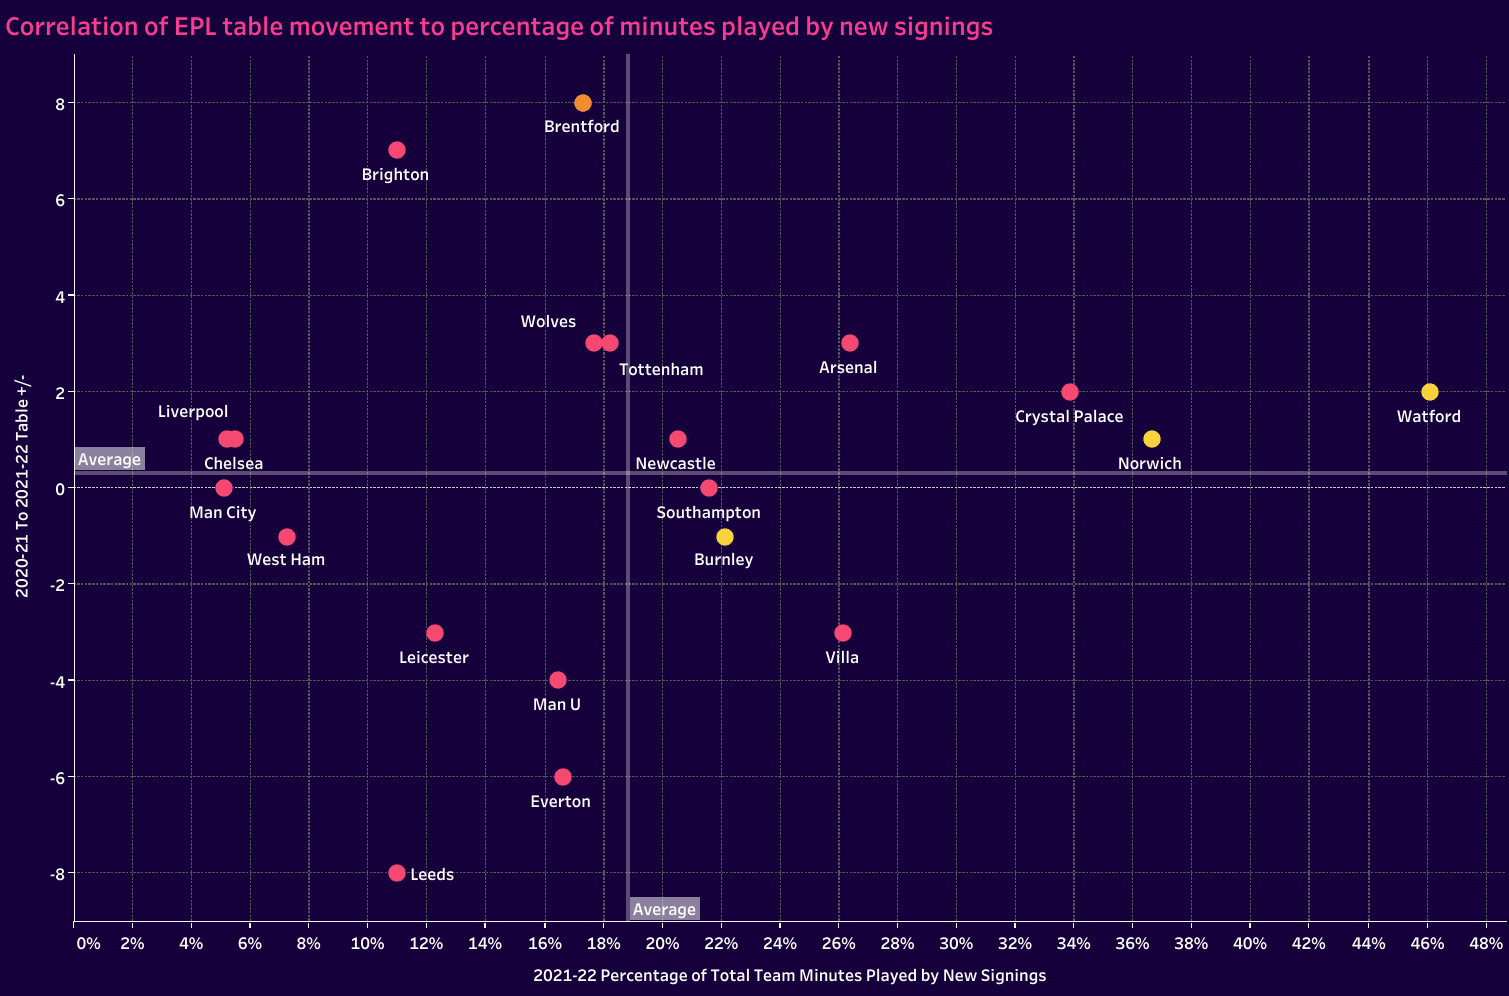
We do have a few takeaways from the chart. First, the teams that are close to the league median in the percentage of minutes played by new signings generally did well. Manchester United and Everton severely underperformed despite a more balanced transfer window, but Newcastle, Tottenham and Wolves improved on the previous season’s results, Brentford was a standout and Southampton finished with the same spot in the league table.
Manchester City, Liverpool and Chelsea are clearly the outliers, needing fewer contributions from newcomers to finish as the top three. However, looking beyond those three and the clubs that were within approximately 10% of the league median, it does appear that more roster turnover led to better results than less movement.
New signings may bring new life to the club, but not all signings are equal. In addition to identifying the percentage of minutes allocated to new signings, we also wanted to see how many new players clubs brought in and the average number of minutes contributed per signing.
Once again, we see last year’s top three finishers at the front of the chart with the fewest signings. Don’t fix what ain’t broke. At the other end of the scale, three of the four clubs with the most new signings were ultimately relegated. That fourth club, Aston Villa, had nine new signings earn minutes during the 2021/22 campaign, but note that their newcomers averaged significantly fewer minutes per player than those of Burnley, Norwich and Watford. Ultimately, Villa relied less heavily on their newcomers to produce last season.
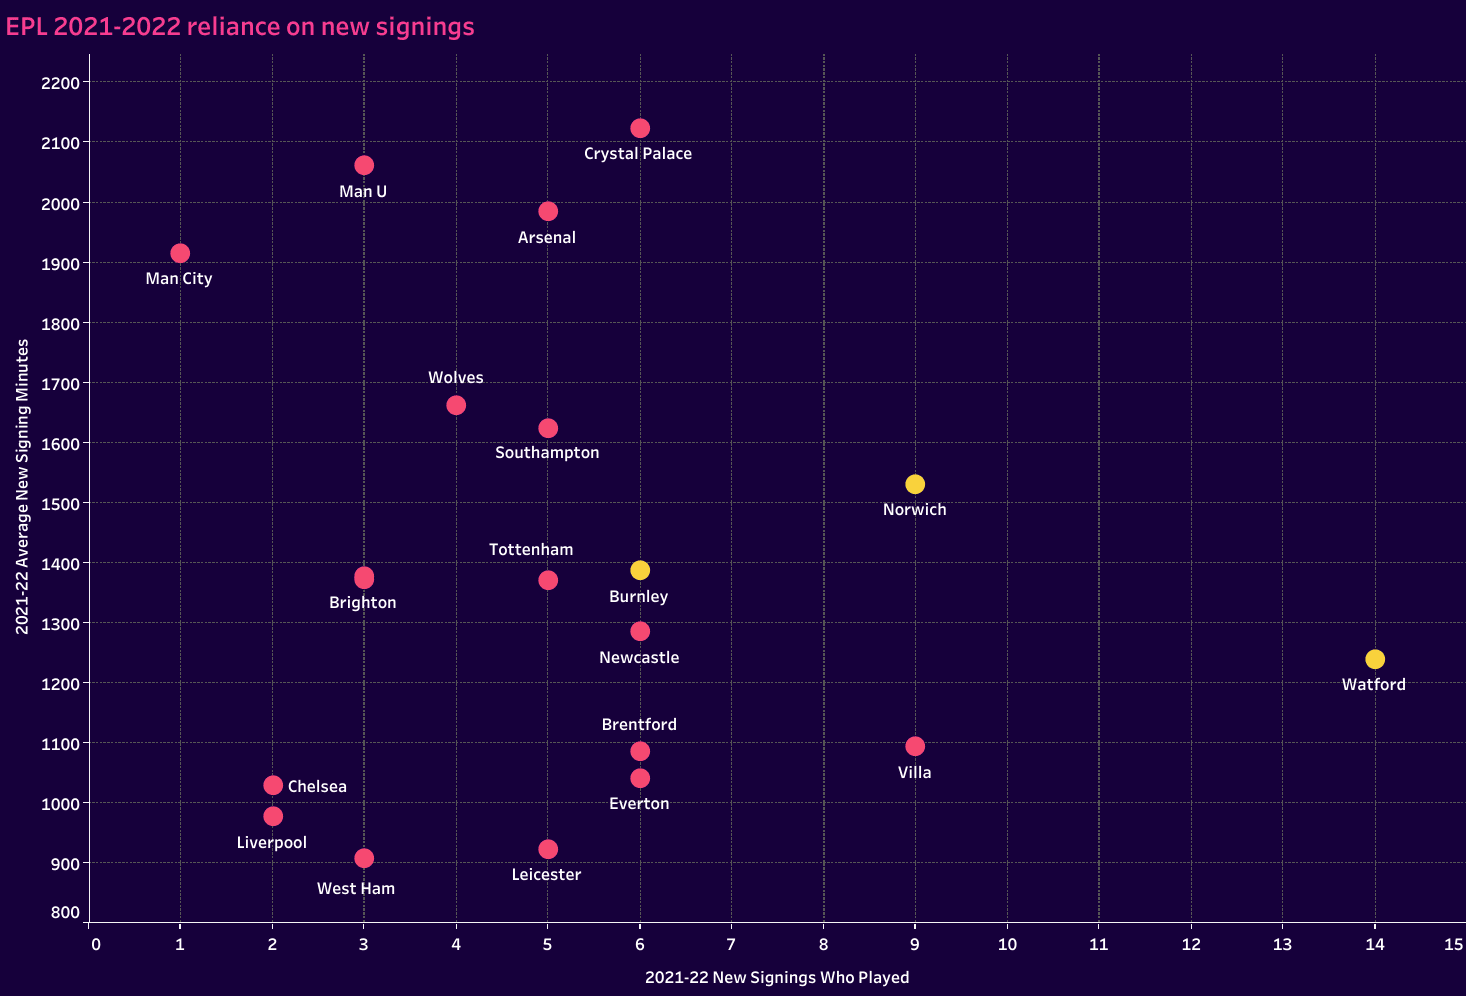
The two Manchester clubs, Wolves and Arsenal each added fewer pieces to the squad, but the new additions were more heavily relied upon. Except for Manchester United, you could say the other three clubs did well with their recruitment, getting more production from fewer players.
With the exception of Crystal Palace, no team with six or more first-team additions saw the same kind of impact as the teams at the top left of the chart. You could argue that Newcastle signings largely occurred in January, thus impacting the total number of minutes available to the new signings. That’s certainly a valid point and one that would see them read much higher on a prorated basis. Aston Villa also had a couple of influential January signings, but, ultimately, the new signings at these bottom right-hand clubs were less influential than returning players and newcomers at most other clubs around the league.
Looking at the data, continuity and cohesiveness are important, but only once the right foundation is in place. For clubs that are still searching for the right mix of core players, more personnel movement makes sense. However, once that core group is in place, then the process is a matter of gradual refinement.
Is less more for relegation battlers and newly promoted clubs?
Newly promoted clubs and the relegation battlers are playing a different game. While the biggest clubs in each nation are jockeying for league titles and traditional mid-table teams are fighting it out for continental play, clubs mired in the relegation battle are hell-bent on survival. Points are difficult to come by and personnel is far less flexible than we see with their colleagues. As mentioned in a previous analysis on overachieving, one model for survival is tactical extremism. That could mean an innovation like overlapping centre-backs, as we saw with Graham Potter’s Sheffield United or going big and ugly in a low block with reliance on counterattacks and set pieces for goals.
Working through this data analysis, it was clear that the clubs most likely to get relegated were the ones who had just received promotion. Just look at Fulham’s recent EPL history. Making the jump from the second division to the first is difficult enough. Personnel typically lags behind their new first division colleagues, so it is clear that newly promoted squads need the most upgrades and will see the highest percentage of roster turnover in a given year. However, at what cost does that turnover come? To compete in the first division, how many players from a top second division side have to be sacrificed in order to increase the odds of a second season in the top-flight? At what point does lack of cohesiveness hurt the club?
We came in with lots of questions and came away with some answers. First, the January window prior to promotion can pay huge dividends for a club. Two or three marquee signings in January, especially in the English championship when the EPL money is mere months away, can help second division clubs secure their place among the promoted and allow for a more gradual integration of top-flight calibre players into the current squad. Wolves is a perfect example. Their signings in January of 2018 limited the number of moves they had to make during the summer. With fewer holes to fill and the club cleverly recruiting players from common footballing cultures, the newly promoted side had one of the best seasons a newly promoted side has ever had in the EPL. The better a club does the January prior to promotion, the fewer signings needed during the summer.
Secondly, if fewer signings are made during the January window and the emphasis is placed squarely on the summer, nine to 12 new signings is ideal. Seven new signings were too few for Norwich, West Brom and Cardiff City and 14 too many for Watford and Fulham. However, among the teams that signed between 9 and 13 players, five of the seven managed to stay in the Premier League for at least a second season.
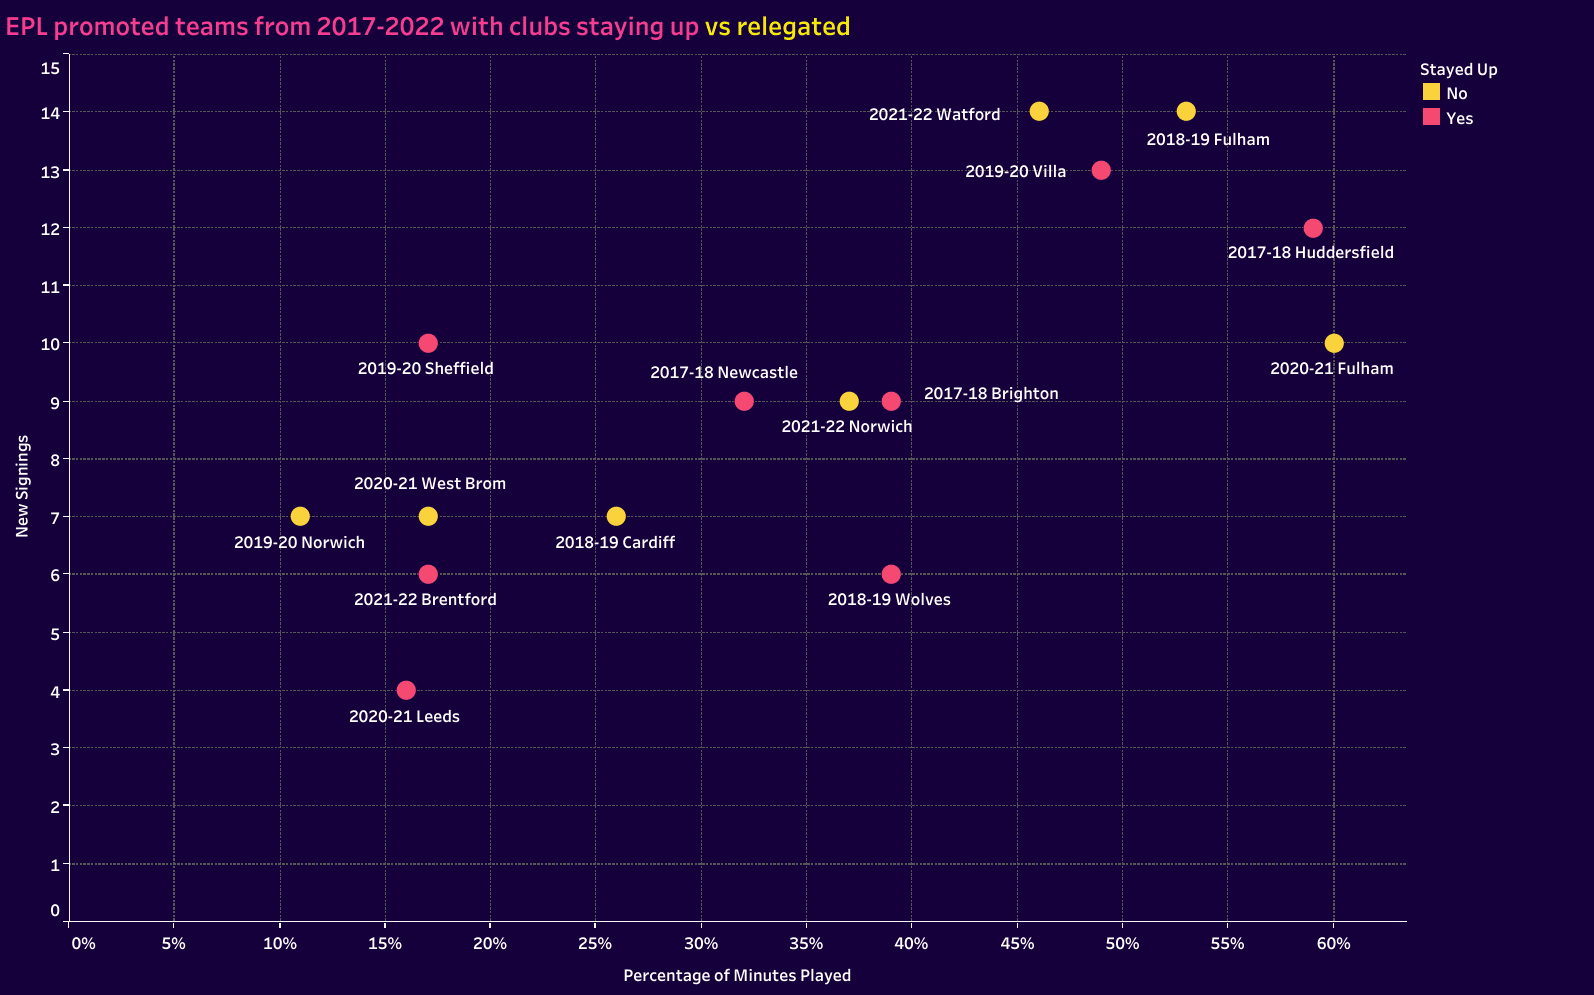
In terms of the percentage of minutes given to new signings, a target of 30-35% is ideal. With 9 or 10 new signings in the squad, the clubs are typically recruiting players of a fairly high calibre. When you look at Wolves’ allocation of minutes to the six new signings they brought in, it’s pretty clear that they were high-quality players who made an impact right away.
The final chart in this section converts each team’s percentage of minutes for newcomers to an average number of minutes per player. Branford sits at the low end of the acceptable portion of the scale with approximately 1100 minutes on the season for each new signing whereas Huddersfield is at the high end with approximately 1850 minutes. Targeting 1,500 minutes on average for each new signing is a good mark for clubs to hit.
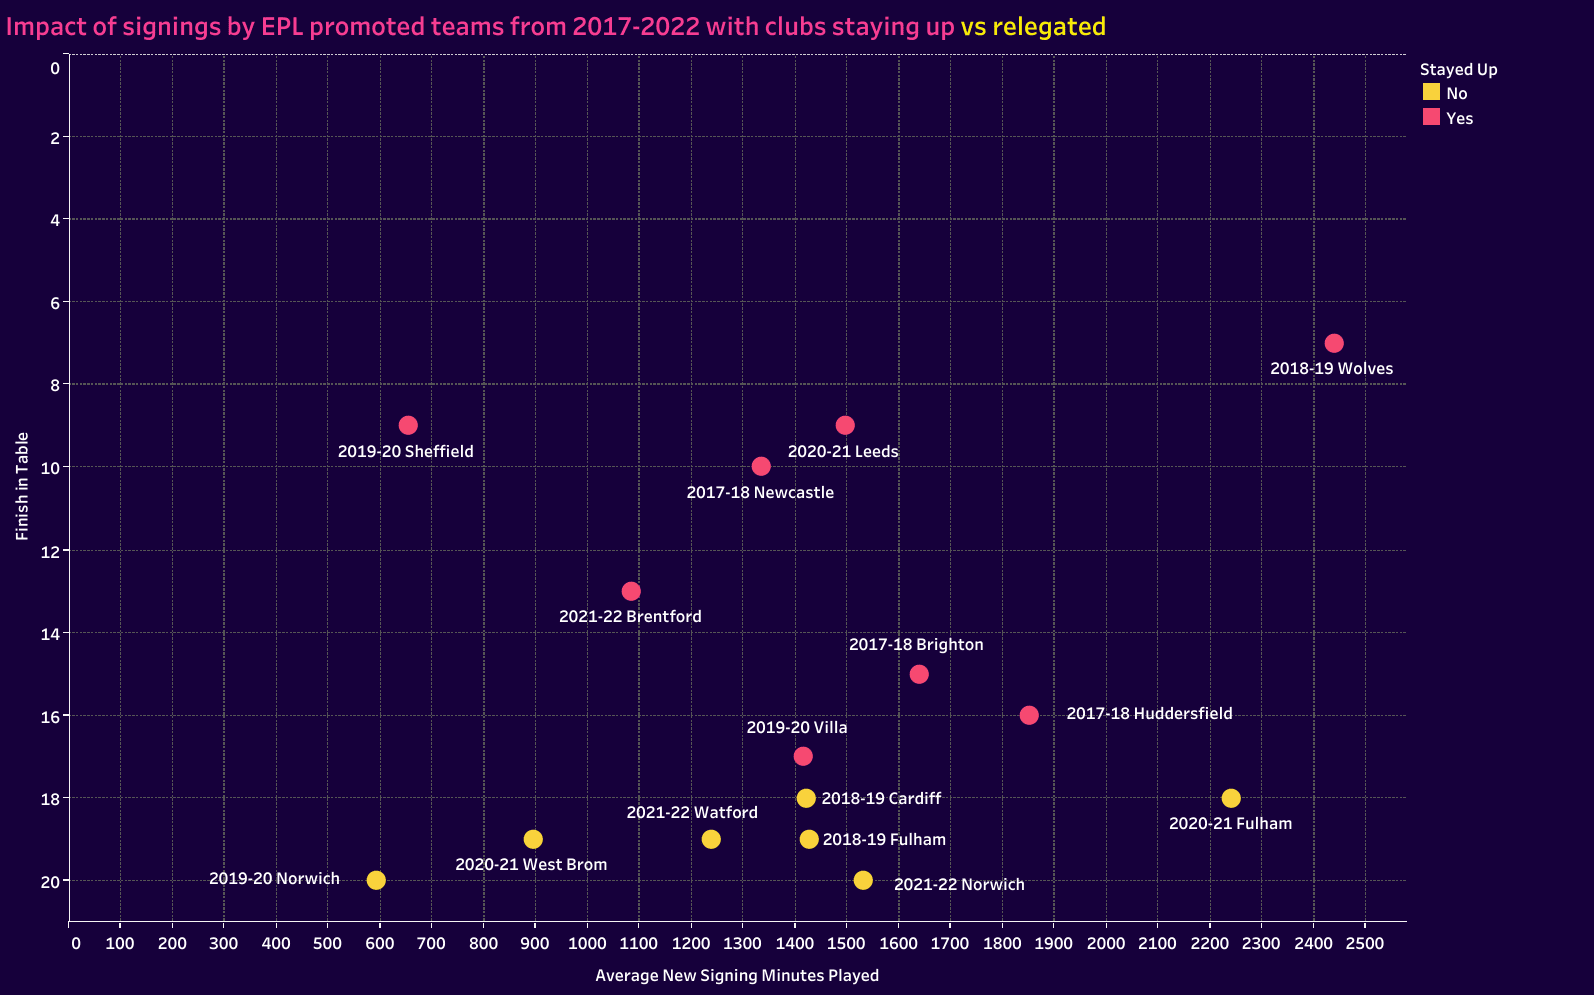
You of course notice the outlier in the group, the 2018/19 Wolves side. Recall that Diogo Jota joined Wolves while they were still in the championship. With such high-end players joining prior to the window, the club did well to identify similar talent levels once their entrance to the Premier League was secure. Their jump into the EPL is the dream first year of top-flight football for each newly promoted squad, however, the foundation they laid the season prior was equally important to the summer of 2018.
Though newly promoted squads and relegation battlers are playing a different game than the rest of their colleagues, there are certainly some statistical markers to target. Hitting these targets doesn’t guarantee success, or survival, but it does increase the likelihood of remaining in the top-flight. Finances may limit the amount of spending to be done and the recruitment work of previous seasons may test the squad’s strength ahead of first division play, so a slight deviation in one direction or the other may be necessary. However, extreme approaches to the transfer market tend to work against newly promoted and relegation-battling clubs.
What happens when elite clubs splurge?
As mentioned earlier, this topic originated with Barcelona’s moves during the 2022 transfer windows. Given the number of players they’ve brought in, which includes a new frontline with the exception of Ansu Fati, we had to investigate previous outcomes of transfer market splurges. Does money spent buy status? If clubs replace 40% or 50% of their starting XI in a single window, can they reasonably expect to gain significant ground on their opponents?
To start the 2022/23 campaign, Barcelona’s answer looks like a resounding yes. Results are going their way and they’re looking more cohesive each week. Is this just early momentum or are the results sustainable over the course of the season? Let’s look at the history of elite clubs after a season of heavy spending in the transfer market.
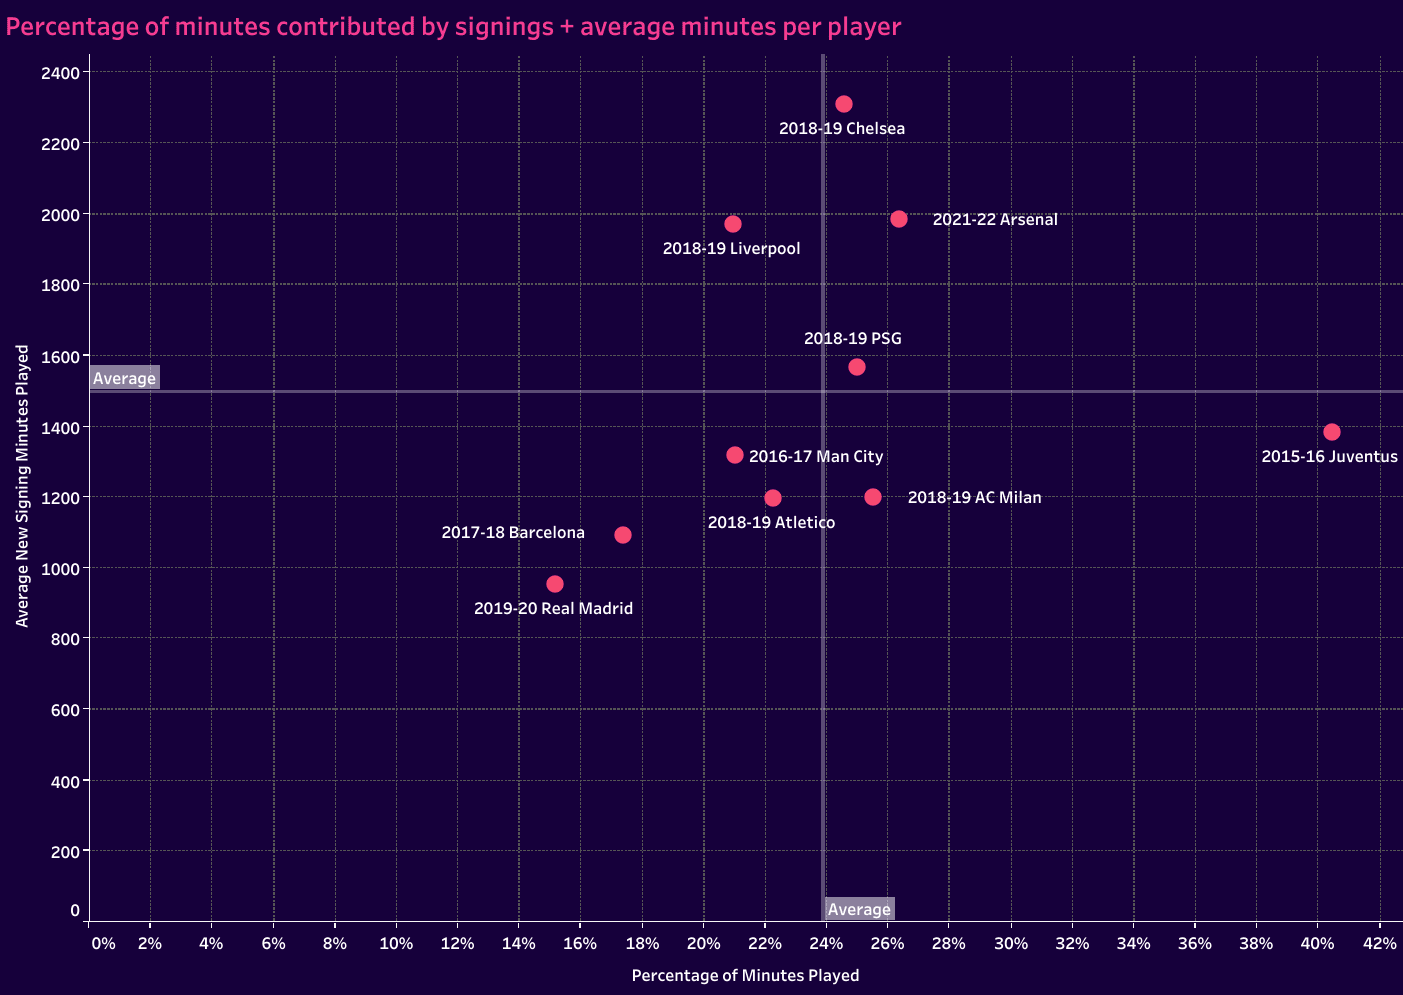
As we look to the first image of the section, which features the number of first-team players to join each club and the percentage of minutes given to the newcomers, it’s important to note that each team had different objectives. For 2015/16 Juventus, their transfer market moves were designed to capture a Champions League title. For 2018/19 AC Milan, the objective was winning Serie A. For a few of the squads on this list, the hope was recapturing league and Champions League titles, which was the target of the 2019/20 Real Madrid squad. The end goal varied from club to club, but the means was the same…use their financial might to eliminate the gap between their present and targeted end point.
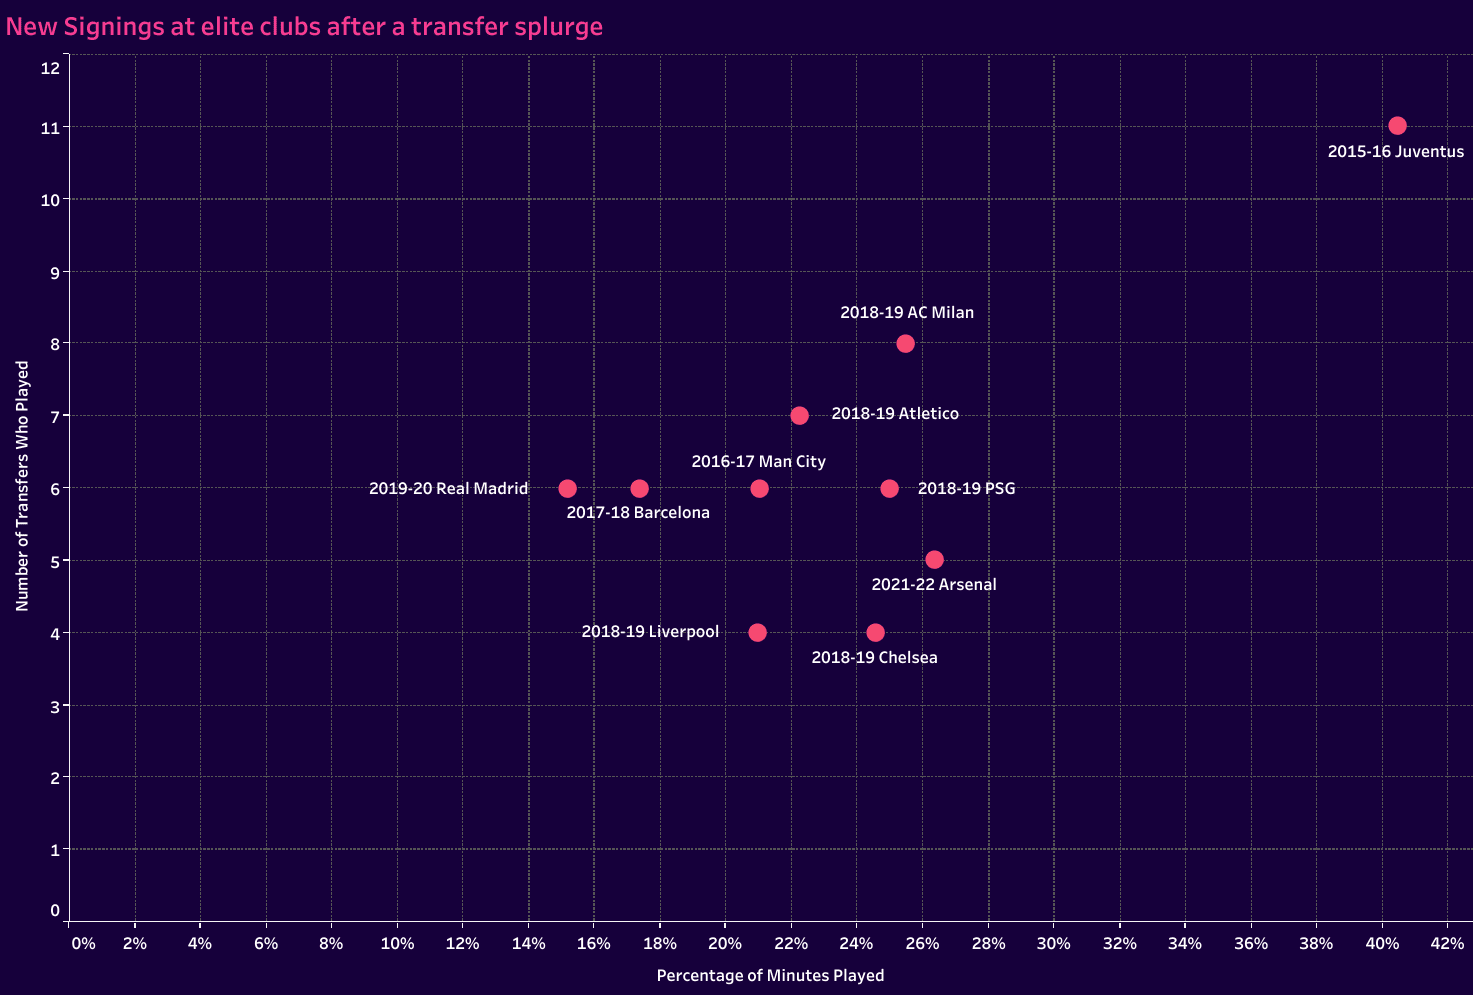
In terms of the percentage of minutes contributed by the new signings, as well as the average number of minutes per player, it’s interesting to note that the English clubs and PSG tended to recruit players who were able to come in and make an immediate impact. The Spanish clubs sit at the other end of the scale with the fewest number of minutes per signing during their debut seasons with the club. Real Madrid and Barcelona also have the lowest percentage of minutes played by their newcomers despite the massive amount of money they spent those seasons.
We won’t look at Champions League finishes for each of these teams, but we will look at their league positioning after their transfer splurges. We want to know if spending money always resulted in improved league positioning. Our third image in the section has each club’s final position in the league table on the right, then on the bottom of the chart we have their finishes the previous season. This gives us a nice before and after picture. At worst, the clubs maintain their status. Even there, only 2018/19 Atlético Madrid does not improve their league positioning. Each of the other nine team saw an improvement (or consecutive title) with two clubs, Real Madrid and Barcelona, improving their status to win the league title.
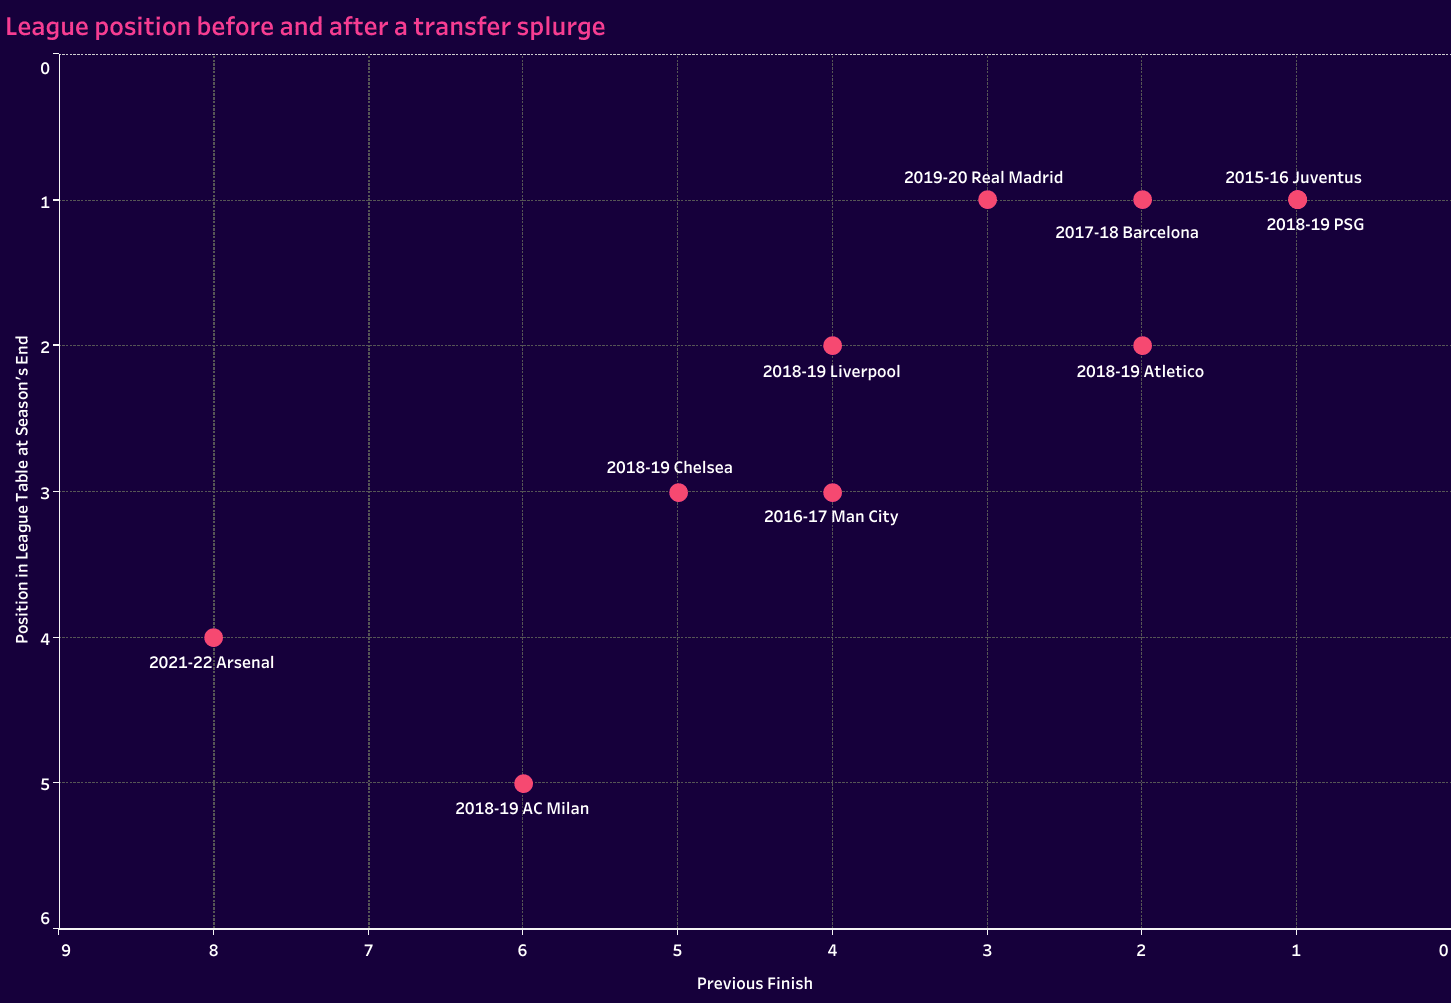
Notice that Juventus and PSG won their respective leagues both before and after spending big in the transfer market. Looking at the results from a different angle, we can also look at each clubs’ point differential as well. That’s what we have in our final image of this analysis, plotting the league table and point differential on the graph.
Only two clubs saw a decrease in total points, 2018/19th Atlético Madrid and 2018/19 PSG. Even there, the decreases are marginal. Four of the 10 teams improved by a minimum of eight points. 2018/19 Liverpool improved by 22 points and 2019/20 Real Madrid finished 19 points higher in their second season post-Cristiano Ronaldo.
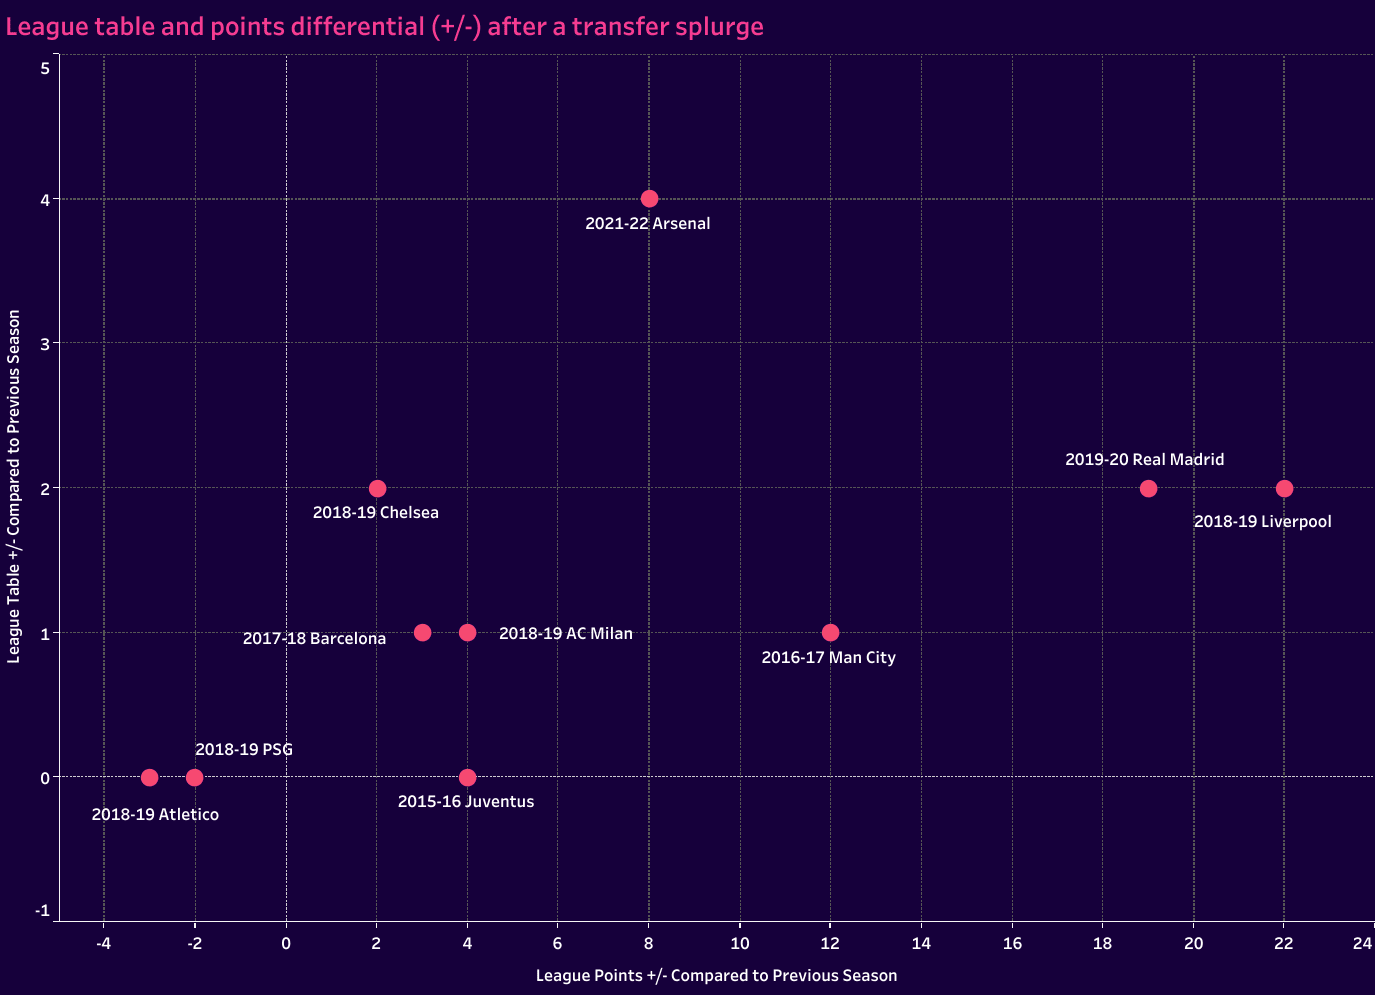
Though spending big in the transfer market doesn’t guarantee a domestic or Champions League title, it almost guarantees an improvement in points and final place in the league table.
We should note that these teams typically spend more money on fewer players as well. The calibre of the incoming players matches the high standards of the incumbents. Few changes are needed as it’s really more of a fine-tuning than a rebuild.
Conclusion
So, will Barcelona win La Liga and compete for the Champions League title this year? Early indications are that they will be in the mix for both. Plus, the data backs up their summer investments. Culés are deservedly excited about the 2022/23 campaign.
But perhaps Barcelona’s predicament is nothing more than mild entertainment for you. Perhaps you’re more focused on whether Bournemouth will stay up or if Girona can secure a second season in La Liga. Maybe you want to know how Venezia can better spend their time in Serie B and make a well-prepared return to Serie A.
As you walk away from this article, you’ll have some objective markers for analysing your favourite club’s transfer activity and the playing time trends within the squad. Cohesiveness is important, but so is the gradual improvement of the team. And let us stress that it is gradual. Remember that even when the biggest clubs on the planet spend big in the transfer market, they are typically looking to improve one to three positions per season. Anything more leaves the team as a whole starting from scratch in terms of developing their game model and understanding of teammates.
So, roster shuffling is a necessary part of maintaining the squad, but too much of a good thing, new faces, can hurt the performances of the team just as much as the refusal to integrate new players. There’s a balance to be had. Balance is key to building.



Comments