Football is firmly in the era of big data and analysis. This follows the trend that began in baseball with the application of sabermetrics known as “Moneyball” in the early 2000s and in basketball with the application of valuing shots known as “Moreyball”. I previously wrote, Premier League Moneyball, about the change towards fewer low-value shots from outside the penalty area in the Premier League and now turn attention to Serie A. Through looking at the statistics is there a trend towards better more efficient shot selection and less low percentage shots in Serie A? Secondly, when did this trend begin?
Moreyball
Daryl Morey of the Houston Rockets in the NBA led the revolution in basketball where he saw the benefit of removing bad shots from the game. The 2011 season was the beginning of Morey going all in on his strategy. He sought to remove bad low percentage mid-range shots. Morey put a value on each shot and sought to maximise high-value shots which are layups and three-pointers. This change in strategy is now so pervasive that it has changed the entire NBA. Three-pointers and layups are the norm across the league.
Football Moreyball
xG, Opta “Big Chances”, shot charts, Statsbomb, etc are omnipresent. All teams and all players now have access to data that shows the value of each shot. The data analysis tells us when it makes sense to shoot and when it makes sense to find a better more efficient option.
Premier League
The Premier League data has shown a clear decline in the total number of shots each season. Also, there is a clear drop in the total number of shots from outside the penalty area each season. Finally, there is a dramatic increase in the number of teams that take less than 40% of shots from outside the penalty area. The shot value data is being coached so that teams are taking fewer shots from outside the penalty area in the Premier League.
Is better shot selection also occurring in Serie A?
Total Shots per Season
The chart below shows the total shots by season for the Premier League. There is a clear steady decline.
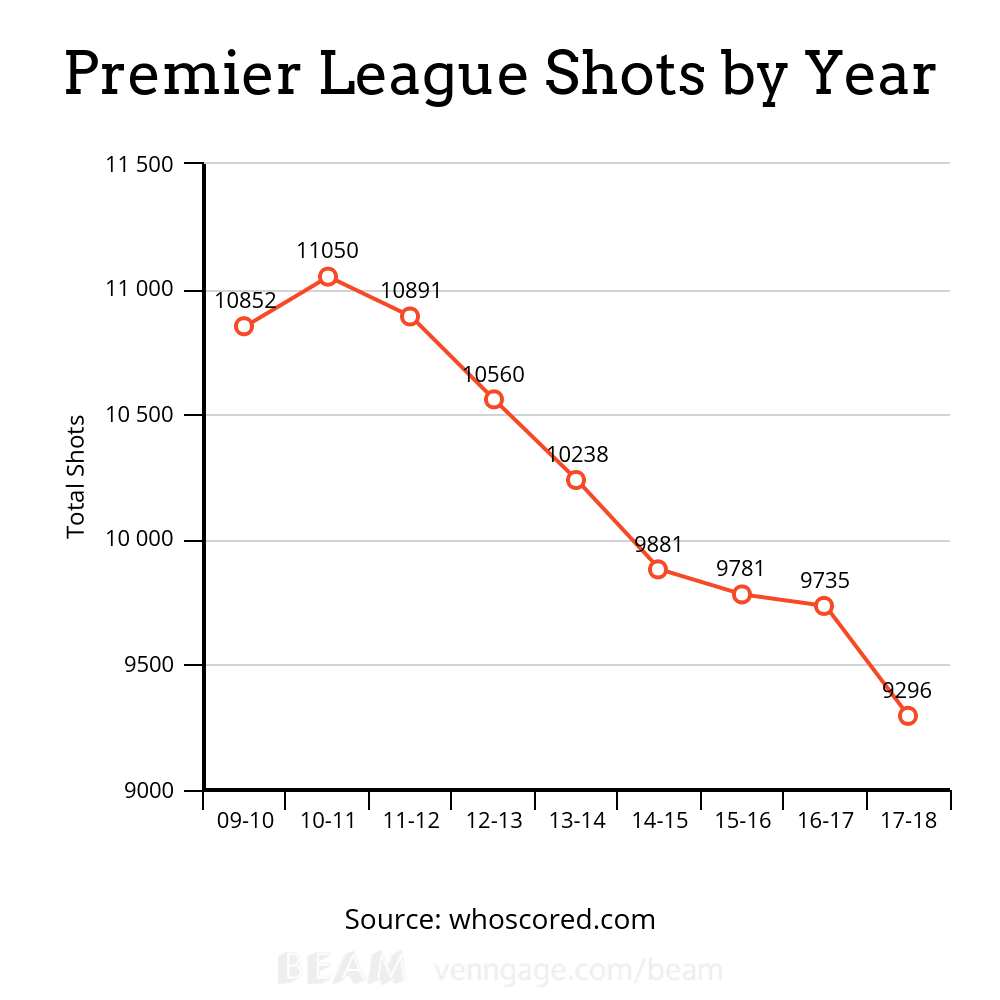
Here is the chart on Serie A shots by year.
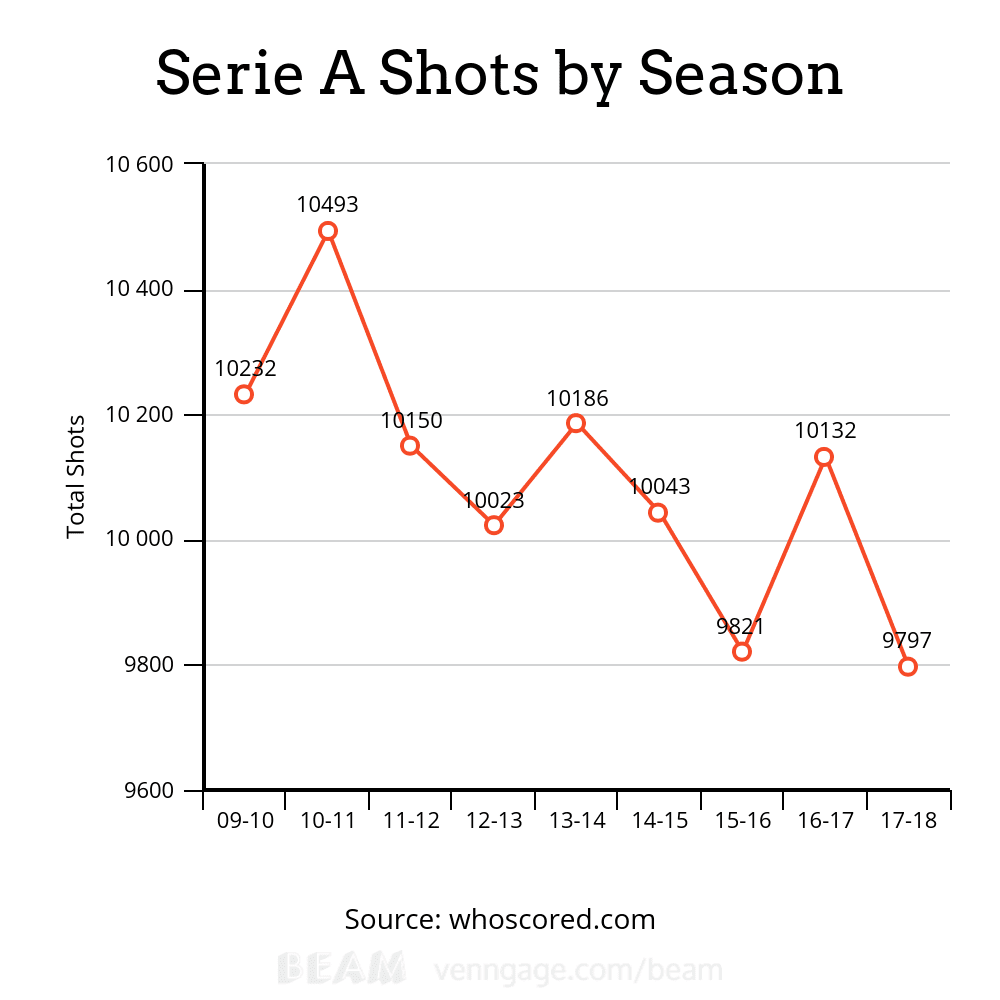
As you can see there is a much different trend line between the two leagues. Serie A has a generally declining trend line, but not nearly as cut and dry as the Premier League.
Shots from Outside the Box
Here is the Premier League chart of total shots taken from outside the penalty area by season.
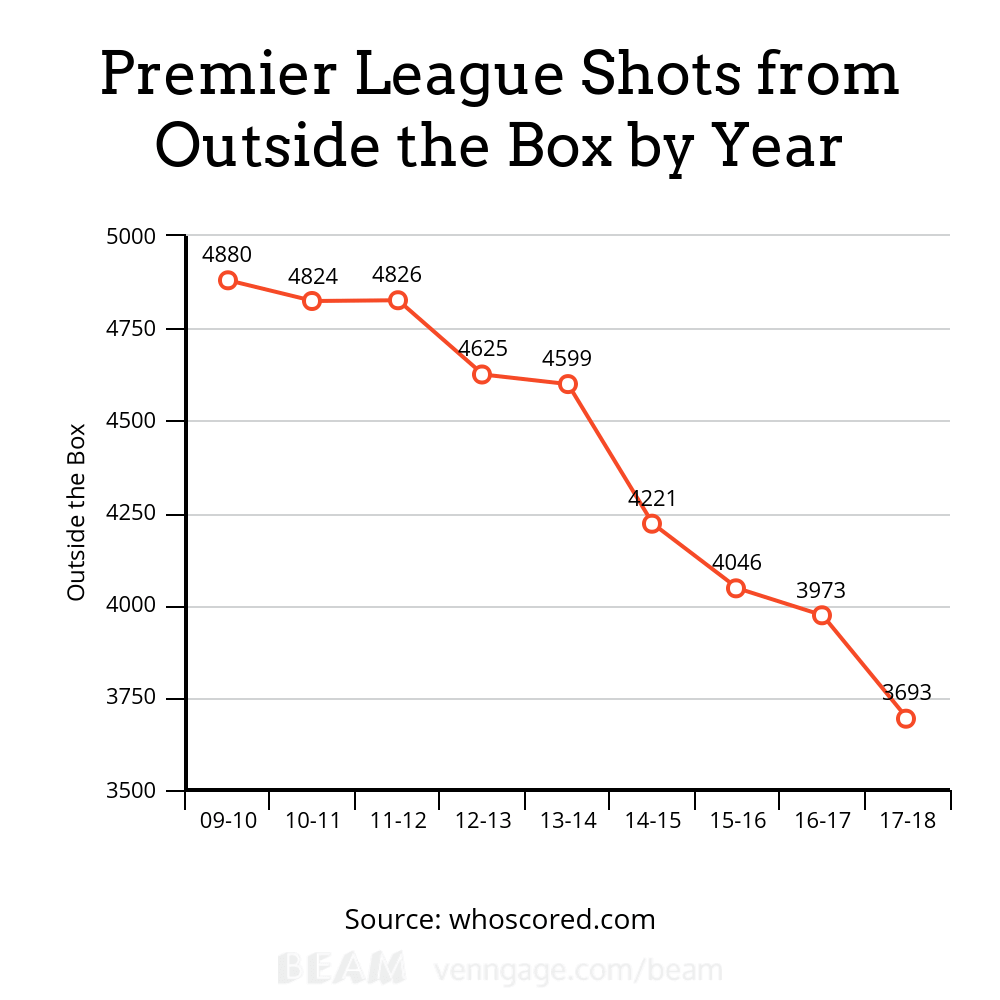
The chart above shows another clean steady decline in the Premier League. The trend line is steeper than the total shots trend line. Less low value outside of the box chances are been taken each season. The largest drop occurs following the 2013-2014 season and the 2016-2017 season.
Below is the Serie A chart of total shots from outside the box by year.
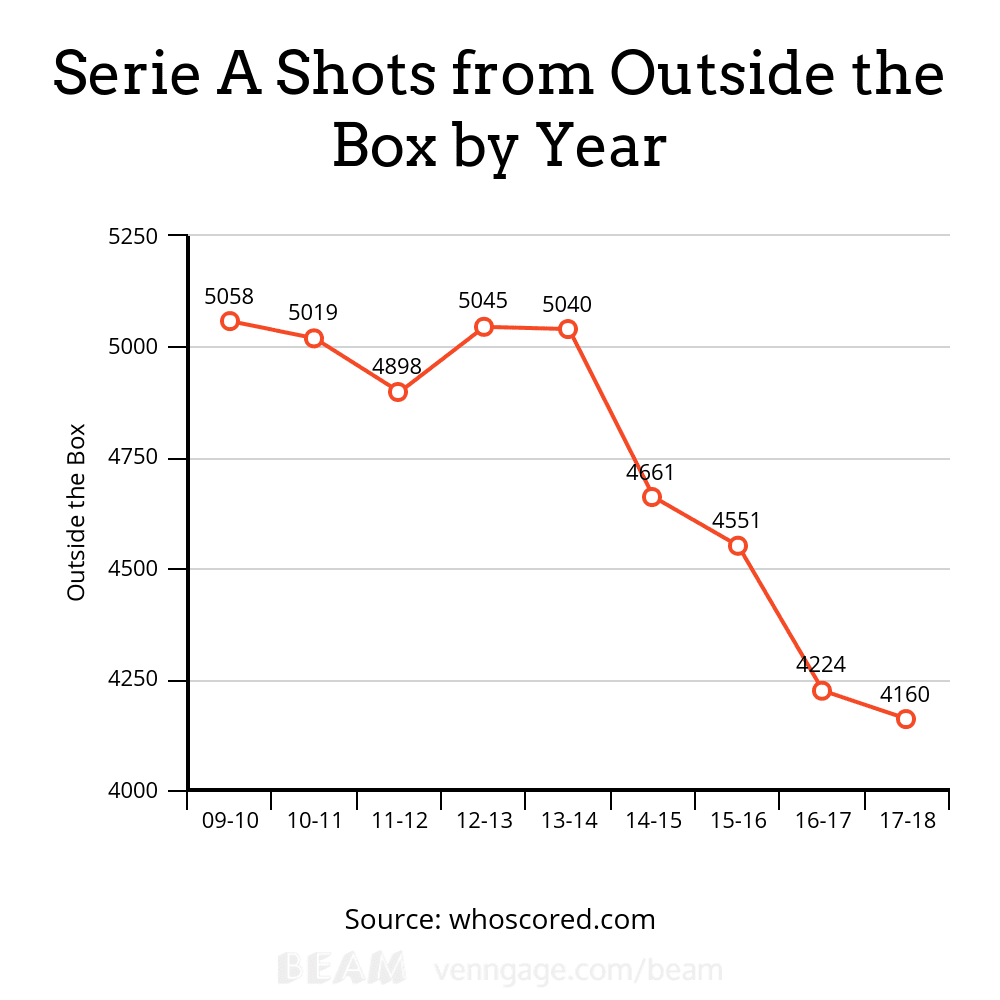
Serie A shows a steep decline after the 2013-2014 season and another sharp decline after the 2015-2016 season.
From the 2013-2014 season to the 2017-2018 season there is a precipitous drop in the number of shots taken from outside the box for both leagues. The data for the Serie A and Premier League outside the box shots mirror each other.
The Premier League number of shots from outside the box have declined 19.6% from the 2013-2014 season to the 2017-2018 season. The Serie A number of shots from outside the box have declined 17.5% from the 2013-2014 season to the 2017-2018 season. That is a drastic decline in the number of low-value shots.
Less than 40% of Shots from Outside the Box
The outside of the box data shows a clear decrease in low-value shots in both leagues. In 2013-2014 Premier League season, 45% of all shots were from outside the penalty area. This had decreased to 39.8% in the 2017-2018 season. The Serie A had 49.5% shots from outside the box in 2013-2014 with a decrease to 41.9% in 2017-2018. If a team is under 40% of shots being from distance that indicates a deliberate shot selection.
Let’s look at the number of teams that take less than 40% of shots from outside the box in each league. This will indicate how pervasive among the teams this trend of taking less outside the box shots.
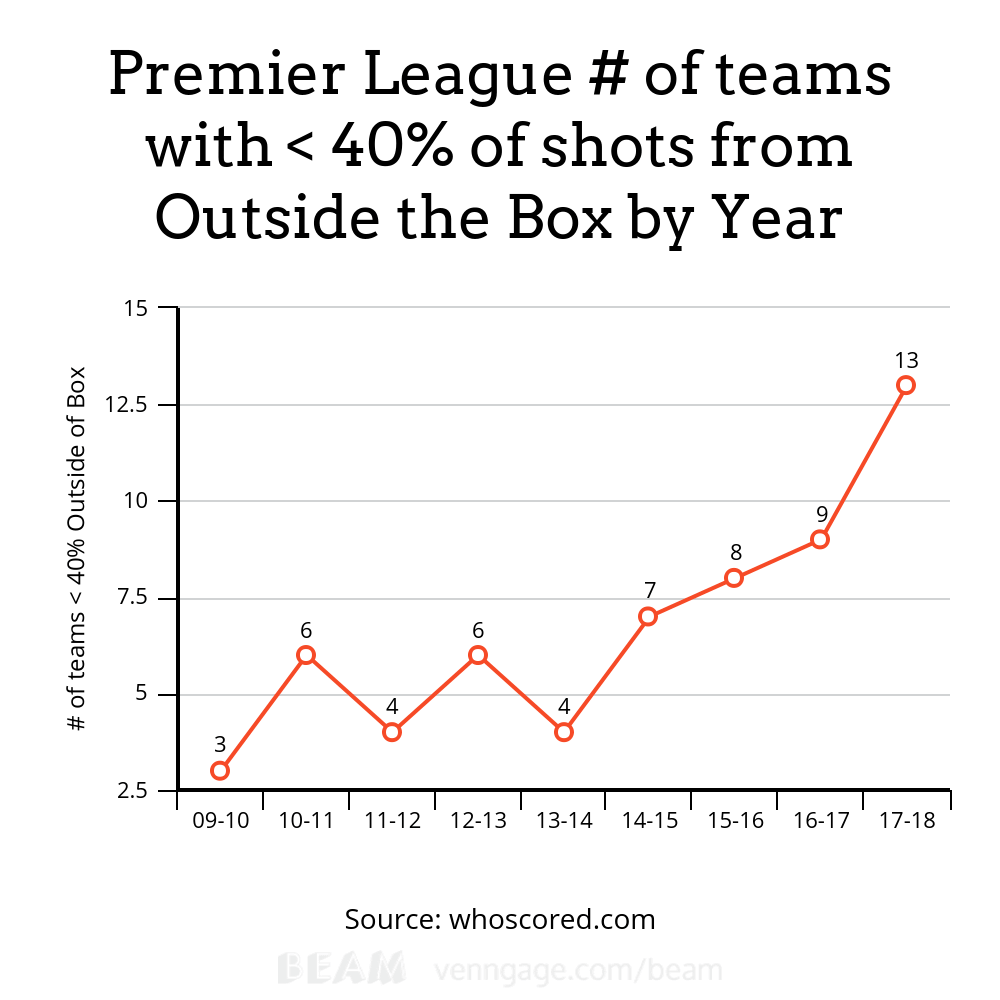
The Premier League shows an orderly trend of more teams dropping below the 40% mark for shots from outside the box. These teams show a clear intention in shot selection. In the 2017-2018 season, a majority of teams took less than 40% of shots from outside the box.
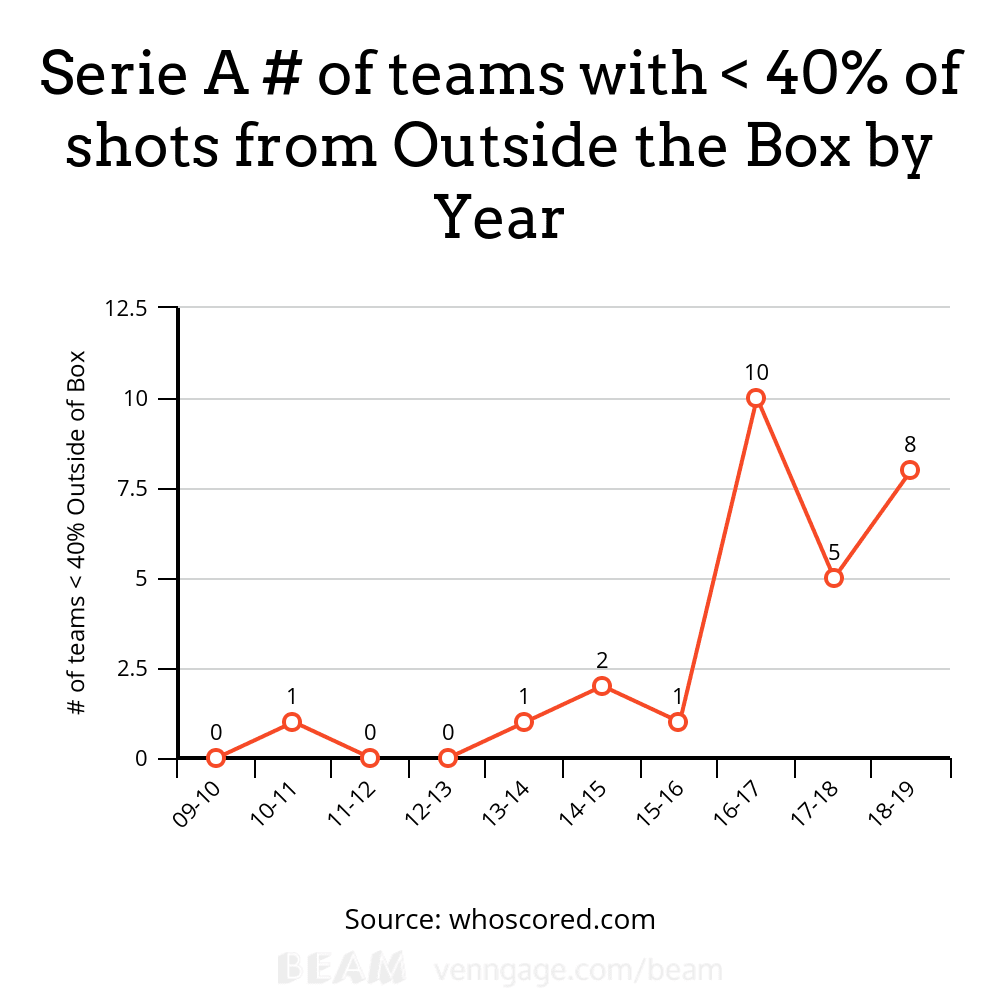
Serie A shows a dramatic uptake in teams with less than 40% of shots from outside the box. From season 2015-2016 to season 2016-2017 the count went from 1 to 10! Serie A teams are broadly looking for more high-value shots since the 2013-2014 season.
When Did This Happen?
The data shows that the shot selection improvement began in both leagues after the 2013-2014 season. This time frame not surprisingly coincides with the advent of xG.
Sam Green posted a blog for OptaPro on April 12th, 2012 that entitled “BLOG: Assessing the performance of Premier League goalscorers”. In the blog, Sam Green explains a model for Expected Goals (xG).
“This report aims to show how OptaPro can define what makes a good chance as opposed to an average one, which players are more effective than the quality of their chances would suggest and how goalkeepers’ performance can be measured effectively.”
Prior to Sam Green’s blog post expected goals was in its infancy in ice hockey but virtually not found in football. Google search for “expected goals” in reference to individual football shots is non-existent prior to Sam Green’s post. After his blog, more data analysis went into valuing football shots. Since the 2013-2014 season, there has been a steady march of better data modelling and clear application of the data on the playing pitch.
Conclusion
Tactical analysis has happened since the first kick of a ball. Most of it was based on the eye test and instincts of coaches and players until the recent era of big data and data analysis. Since the 2013-2014 season, the Premier League and Serie A have seen a coinciding change in shot selection. Teams across both leagues are clearly putting resources into the value of a shot. Placing a value on each shot taken and coaching shot selection is a great concrete area where data and coaching intersect.
If you love tactical analysis, then you’ll love the digital magazines from totalfootballanalysis.com – a guaranteed 100+ pages of pure tactical analysis covering topics from the Premier League, Serie A, La Liga, Bundesliga and many, many more. Get your copy of the FIRST of two December issues for just £4.99 here or preorder the SECOND of the December issues with an annual membership right here.




Comments