The USA’s NCAA college soccer scene is a world unto its own.
Arguably the highest level of amateur football in the world, it offers its student-athletes an opportunity to continue playing the game they love at a high level while earning their university degree.
Many schools can also provide facilities that rival anything you’ll find at the professional ranks.
In fact, some of the more prominent Division 1 schools are on par with football’s elite in terms of the facilities and staffing they offer.
If we were to poll NCAA college soccer players, asking if they would love the opportunity to advance from NCAA college soccer to professional football, most would take the chance on themselves and give a resounding “yes.” Granted, who wouldn’t? While it is amateur football, NCAA soccer, across all three divisions, features former players from the semi-pro ranks (think 2nd or 3rd divisions) and even youth internationals.
There’s quality in the American college soccer system, and it’s largely untapped.
This data analysis is the start of a series on NCAA Division 1 college soccer.
In this article, we’ll start by identifying playing styles through data.
Looking at non-conference games, defined early in the next section, we’ve used Wyscout’s database to help clubs and scouts identify which programs are at the top of the game and play a similar style.
For the college coaches reading this article, it will also give some insight into how to use Wyscouts statistical database to scout opponents.
This analysis will also include a look at how the college game relates to professional leagues in the USA and Europe, the two most common destinations for American college soccer players.
One last point, you’ve surely noticed and maybe cringed at the sighting of “soccer.” Don’t worry; you’ll endure.
To distinguish between football and NCAA football (the American variant), the use of soccer will refer to the NCAA rendition of the game.
Identifying the top attacking teams
Let’s start this data analysis with a look at attacking statistics.
Each of the statistics comes directly from Wyscout and encompasses non-conference play in 2022.
For anyone unfamiliar with the NCAA college soccer system, most teams will play 16 to 20 matches during their regular season.
Those matches are split between conference and non-conference opponents.
Larger conferences or those with home and away setups will play more in conference matches and fewer out-of-conference.
On the flip side, if a conference has 10 teams, it’s often to see an even split between the two types of games.
Conference games are constants from year-to-year while non-conference opponents are entirely at the volition of the coaching staff.
You can load up with a difficult out-of-conference schedule or target weaker teams to boost your win total, albeit at the cost of killing your strength of schedule rating, which impacts national tournament selection.
Non-conference matches count toward a team’s overall record, which has implications if you reach the NCAA national tournament, a knockout competition with a very similar setup to NCAA basketball (March Madness).
Conference matches count towards your conference playoff seeding.
The winner of the conference playoffs has an automatic qualification spot in the national tournament.
Additional teams from your conference could make it to the tournament if their record and strength of competition are high enough, but the only way to guarantee a spot in the national tournament is to win your conference tournament.
For this data analysis, we’re looking specifically at the non-conference matches.
The way Wyscout segments the statistics, they have data available for most D1 teams, but the listing is segmented into non-conference or conference.
We wanted to include as many teams as possible in this data analysis without going through the monotony of downloading over 200 sets of season statistics.
The majority of the teams feature 7 to 10 matches worth of data.
We’re using that information in most of the report, though you will see a visualisation in the next section that pulls season-wide data from the top conferences in the country.
We’ll be sure to point it out.
Let’s start with a more general look at last season’s performances, plotting goals for and against.
That will set the scene for the remainder of this analysis, highlighting top and bottom performers and some other programs in between.
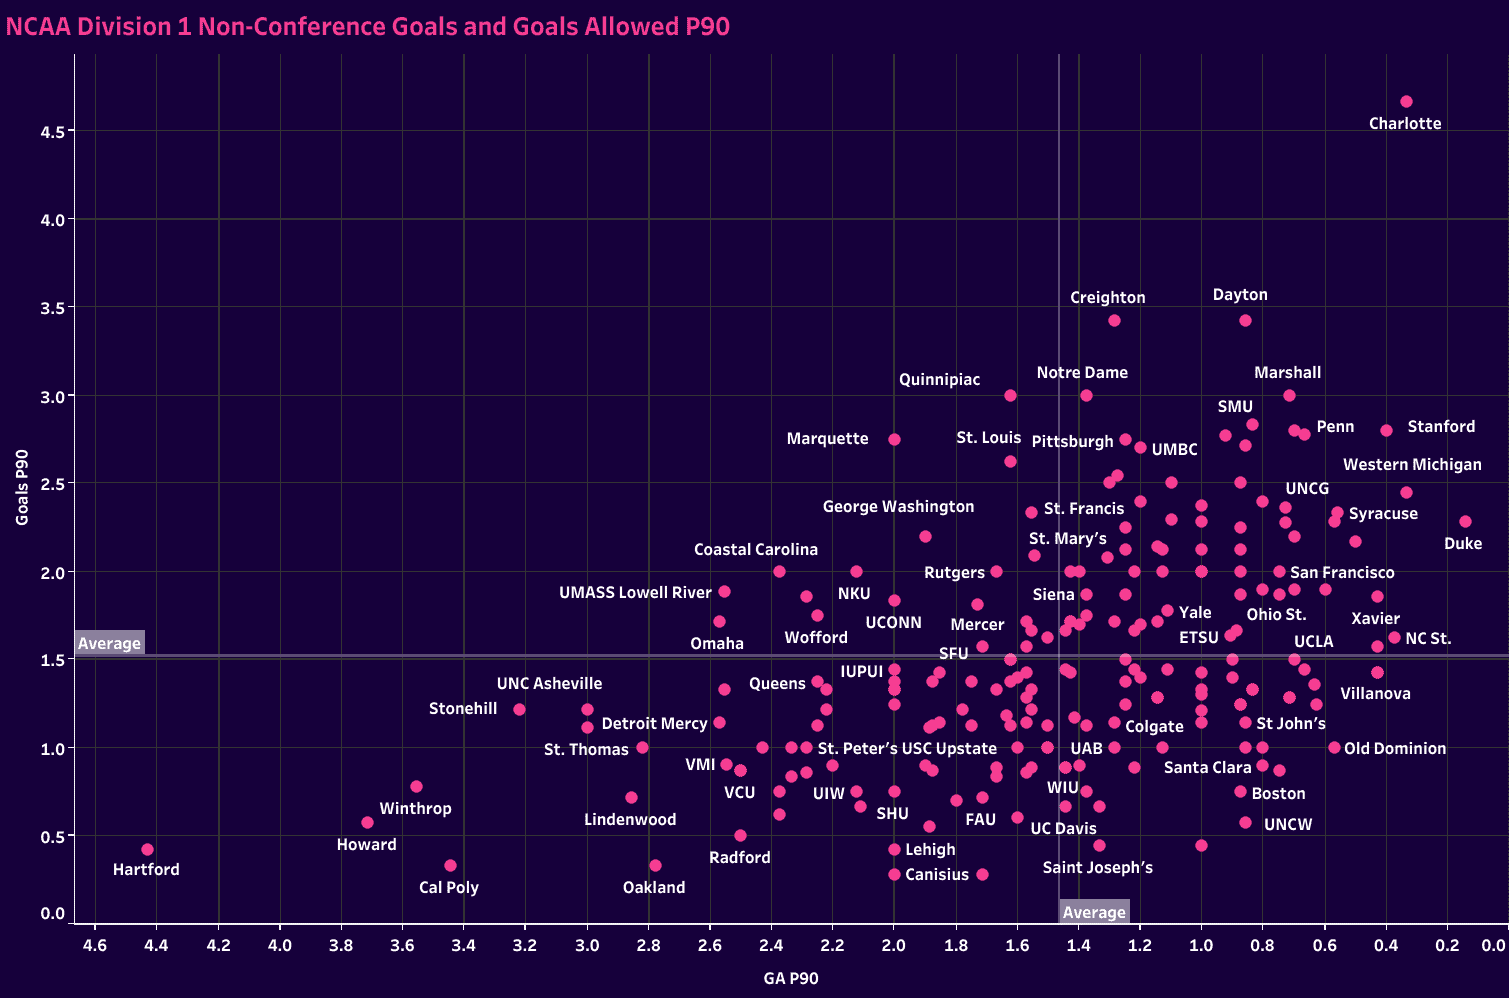
The goals for and against visualisation is designed to identify top performers in the top right quadrant and the other end of the scale at the bottom left.
UNC Charlotte was the clear standout in this chart, far outpacing the competition with 4.67 goals P90 in their non-conference schedule.
You can also see some of the traditional powerhouses trailing them.
Stanford, Syracuse (the 2022 national champion), Duke and Creighton all performed well.
Marshall, the 2020 national champion, is up there as well.
It’s time to turn to how these teams construct play.
This is where Wyscout data can give the individual programs, as well as clubs and scouting agencies, an idea of each team’s attacking tendencies.
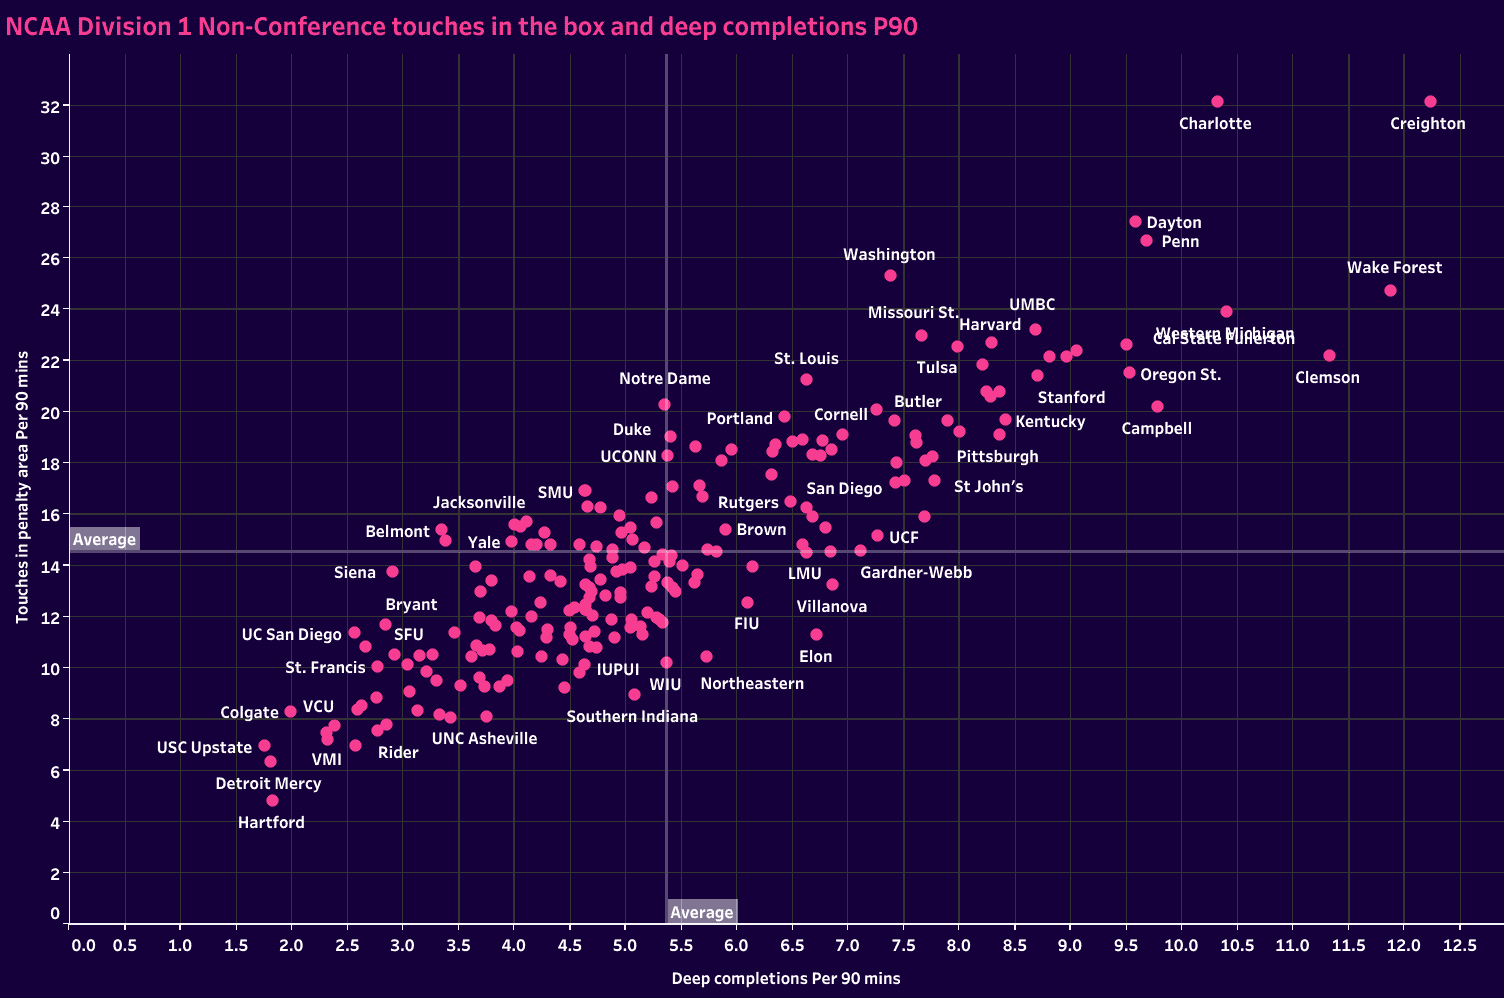
Touches in the penalty box and deep completions P90 serve as an excellent bridge between the goals chart and the ones to follow in that it shows us which programs take a more attacking approach and succeed in getting into the box.
Creighton is the standout on this chart, followed by Charlotte and Wake Forest.
Clemson, the 2021 national champions, also rate well, as do mid-major programs like Western Michigan, Dayton, Penn and Cal State Fullerton.
When teams get into the final third and prepare to attack the box, we also want to know how they plan to generate their scoring opportunities.
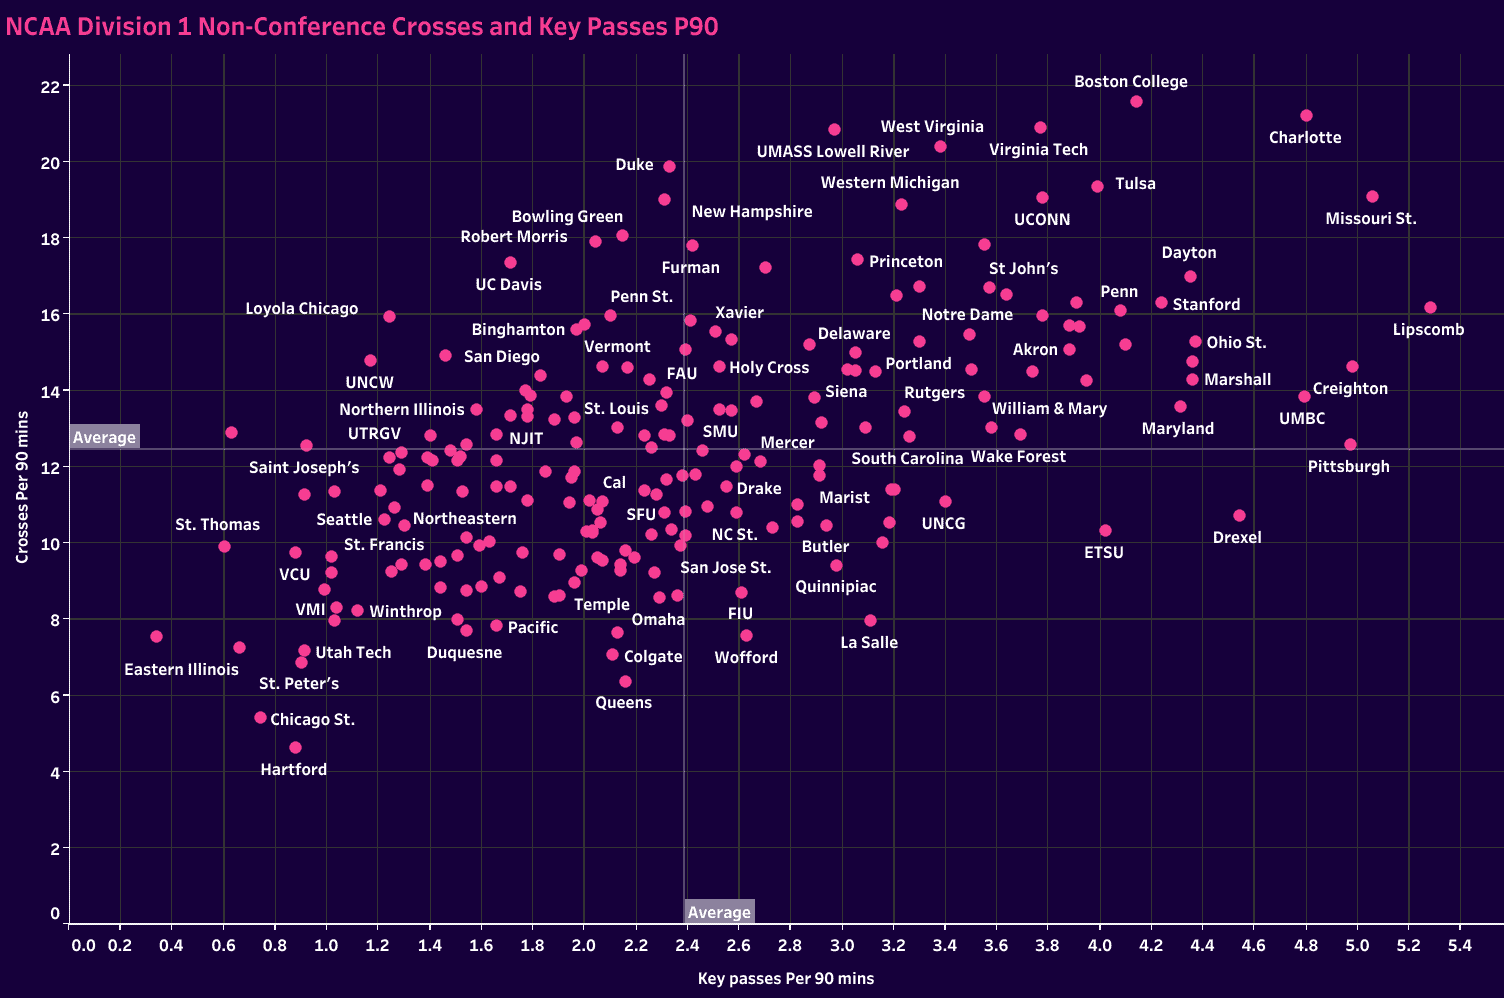
A combination of crosses and key passes shows us how they attack the box.
Are they targeting crosses or working their way into the box and using more precise passes to generate shooting opportunities?
Charlotte again places well, holding a spot near the top of both metrics.
Boston College and Missouri State also perform well, while Virginia Tech and Lipscomb show exceptional marks in one category and above average in the other.
Let’s continue working backwards from the goals.
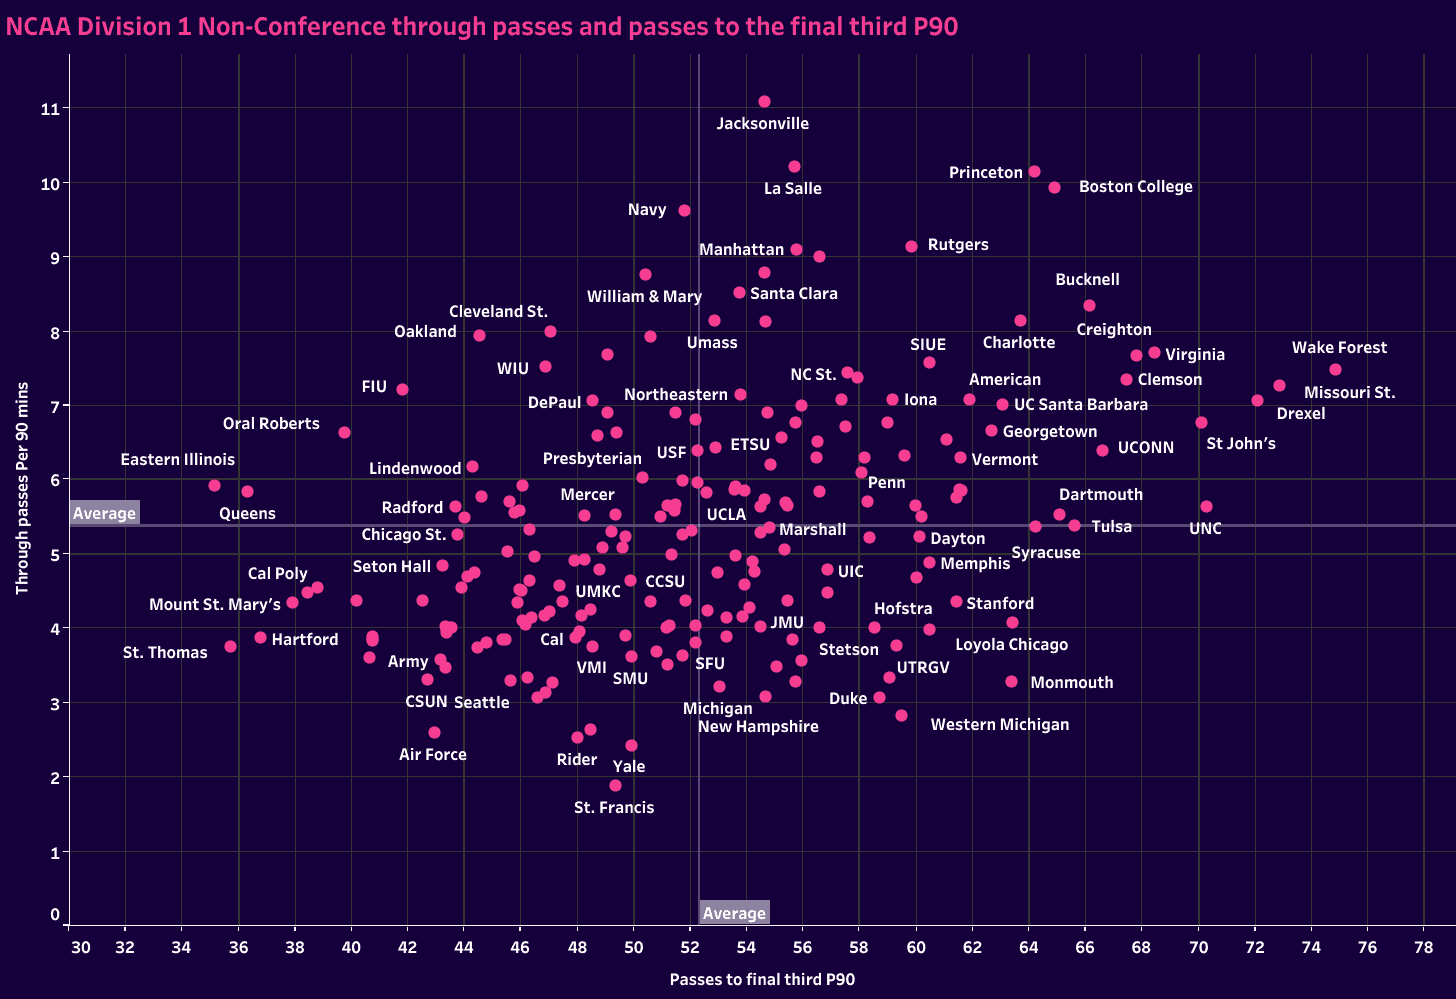
How do these teams get into the box? Charting through balls and passes to the final third gives us a sense of the tempo with which these teams will look to enter the box.
Teams high on through balls but low on passes into the final third are more likely to play in behind early before defences get behind the ball and tighten up centrally.
Teams with more passes to the final third and through balls are likely coming up against more pragmatic opponents.
Then you get those with a blend of the two, like Princeton, Boston College and Wake Forest.
Often in the collegiate game, you’ll find that the teams that send a high number of through balls per match are also the most likely to resort to a more direct style.
Whether playing off a target #9 or playing behind into onrushing forwards, any incorporation of the midfield tends to be very simple.
Plotting long passes against total passes P90, or finding the ratio between the two, gives us a sense of which teams are going to knock it long and hope for the best versus those that incorporate a higher level of precision into their tactics and are more likely to play through the thirds.
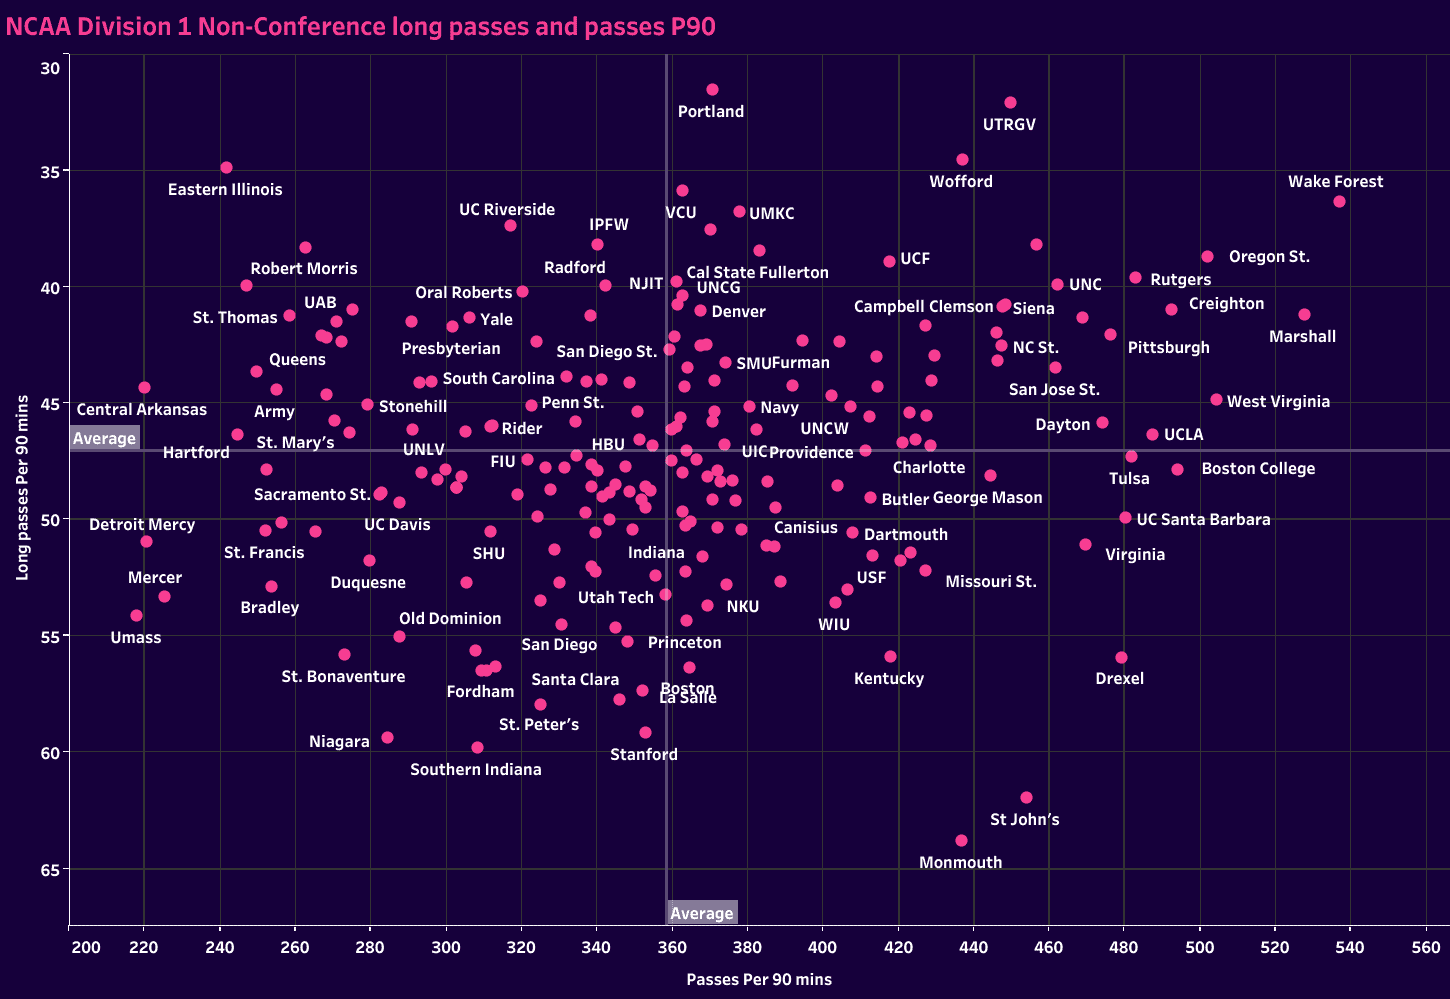
On the far right of the data set, several big programs, such as Pittsburgh, UCLA, West Virginia, Creighton, and Marshall, have found a nice blend of the two.
Wake Forest, Rutgers, Oregon State and UNC have some of the highest long pass usage in Division 1, but they are also among the leaders in passes P90, which provides some tactical balance.
The teams on this end of the scale also require extensive video scouting.
Knowing that they circulate the ball quickly but also have a tendency to look long, opposing coaching staff must identify the conditions that these teams are looking for to cue the long pass.
The final attacking scatter plot looks at how often teams use 1v1 in dribbling to progress and how successful they are at it.
Clemson, Hofstra and Cal State Fullerton have the best metrics; you can see several big schools recruit and use dynamic individual dribblers.
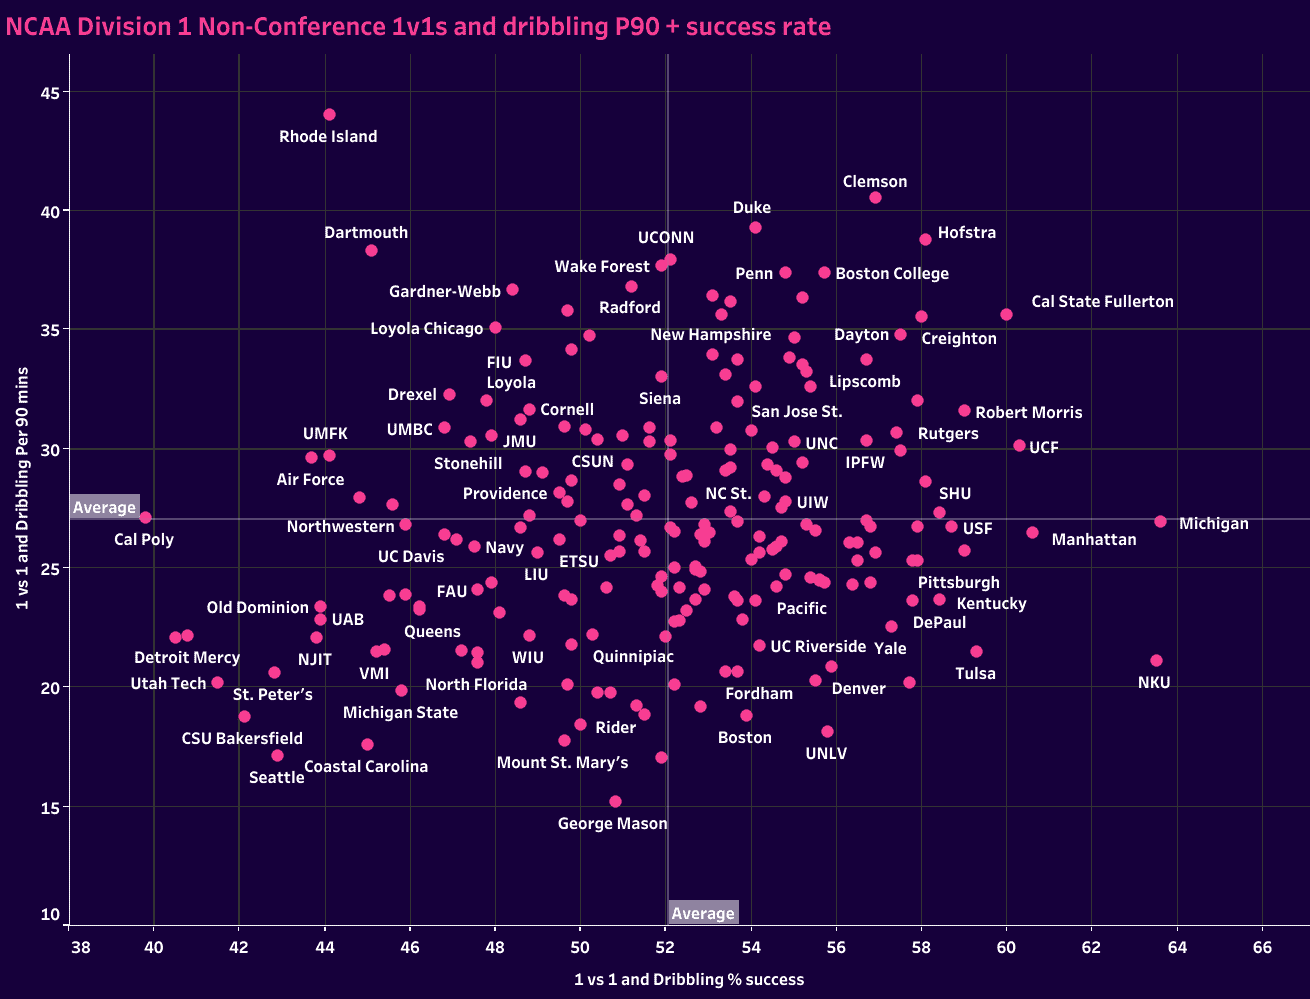
Again, video scouting is necessary to determine who the dribblers are and when/where their team is most likely to use them, but the data does give us a concrete view of which teams are most likely to use that path forward.
Defensive styles in NCAA D1 college soccer
The attacking section heavily focused on which teams successfully scored goals and got into the box, as well as some general patterns for progression and attacking the box.
Those were specific metrics designed to pinpoint how teams are likely to advance the ball.
The defending statistics section is a little bit different.
It will still have metrics that are specific to the defensive phases, but, on the whole, defensive stats offer a numbers-based analysis with a general approach to defending.
Stats like PPDA (passes per defensive action) are an excellent measure of how aggressively a team counterpresses.
But other stats, such as interceptions and 1v1 defending duels, must be taken with a grain of salt.
In fact, they are probably better when assessing individual players rather than the team collective.
As you’ll see in some of these metrics, some teams just have to defend more.
Be it a qualitative disadvantage or simply the way the game model is designed, it puts more of an emphasis on the defensive aspects of the game.
Let’s start with PPDA to see which teams aggressively counterpress versus which are either likely to drop off or are poorly positioned for a robust defensive transition.
In the graph below, we have plotted PPDA for and against.
It gives us a general idea of the tempo of each team’s matches and the defensive transition statistics we want.
Marshall is an excellent example of a team that counterpresses very aggressively, yet generally see opponents sit deeper in their organised, compact block.
West Virginia, Creighton, Boston College and Virginia are in very similar situations.
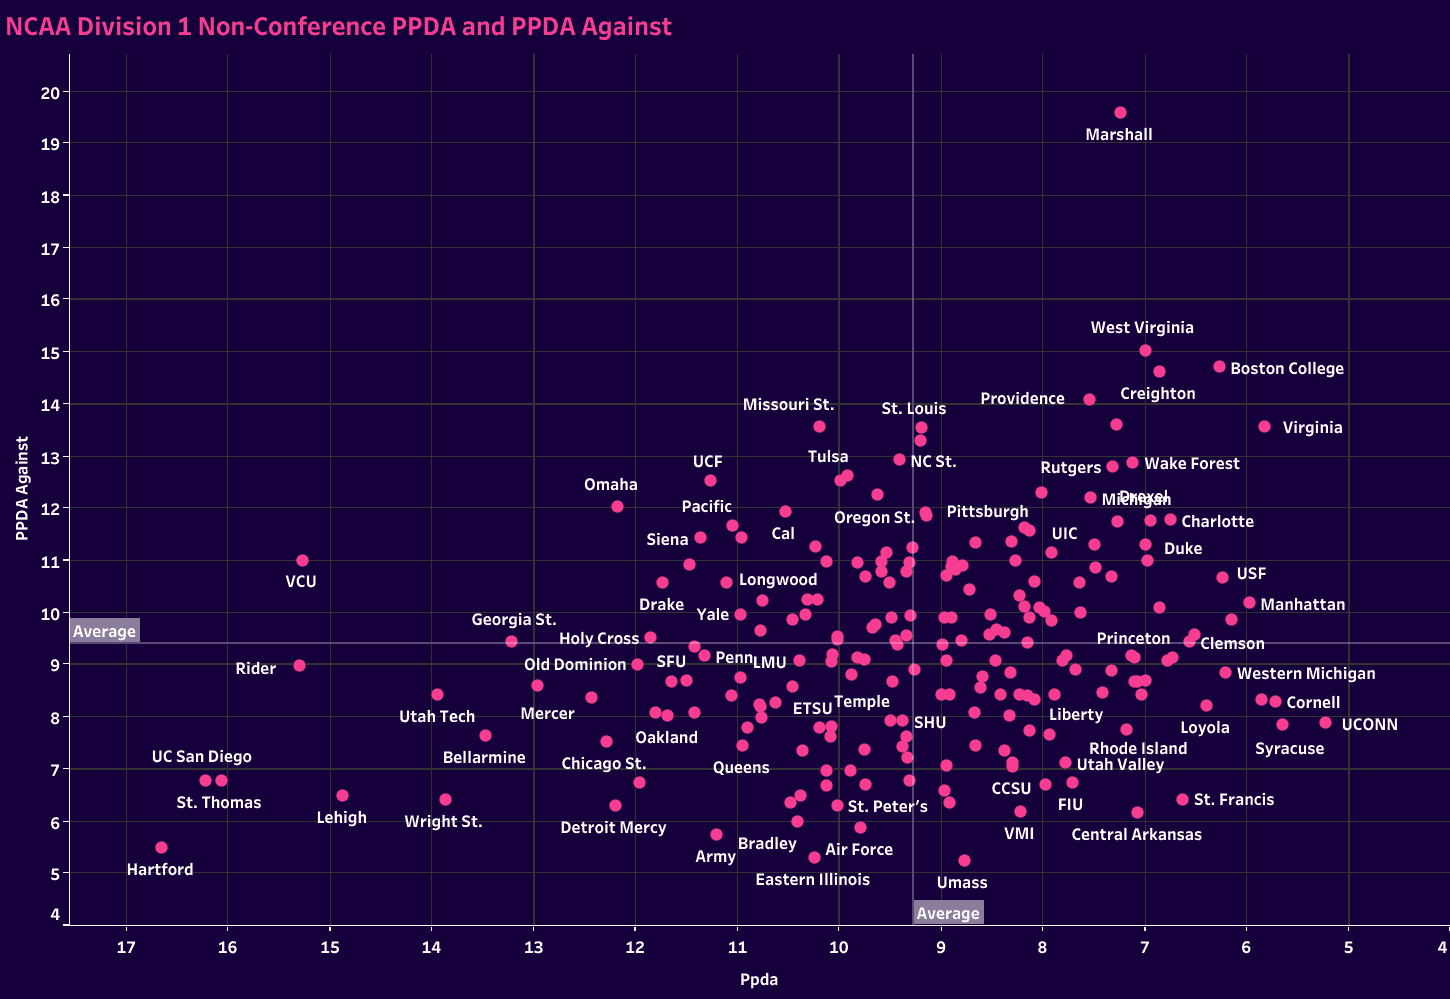
At the other end of the scale, schools like Hartford, St Thomas, UC San Diego and Lehigh are less likely to counterpress and more likely to suffer from an aggressive opposition counterpress.
Based on the numbers, those are teams you want to get after in defensive transitions.
PPDA is an excellent metric for showing a team’s tendencies and defensive transitions.
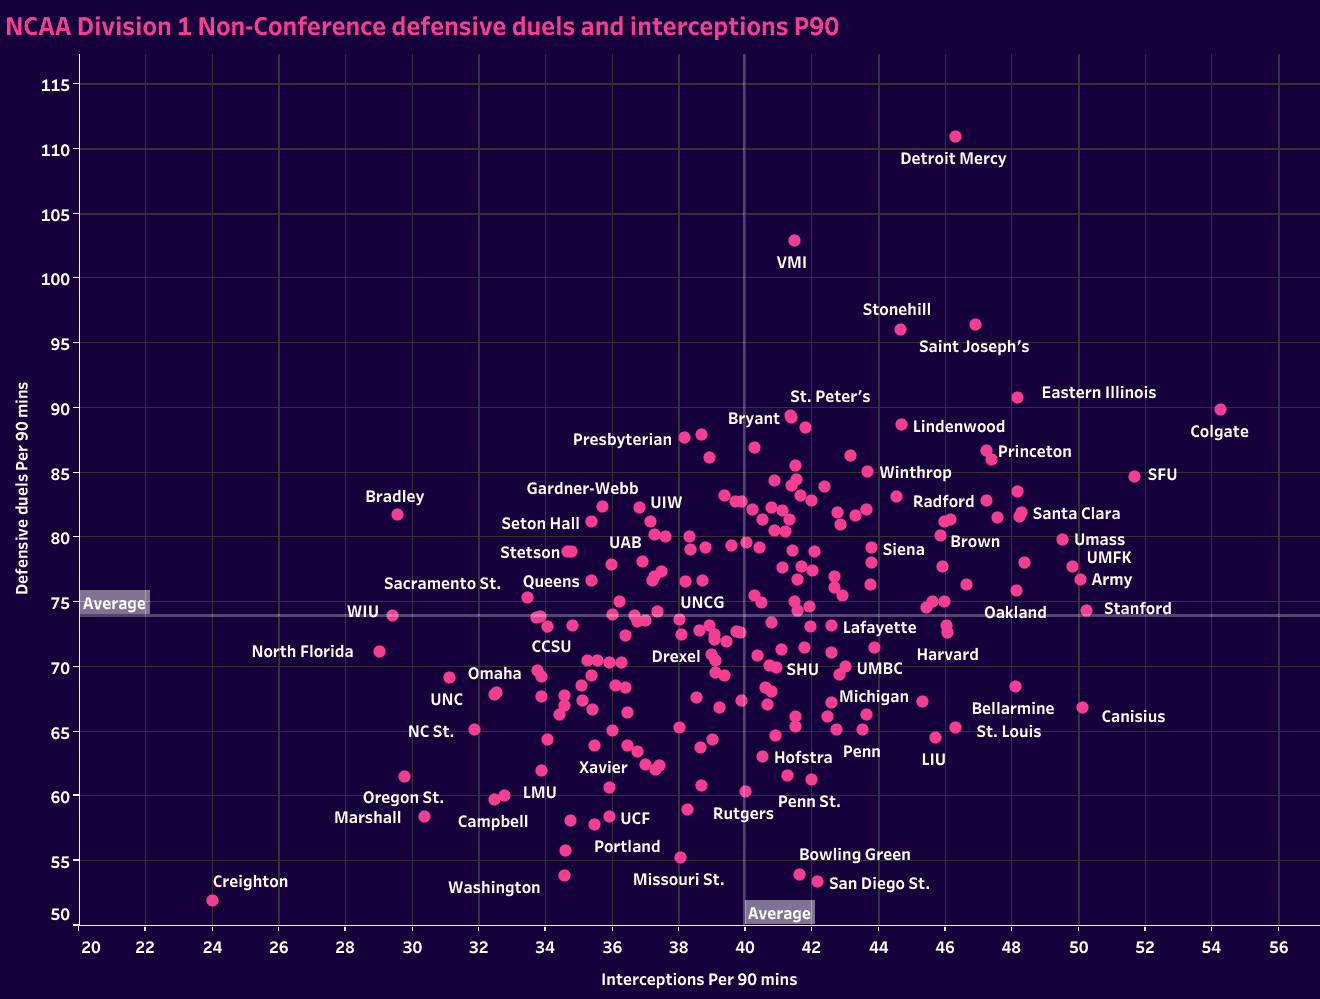
As mentioned above, defensive duels and interceptions P90 don’t offer as much insight.
That said, it does give an idea of which teams spend the greater share of the game defending.
Detroit Mercy, VMI, Stone Hill and St.
Joseph’s are in a class of their own in terms of interceptions and defensive duels P90.
That’s a bad thing, in large part, and means the game is taken to their squads.
The strength of schedule can undoubtedly influence the amount of different defending a team does, but to end up in that quadrant of the analysis is a reflection of attacking versus defending initiative.
You’ll notice a lot of top teams are below the average line in defensive duels P90 and scattered across the interceptions P90 line, though perhaps with a slight trend towards the bottom left quadrant.
Now, to this point, all of our statistics for this data analysis have come from the non-conference statistics in Wyscout.
We didn’t want to download 200+ spreadsheets.
What we did do is download spreadsheets for the top conferences in the country.
Some very notable teams are missing from this group, such as UNC Charlotte, Marshall and Missouri State.
Still, we do have a really strong group below, one that typically dominates the MLS SuperDraft.
The reason we downloaded the spreadsheets for these teams, which is very doable for college coaches who want to keep a running database throughout the season, is so that we could add more complete statistics to our data analysis.
That includes some categories that appear exclusively on team pages, not in the general league tab.
One of those precious statistics is recoveries, broken into high, medium and low.
Looking at the schools from these top conferences, we set out to find which teams are most effective in high and medium presses.
More specific information correlates defending in a portion of the field, offering insights that tackles and interceptions can’t.
Each of these metrics is on a P90 basis.
It should come as no shock that Syracuse, the 2022 NCAA Division 1 national champion, lands at the top right of the graph.
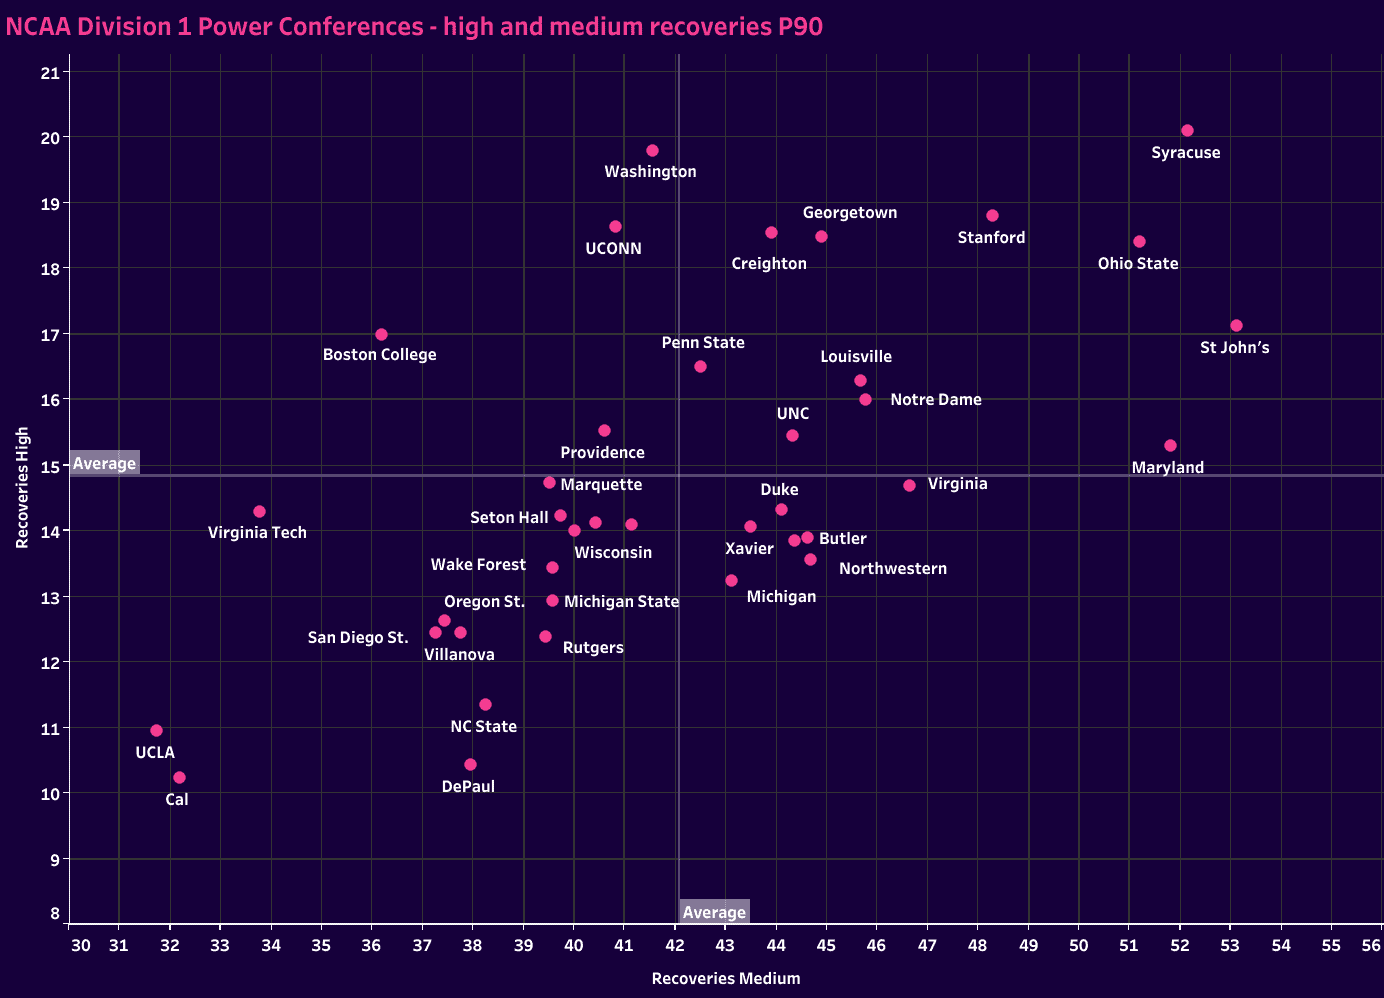
Don’t take this as an assessment of the quality of a team’s defence.
It’s simply a reflection of their approach to defending.
Notice that Wake Forest, Duke and UNC, some of the top schools in the nation, are very close to the mean in both categories.
UCLA also had a good season yet found themselves in the bottom left quadrant.
Video scouting is still necessary, but the statistics offer concrete insights to kick-start the opposition scouting process.
If I know that Syracuse will aggressively press us high up the pitch, I need to have a plan to break their press.
How does NCAA D1 soccer relate to the global football scene?
NCAA soccer is an amateur division.
Approximately 44,000 registered players span all three divisions, with over 12,000 playing Division 1.
From the inside, I can tell you with certainty that Division 1 and Division 2 actively recruit players from the highest available non-professional leagues globally.
One very successful Division 2 team I know of has an excellent recruitment network that allows them to pull players from the Spanish third division.
That’s where they get most of their squad.
Many Americans and players from abroad take the university path primarily for the degree while still playing at a high level.
The facilities at some of these universities are the icing on the cake.
This is especially true when the university has a high-revenue American football or basketball program.
The revenue generated from those other sports allows the university to build world-class sporting facilities.
Few professional clubs can compare with the training facilities at the Division 1 level, especially the schools that participate in the top conferences.
As one prominent Division 1 head coach told me, “I have a nicer office than Jürgen Klopp.”
A lot of money is tied to bringing quality players into the NCAA soccer system.
Many of these players would also like to continue their playing careers beyond university life.
With most graduates ranging from 22 to 25 years old, they have the physical and tactical development to try their luck at the professional ranks.
Now, these players are not ready to make the leap into a top league like the EPL or La Liga.
Look at Jack Harrison’s pathway at Leeds.
The Wake Forest alumnus made the jump to MLS in 2016 when he was drafted (another American oddity) by NYCFC.
The United States City Group affiliate then sold him to Manchester City before sending him along his professional trajectory at Leeds.
Harrison helped Leeds push through the ranks before arriving in the EPL in 2020.
Harrison’s pathway is an excellent model for a top American NCAA soccer player to progress into the world of the football elites.
Each year, roughly 10% of players progress from the MLS SuperDraft to first-team minutes in a given year.
Those aren’t necessarily starters’ minutes or regular first-team action.
That’s any degree of minutes.
Most drafted players are either released or sent out on loan to USL championship or USL League 1 sides.
They need a year or two in the second or third tier before progressing to MLS, provided they make it at all.
USL teams can fill out most of their roster with former NCAA soccer players.
As the league has grown in status, especially the Championship division, they have increased their scouting network to include non-domestic players.
However, the college soccer system is still the bread and butter of the USL.
And that got us thinking, which other leagues would benefit from improved scouting of NCAA soccer?
To discover potential pathways for the best university players in America, we’ve taken some averages from across the USA and Europe, the most likely destination for college soccer players.
In addition to plotting league averages, we’ve also included five NCAA soccer teams for perspective.
The two finalists at the Division 1 ranks, Syracuse and Indiana, are included, as are Oregon State, a side that rates near the 50th mark in the Massey Ratings, St John’s, who rate further down the list near 100, and one of the top recurring sides from our data analysis, UNC Charlotte.
As someone who receives his full-time employment as an NCAA soccer coach and has spent three years as an analyst in the pro game and four years writing tactical analysis, one of the most significant differences between NCAA soccer and the professional ranks is tempo.
NCAA soccer is played at a breakneck pace — the primary reason…virtually unlimited subbing.
In the first half of matches, once a player comes off, they cannot go back on.
You can carry as many players as you’d like on your bench, so if you take 24 to a game, you are within the rules to play 24 different players in the first 45 minutes.
Most teams will go to their 15th players, and many will even sub on the 17th or 18th players.
The starters only need to give 25 to 30 minutes before coming off.
In the second half, each player is allowed one re-entry.
I’ll let you do the math, but if each player who starts can come off the pitch and re-enter and their subs can enter, come off and then re-enter later in the half, there’s an obscene amount of subbing in NCAA college soccer games.
Because of those substitution rules, a new wave of players is brought on the moment the tempo drops.
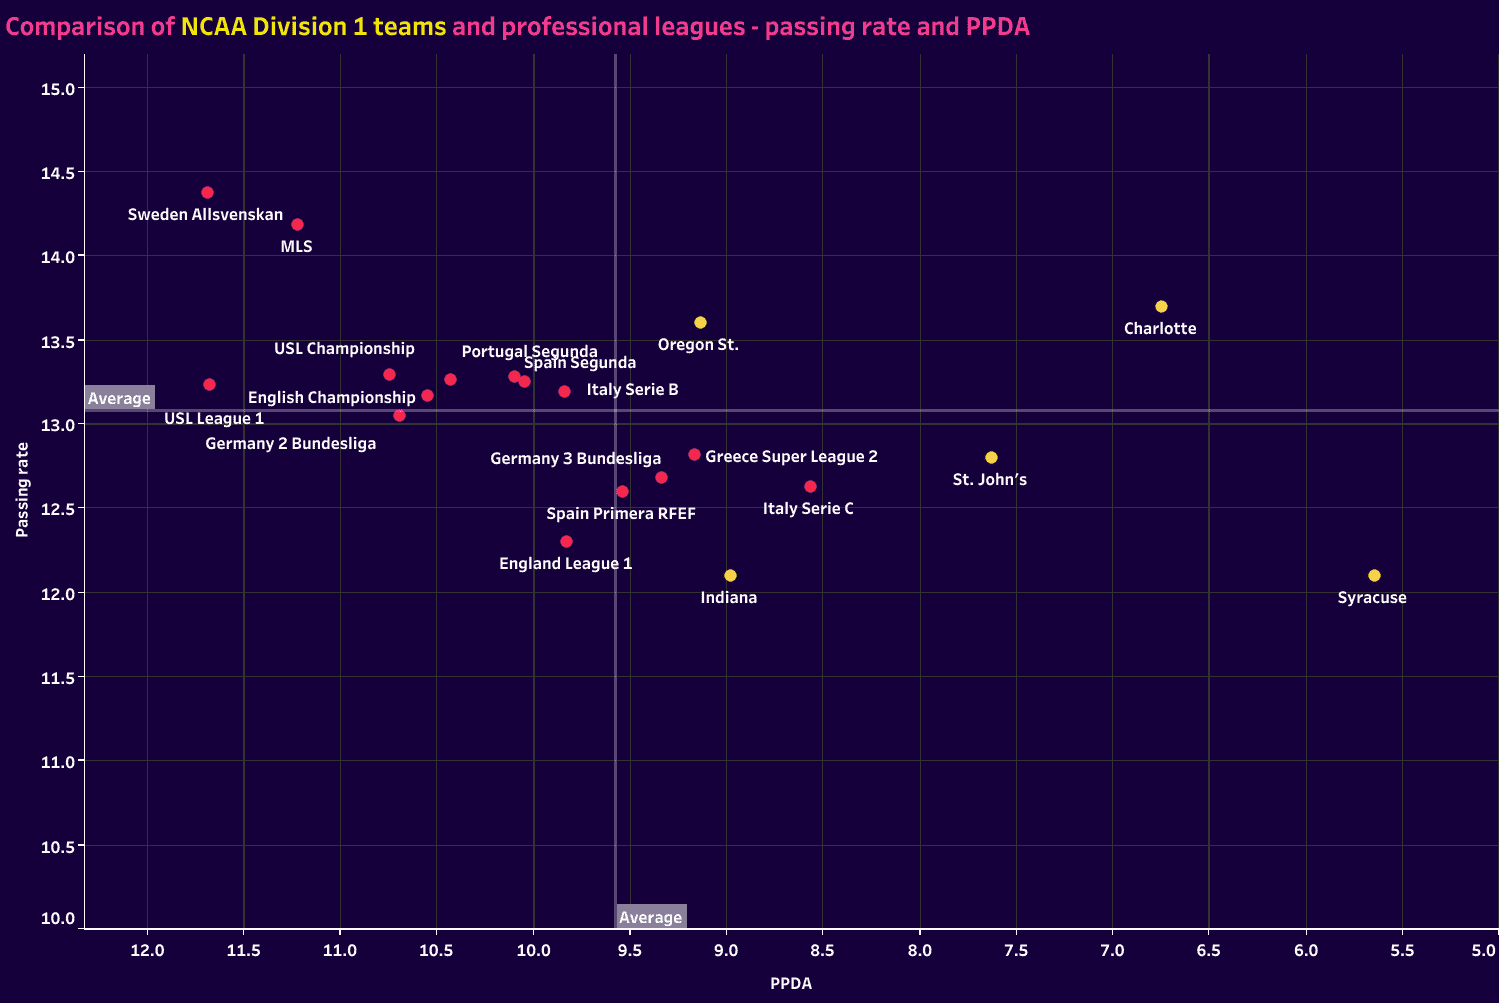
And we can see that with the PPDA and passing rate statistics.
Syracuse, Charlotte and St John’s are well ahead of each professional league listed.
Even Oregon State and Indiana only trail Italy’s Serie C.
Meanwhile, if you look at MLS, the English Championship and the Swedish Allsvenskan, all included to add high-end perspective to the data set, passing rates are high while PPDA is significantly lower.
There’s more structure in the defensive phases, requiring opponents to play more precision in the attacking phases.
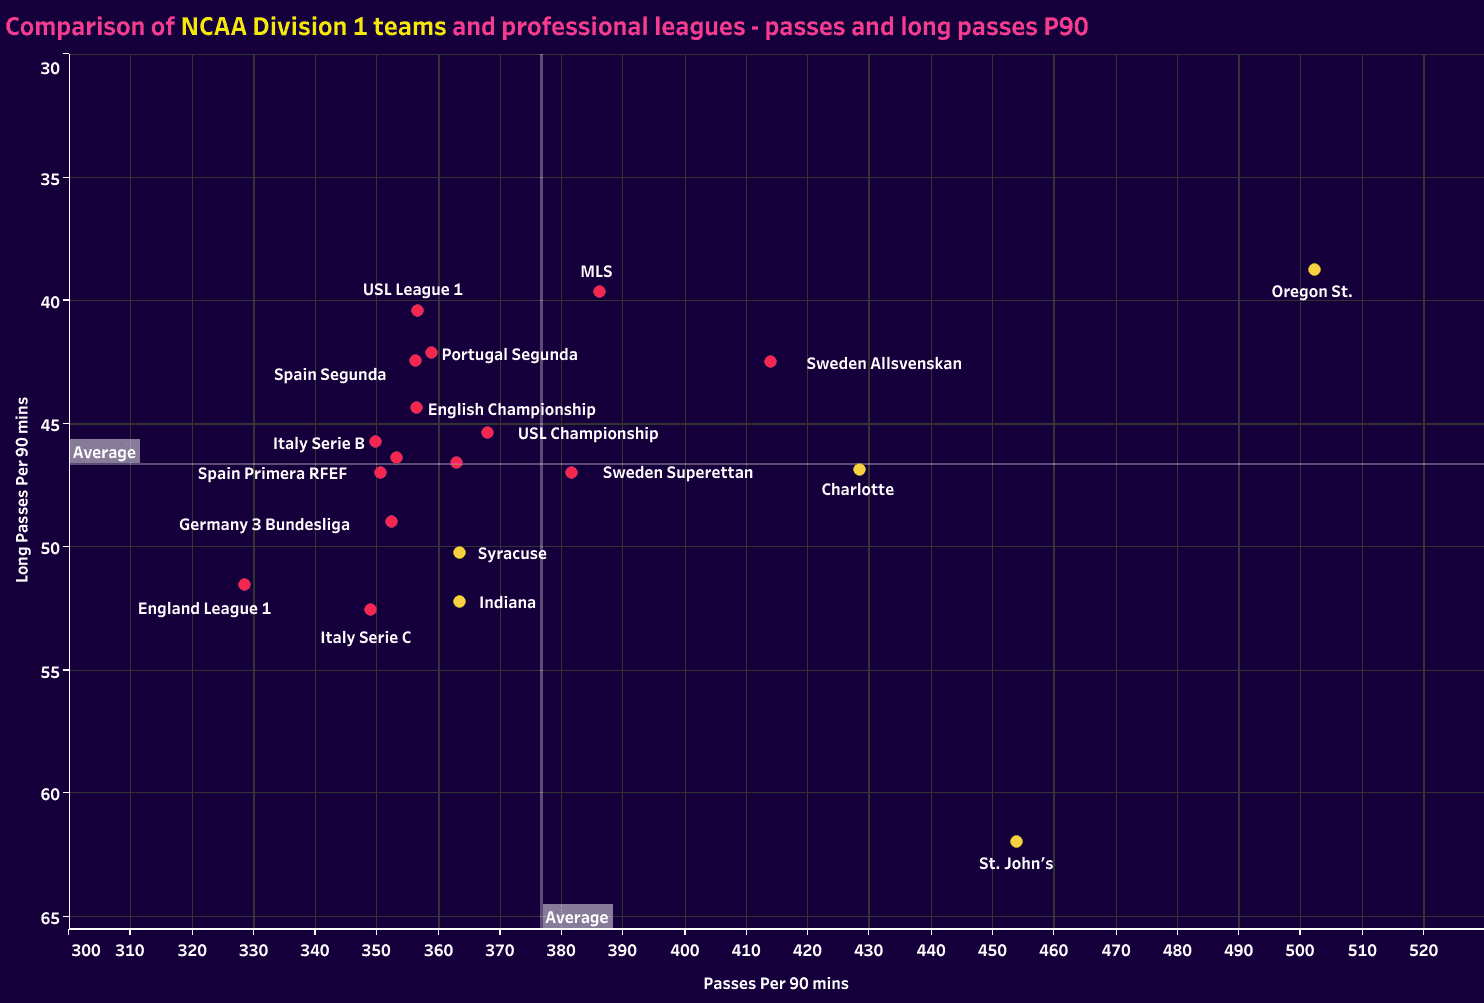
The difference in tempo can also be seen in the number of passes played per game.
Oregon State is well ahead of the crowd while also playing fewer long passes than any of the professional leagues listed.
St.
John’s is second in passes P90, but they also send the most long balls per match.
Charlotte finds a nice balance, playing more passes per game than each league listed while sending the median number of long balls.
One of the reasons for the passing volume in the American University game is the tempo, but the second is another peculiarity of college soccer, which is a stopped clock.
We simply play more football than any professional league.
The clock continues to run for throw-ins and most free kicks, but when a goal is scored, substitutions are made, an injury occurs, or a team is wasting time, the clock stops.
We don’t have injury time, so when the time expires, the game is over regardless of what transpires, which is the downside to the strict clock enforcement.
That said, it’s not uncommon for NCAA soccer games to have the ball in play for 75 minutes, approximately 15 minutes longer than any professional league.
That does skew the data in college soccer’s favour, but the general tendencies of each team can give an idea of player scouting direction and potential player fits at the next level.
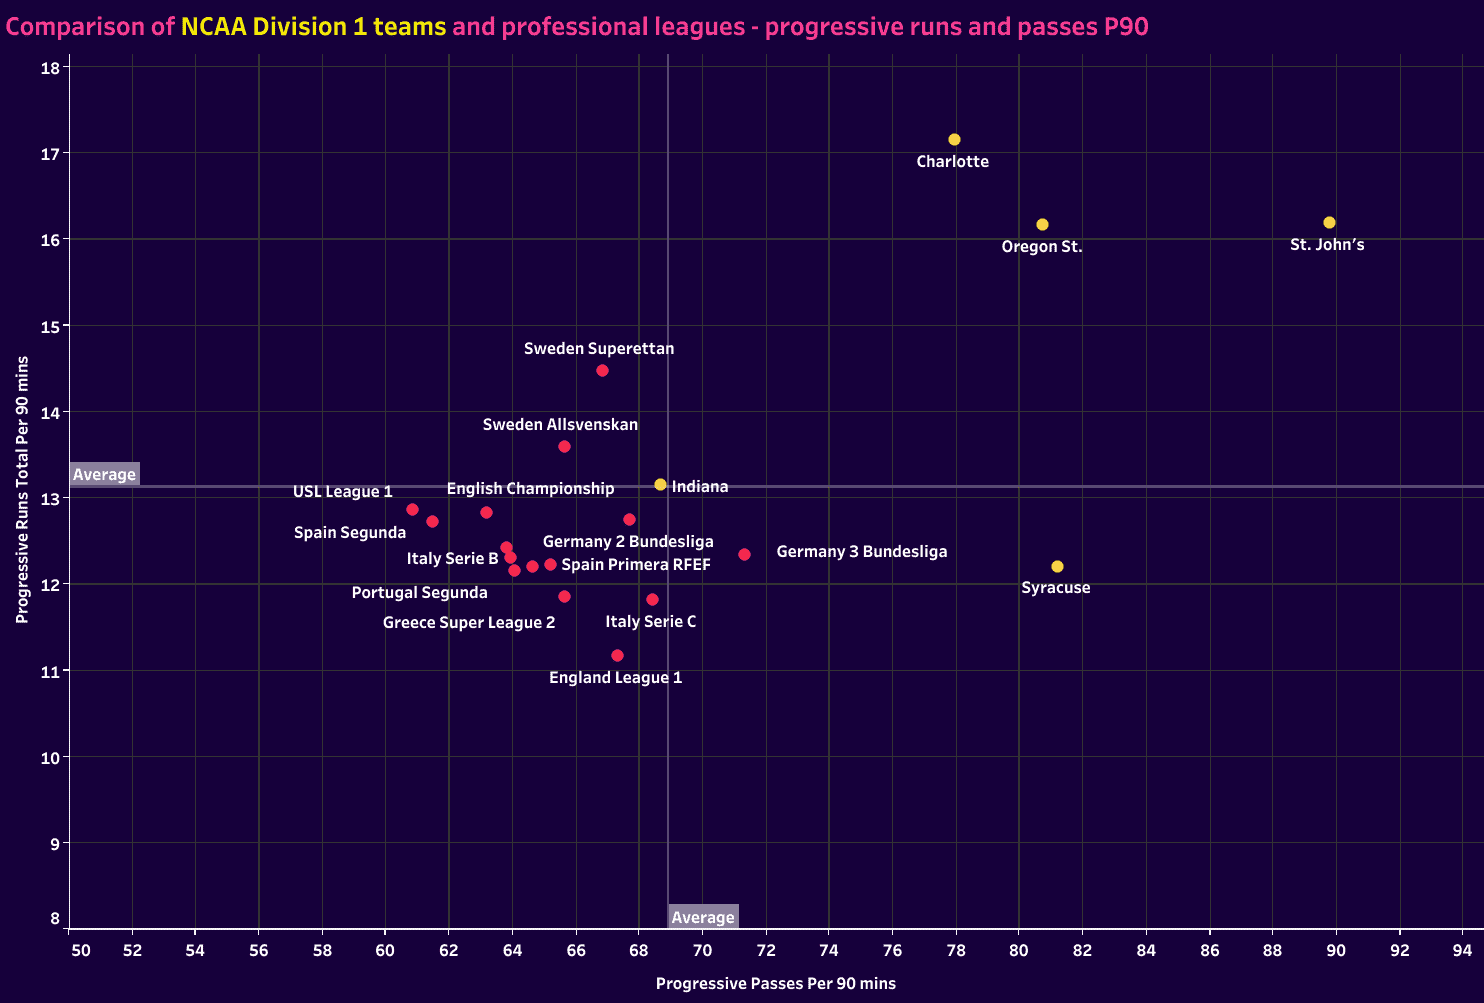
Moving along to progressive actions, college soccer does see far more progressive passes than professional teams.
Again, part of this is the fact that they have an additional 15 minutes (think of a playing time increase of 25% at the pro ranks), but you also see the product of subbing fresh legs as needed.
In terms of the game model, having fresh legs available at all times also results in more transition play and a decreased emphasis on defensive blocks.
One potential learning curve for NCAA players is factoring into an organised press.
Some teams, like Syracuse, do it very well, so we can use data to identify those teams and then see which players within the program are exceptional in their defensive understanding.
Still, it is one of the shortcomings of the standard of play.
To be fair, that’s also a critique of lower professional football leagues.
Some type of learning curve is likely for the university players as they move on to the professional ranks, but it’s perhaps not as prohibitive given the leagues they would likely move into.
Finally, we have through passes and deep completions.
The goal here is to look at the tendencies of the university teams as they look to attack the box and compare their tactics to those of the professional leagues.
NCAA teams dominating the deep completion line will also register the top three tallies and through passes P90 minutes.
Interestingly, the first and second-tier American divisions rate highest in through passes P90 among the professional leagues.
The German leagues and Swedish Allsvenskan aren’t too far off, but using through passes is definitely more prominent in the American game.
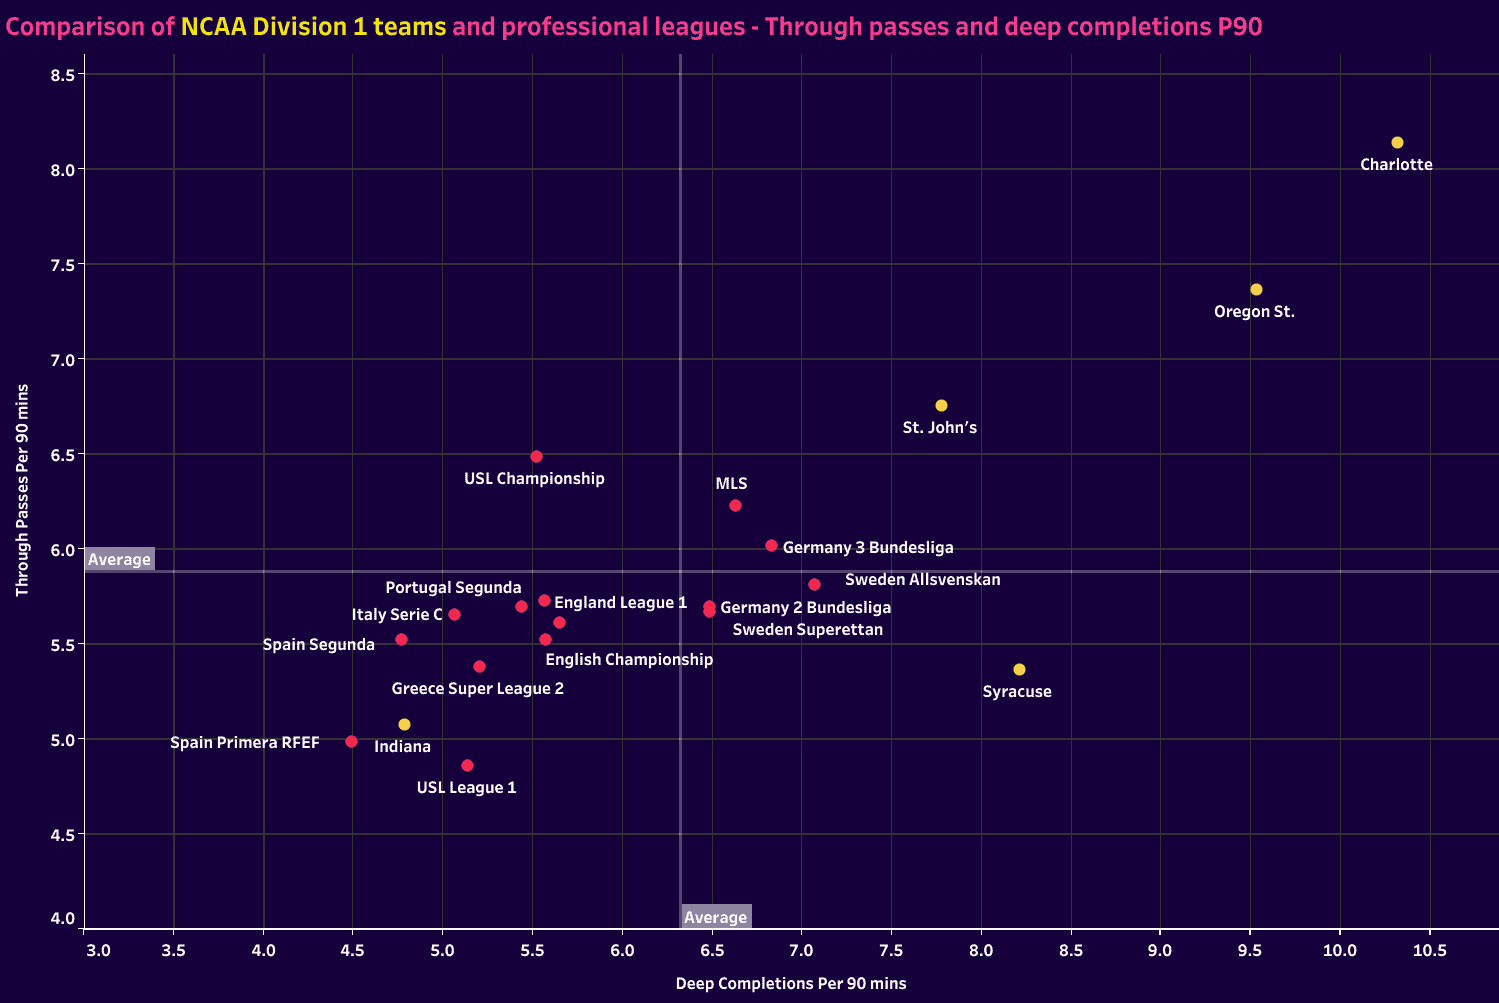
This section was really to contextualise NCAA Division 1 soccer, representing top, middle, and lower-rated teams to show the transfer to the professional ranks.
There is a need to consider the impact of substitution rules and clock stoppages, which gives the NCAA teams more opportunities to execute these actions.
Still, we do get a glance at how each college team’s style of play corresponds to the professional league selected.
From the perspective of a club scouting department or scouting agency, Wyscout is an excellent resource for identifying systematic fits and then identifying individuals within specific programs.
Given Wyscout’s extensive database of NCAA soccer, there’s an opportunity for professional teams across the globe to ramp up their scouting of what’s arguably the highest level of amateur football in the world.
You can find players who left their home countries at 19 or 20, leaving a second or third-division team to play football and earn a degree in the United States.
You can find former and even current youth international players too.
Most college soccer players would love the opportunity to continue playing beyond their time at their university.
USL clubs do an exceptional job of identifying these players, but many want to challenge themselves abroad as well.
There’s certainly an opportunity for clubs and scouts to add talent from the American collegiate ranks.
Conclusion
This is the start of a series on NCAA college soccer.
The American university scene differs from the professional ranks in terms of some rules and the style of play that follows from those deviations.
However, it’s still an excellent place to find physically developed players with a good understanding of tactics and decent technical qualities.
Finding the right players at the right universities then becomes the key.
Our goal today was to establish some of the top teams and look at game models through the lens of data.
For professional teams and scouting agencies, this analysis can point you in the right direction as you look to identify players at American universities.
For any American college coaches reading this article, this is an opportunity to include Wyscout data in your scouting reports.
This level of data is available on both the men’s and the women’s side.
Wyscout has grown its database tremendously in terms of the coverage of NCAA soccer.
While data scouting doesn’t replace video scouting, the two should be coupled.
Opposition scouting reports can lead with data to create a framework for understanding how the opposition will play, then use video to figure out the who, what, when, why and where.
Few programs incorporate data, and even fewer know how to use it effectively.
For ambitious college soccer programs wanting to carve out an advantage and jump ahead of the pack, a well-executed data analysis in scouting reports is an easy and effective way of gaining an advantage.
It can also be a great recruitment tool, but that’s another topic.
In a game of small margins, resources like Wyscout’s statistical database offer a significant advantage for cutting-edge programs.
Incorporating the findings is the key.




Comments