With just over half of the La Liga season in the books, Atlético Madrid hold a 10-point advantage and game in hand over their nearest rivals, second-placed Barcelona and third-placed Real Madrid.
How have Atlético managed to claim the top spot?
This article will look at not only their style of play but the styles we’ve seen across La Liga.
In this data analysis, we’re looking for a correlation between styles of play and results. To weave our way through The statistics, will first break this data analysis into possession and counterattacking styles of play. Within the league, you’ll notice there are clusters, typically determined by club finances. Within these clusters, we want to look for differentiators and results that are borne out in the statistics.
Finally, we’ll look at the defensive side of the game. Does a more intense press lead to desired results? Has sitting back in a deep defensive block earned the minnows any points? We’ll answer those questions and more.
Possession Based
First, looking at the possession-based teams, our goal is to first identify who they are and how their performances correlate to results. Once we know which teams are among the top in the league in possession per game, we can look at their means of progression, how they attack the box, and the quality of the shooting attempts they generate.
In the state analysis, there are a couple of regularities in the data visualizations to help us keep tabs of each teams’ status in the league table. The first is that the size of the points relate to each team’s position in the league. Atlético Madrid sits at the top of the table, so there circle is the largest. The second point to mention is that the colour coding indicates quartiles in the league standings. At the top end of the scale, the five teams are a dark shade of blue. At the other extreme, the bottom five are coloured with a dark red.
Looking at our first graph, we see that seven of the top 10 teams are in the top-right quadrant, indicating that they’re in the top half of total points and positional attacks per 90 minutes. The next most populated quadrant is the bottom-left, again with seven teams. This group registers a below-average number of positional attacks per 90 minutes and makes up 70% of the bottom half of the league table.
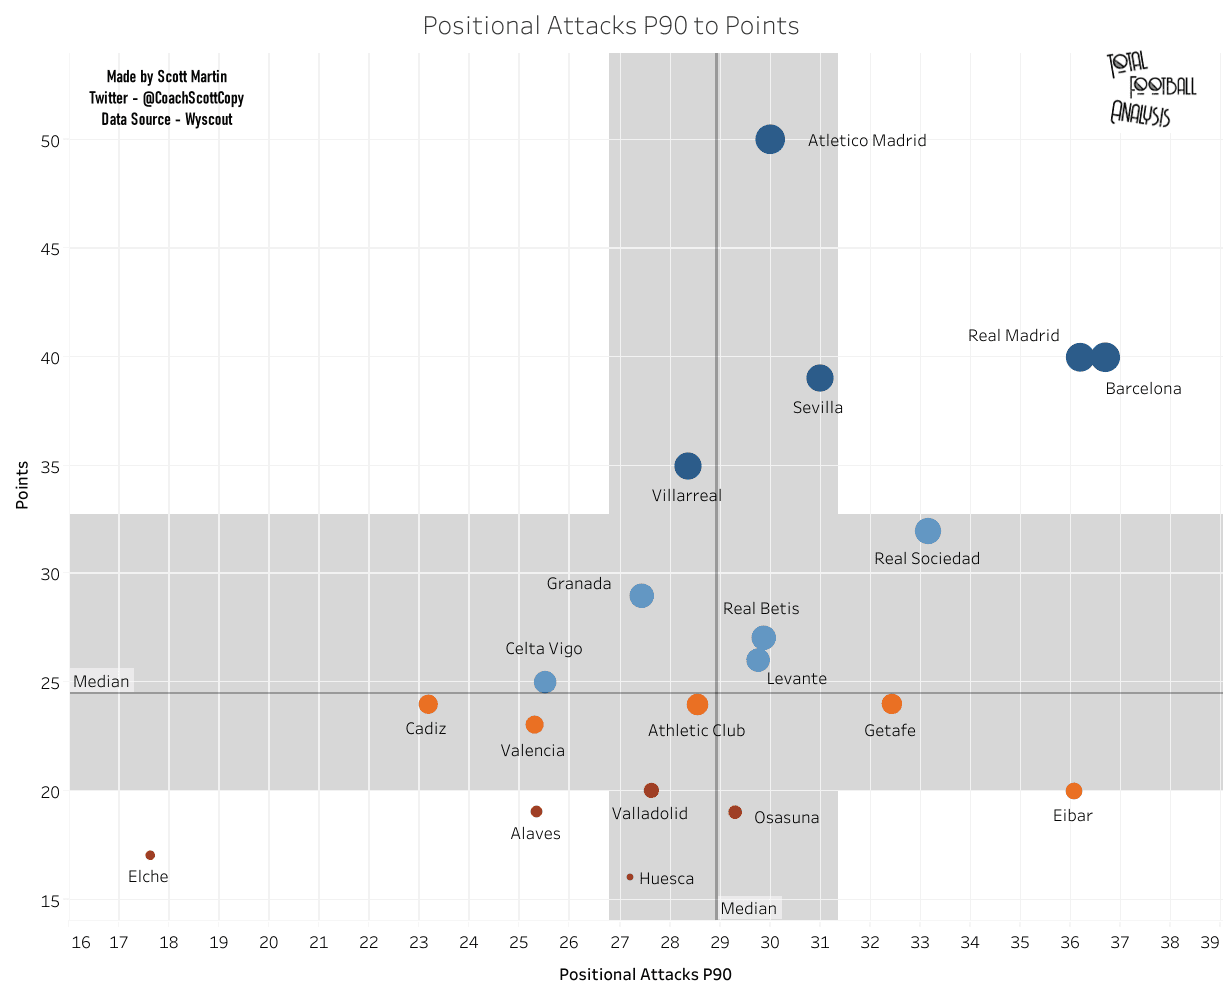
One interesting note is that we do find relatively smaller teams in the top half of the positional attacks per 90 statistic. EEibar, Getafe and Osasuna all rate in the top half of positional attacks per 90 minutes. From prestige and financial standpoints, those three, as well as Levante, rate behind their high positional attacks per 90 rivals. Of those four, only Levante lands a spot in the top half of the table, as well as the top-right quadrant in this particular analysis.
In terms of possession percentage and passing rate, which is the number of passes a team sends per minute of possession, which is also called tempo, we have a much more prominent delineation of the top half from the bottom. Among teams in the top half of the table, only Real Betis rates below average in possession per game. They’re also the only one of the 10 with a below-average passing rate, completing just 11.9 passes per minute of possession.
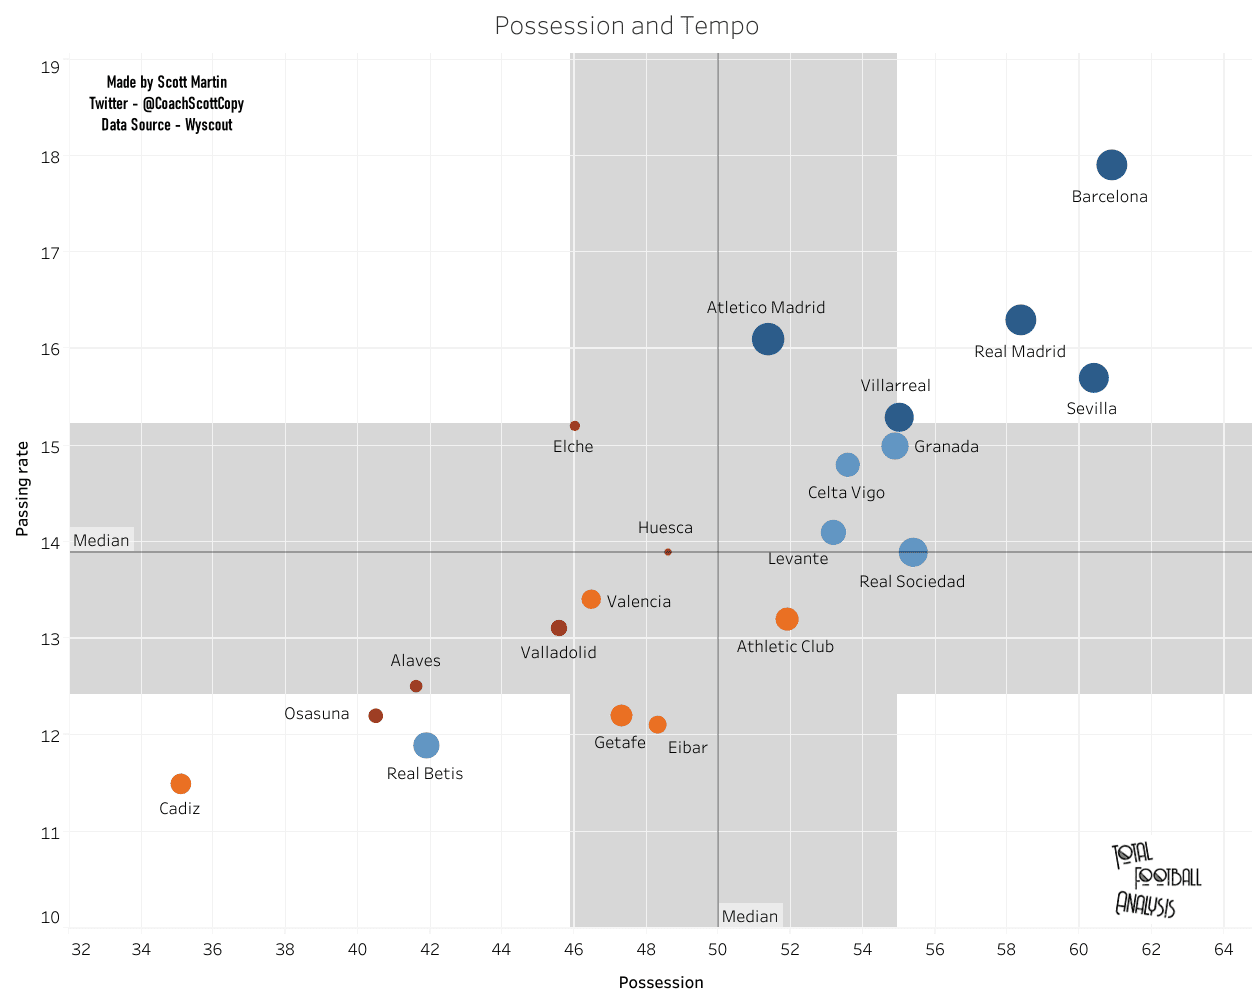
Other than Real Betis, the higher the tempo typically the higher the place in the table. The one exception of a team with more possession yet a slower tempo is Athletic Club, a team on the ascendancy that could very well crack the top 10 in the coming weeks.
Building from the previous graphic, we now have possession in relation to PPDA against. Much like the last data visualization, we have Real Betis in the bottom-left quadrant and the other nine of La Liga’s top 10 in the top-right. The only significant change is that Athletic Club has made the jump from the bottom right to the top-right quadrant.
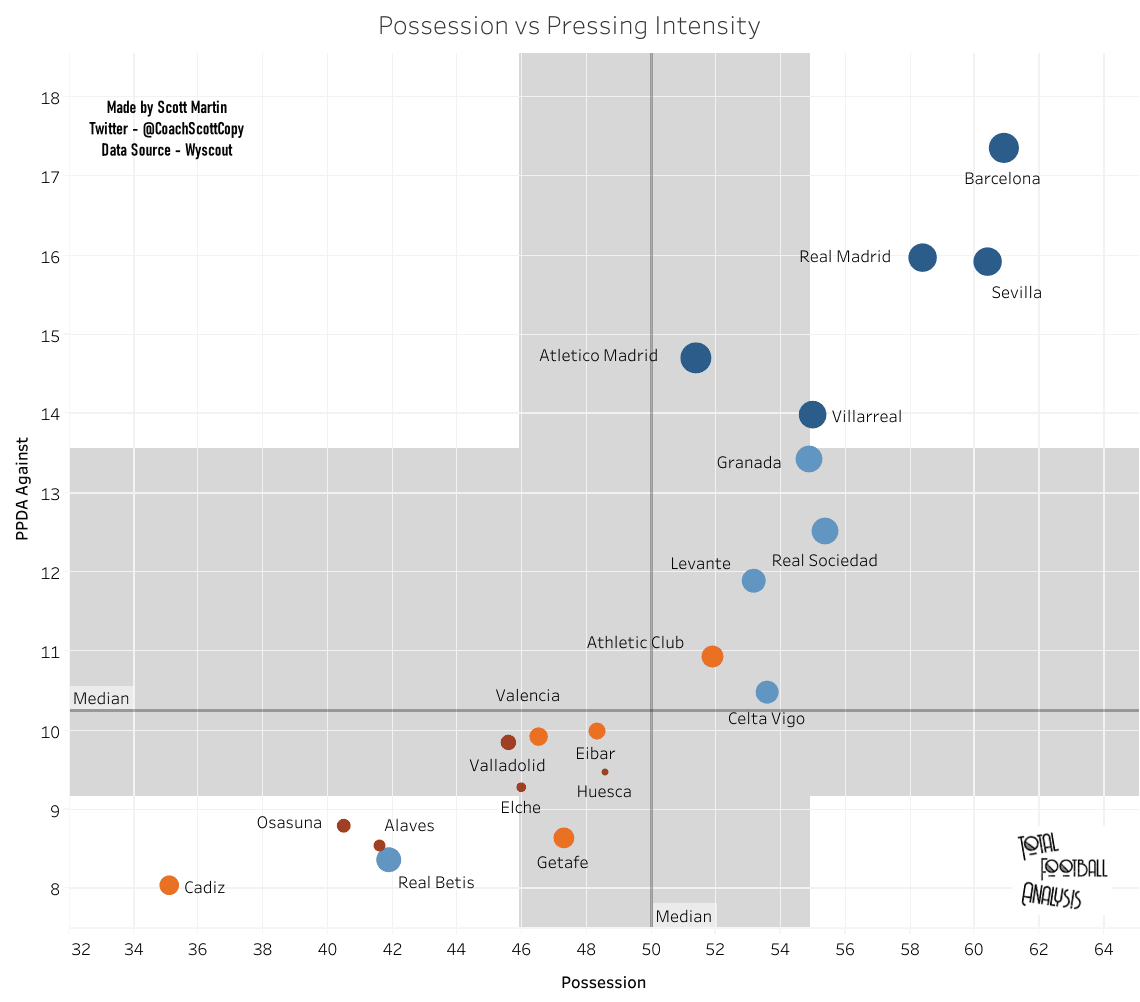
For the most part, the size and spending power of the clubs determine their positions on the graph, with most of the wealthier, more prestigious teams registering better than 50% of the possession per game. They’re also coming up against opponents that drop deeper in an effort to limit space in their defensive third.
Turning now to the way teams attack the goal, one of the attacking third distinctions I wanted to make was in point of entry. That is, which teams are more likely to send crosses and which prefer deep completions. Crosses are pretty straightforward, basically, any ball played from the wing into the penalty area, but deep completions may need some clarification.
Wyscout defines a deep completion as “a non-cross pass that is targeted to the zone within 20 metres of the opponent’s goal.” Those 20 metres are measured from the very centre of the goal, carving out a semicircle and measuring the 20 metres by way of a radius.
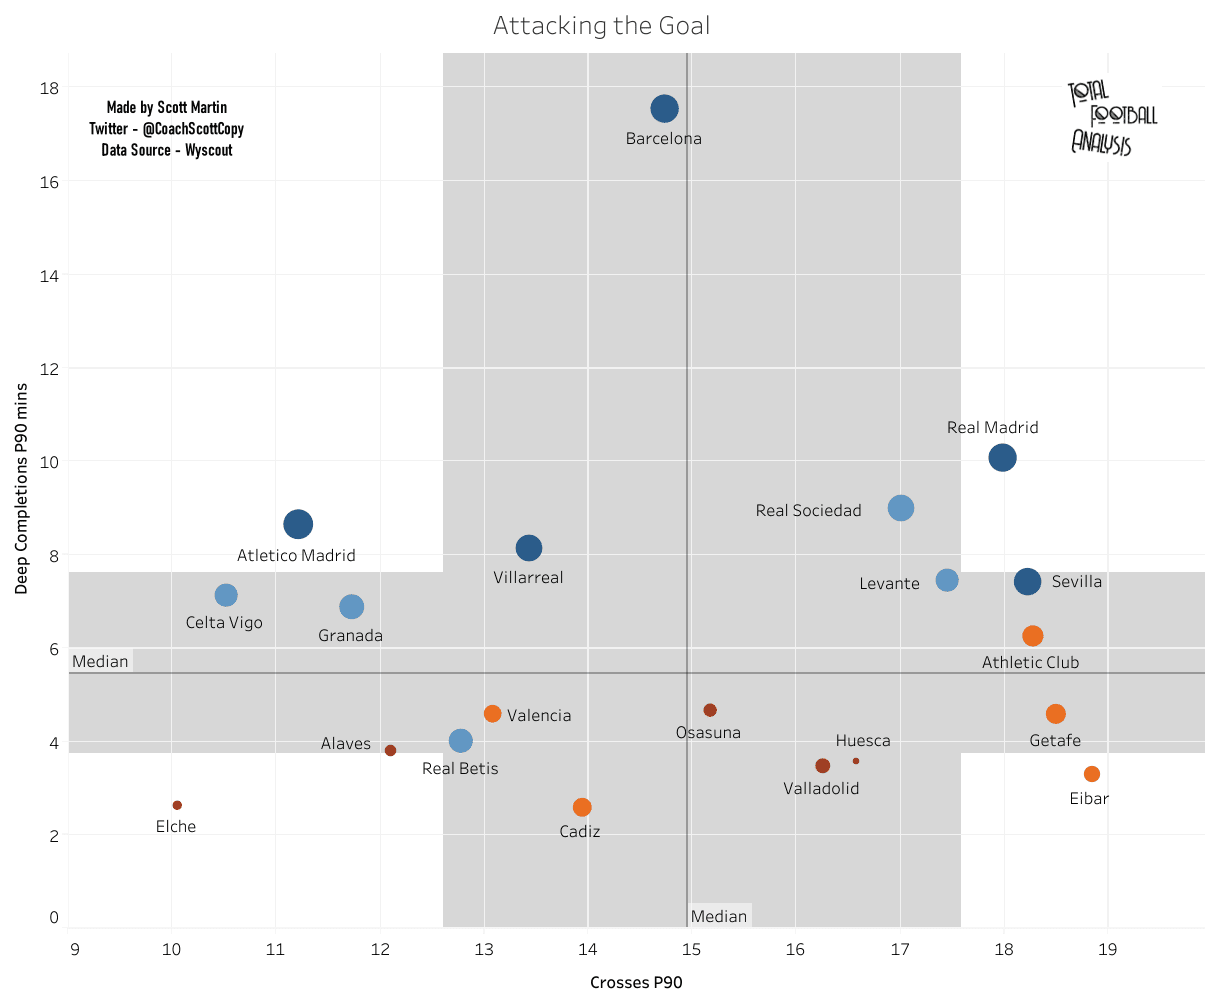
The most interesting point in this data visualization is that we have the exact same set of teams that rate above average in deep completions per 90 minutes as we did in the PPDA against and possession statistics. We see that the most successful teams in La Liga rate in the 10 best teams in deep completions per 90 minutes, Real Betis being the one exception.
In terms of crossing, it’s a bit of a mixed bag. In relation to table standing, four rate among the top 10, six among the bottom 10. Interestingly enough, the four teams in the top half of the table also claim the top four places among the above-average crossing teams in deep completions per 90 minutes. As Real Madrid, Sevilla, and Real Sociedad show, there’s a benefit in diversifying the approach to goal. Even Barcelona rates 11th in crosses per 90 minutes while averaging 17.54 deep completions per 90 minutes. Diversifying the approach helps keep the opponents off balance and creates space for the deep completions.
When teams do get their shots off, we have a clear number one in their category with Barcelona taking 14.98 shots per 90 minutes. Among teams from the top half of the table, Granada and Celta de Vigo recorded a below-average number of shots per match while Villarreal sit right at the median. From the bottom half of the table, Eibar is the only side north of the median.
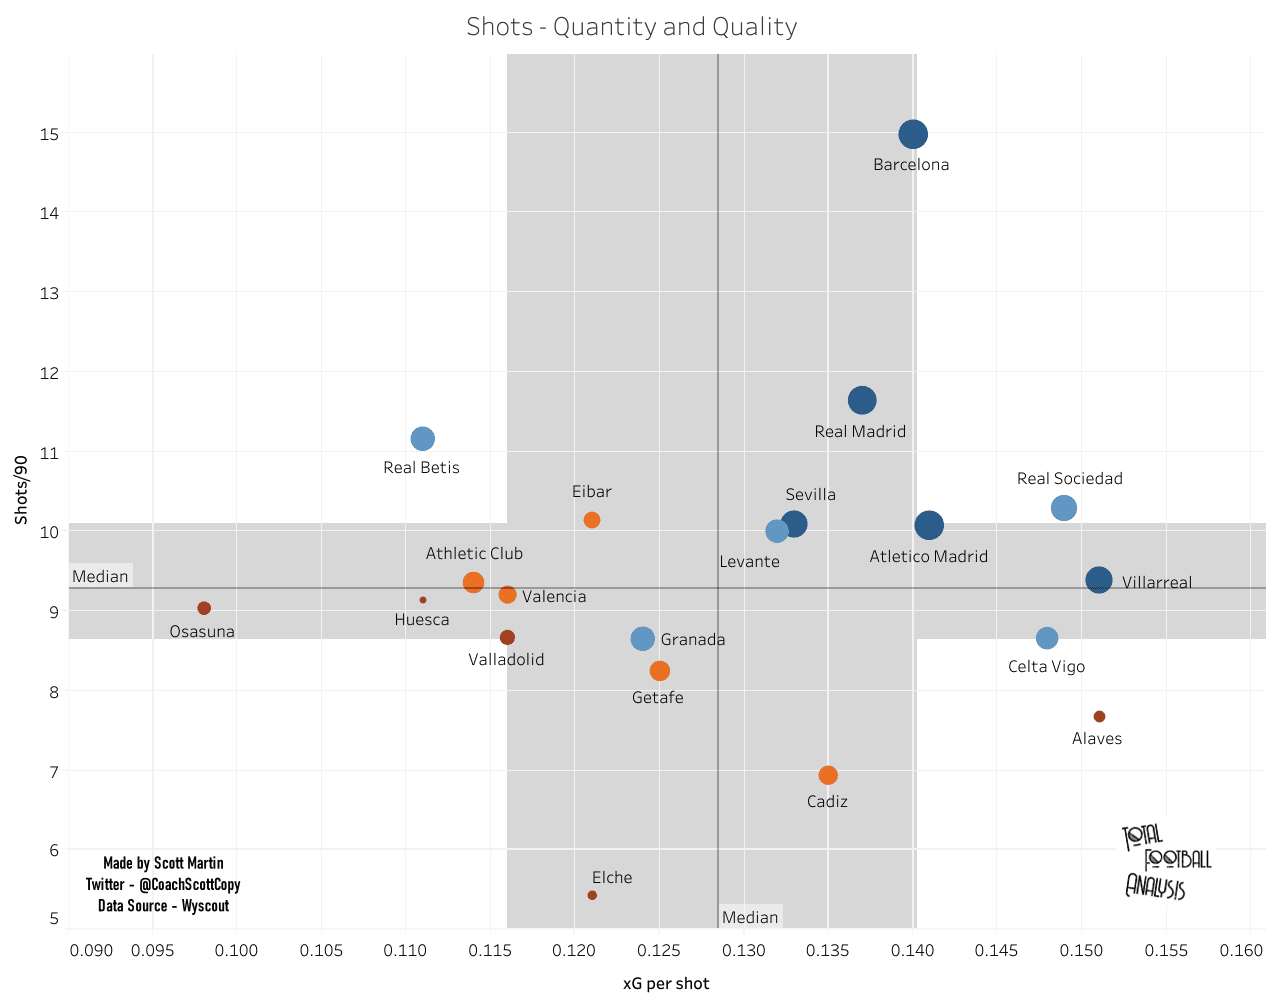
In terms of shot quality, we do see that the top half of the table, which is predominantly possession-based teams, generate the highest expected goals tally per shot. While it’s not a perfect science, it does give the general impression that when these teams do take shots, they are of a higher quality than their peers.
The only two teams in the top half of the xG per shot stat category who fall on the bottom half of the league table are Deportivo Alavés and Cadiz. However, in both cases, they’re averaging fewer than eight shots per game, 18th and 19th in the league. Though their shooting opportunities are typically of high quality, they simply take too few per game.
Finally, let’s take a look at progressive actions, which serves as a nice transition into the counterattacking phase of this data analysis. In terms of progressive actions, the graph below looks at runs and passes. For all the details, Wyscout offers precise definitions for the categories on their website. A simple internet search will give you all the clarity you need. To simplify the definition for this article, all you’ll need to know that the closer a player is to the opponent’s goal, the shorter a distance he has to advance the ball to register a progressive action. The objective is to advance the team significantly closer to the opponent’s goal. Since that’s more difficult in the opposition’s half, only 10 meters progression is necessary whereas in their own half, 30 metres is the standard.
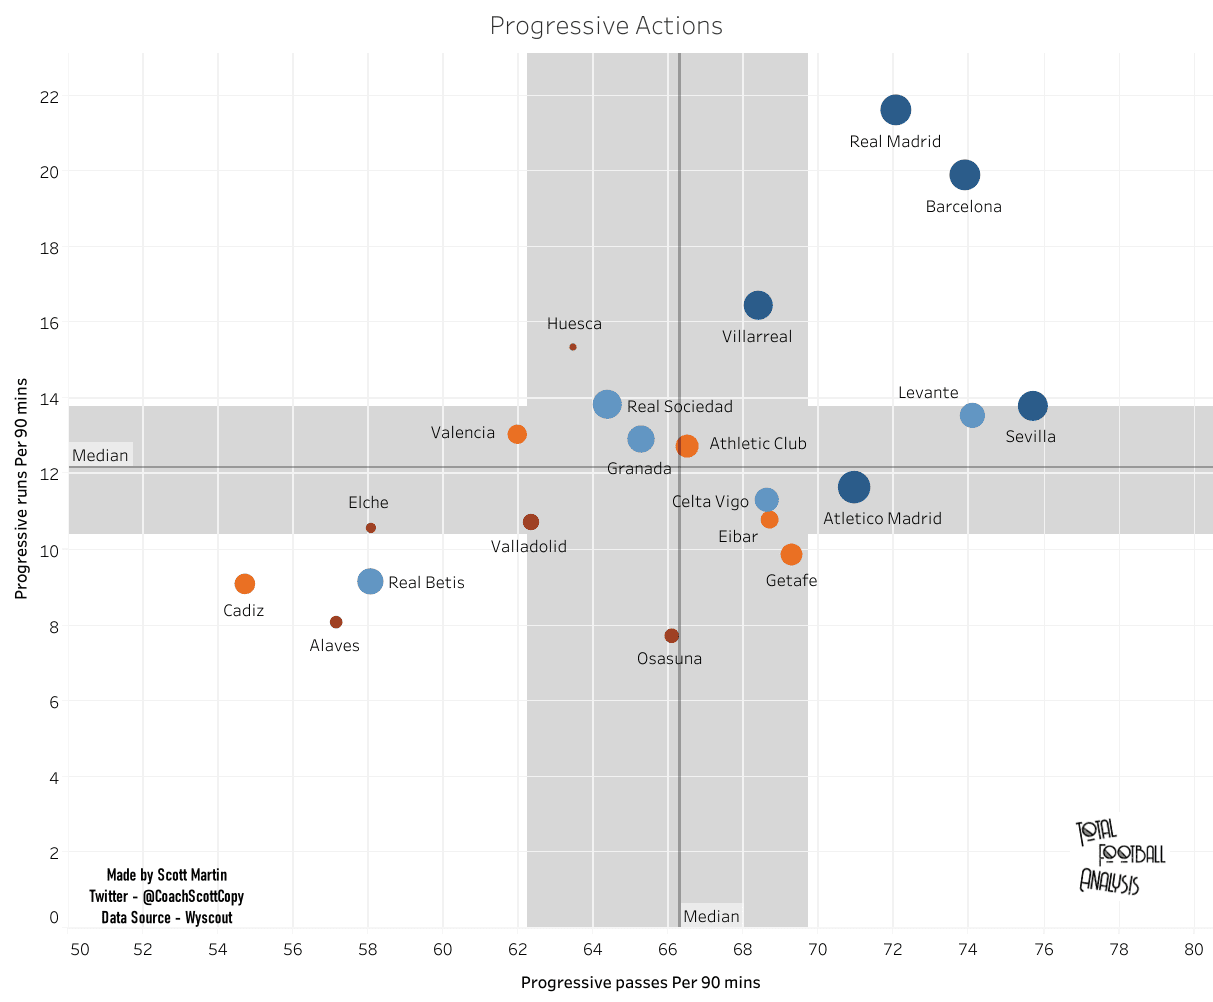
In the top-right quadrant, we have our elite performers, proficiently progressing through either the dribble or the pass. Real Madrid and Barcelona offer the best balance of the two while Sevilla, Levante and Villarreal show a clear tendency towards one type of progression while still maintaining some semblance of balance.
Analyzing this first section, we do find that La Liga’s top teams tend to employ a possession-dominant style. Real Betis is the one exception from the top half of the table, whereas Athletic Club rates fairly well from the bottom half.
Counterattacking Teams
Moving now to the counterattacking side of the game, we want to identify which teams attack through the counter most often and what relationship that has to points. One of the general assumptions in the game is that teams from the bottom half of the table will be more dependent upon counterattacks. Since they sit deeper on the pitch, frequently in a low block, the objective is to protect the space directly in front of their goal while also forcing the opposition to overcompensate in the attack, creating room for the counterattack.
A couple of surprises emerge. First, among the 10 teams with the most counterattacks per 90 minutes in La Liga, six of them are also in the top half of the table. Given Real Betis’ poor numbers in the possession-based categories, it’s no surprise to see they lead La Liga with 3.23 counterattacks per 90 minutes.
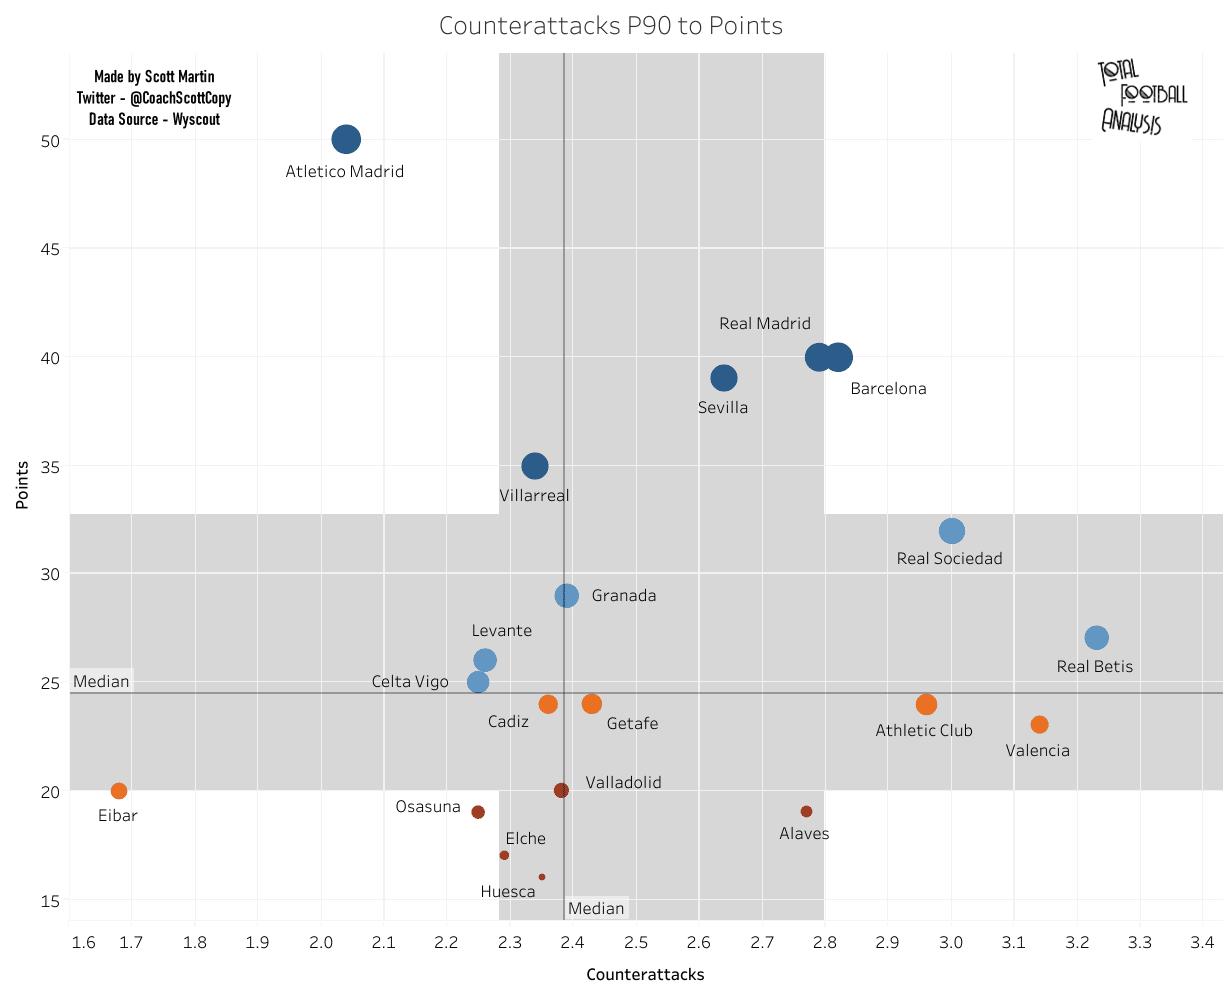
Fascinatingly, we find a very different Atlético Madrid team than we’re used to seeing under Diego Simeone. For the season, they’re averaging 2.04 counterattacks per 90 minutes, 19th of the league and only rating ahead of Eibar.
The other surprise is that among the bottom half of the table, only four teams rate in the top 10 of counterattacks per 90 minutes. A few more fall near the median, but our assumption that teams from the bottom half of the table will record more counterattacks per 90 minutes doesn’t hold up under further analysis.
Watching La Liga’s top teams, especially Real Madrid, Barcelona and Sevilla, we know that they frequently have to play through low blocks. However, when opponents muster the courage to attack them, even through the counterattack, we find that these teams are more than happy to use the opponent’s weapon against them. With space now readily available, they attack it quickly and to devastating effect.
Now that we know which teams rate at the top of the league in counterattacks, let’s look at the relationship between total passes and long passes, each on a per 90-minute basis. As you’d expect, Barcelona plays the most passes per game and the fewest long passes. Right behind Barca are the remainder of the top five. Passes per game relates very closely to standing in the table. Among the top 10 teams, only Granada, with their 264.75 passes per 90 minutes, falls below the median. Now, turning our attention to long passes, six of the teams in the category’s top 10 also fall in the bottom half of La Liga.
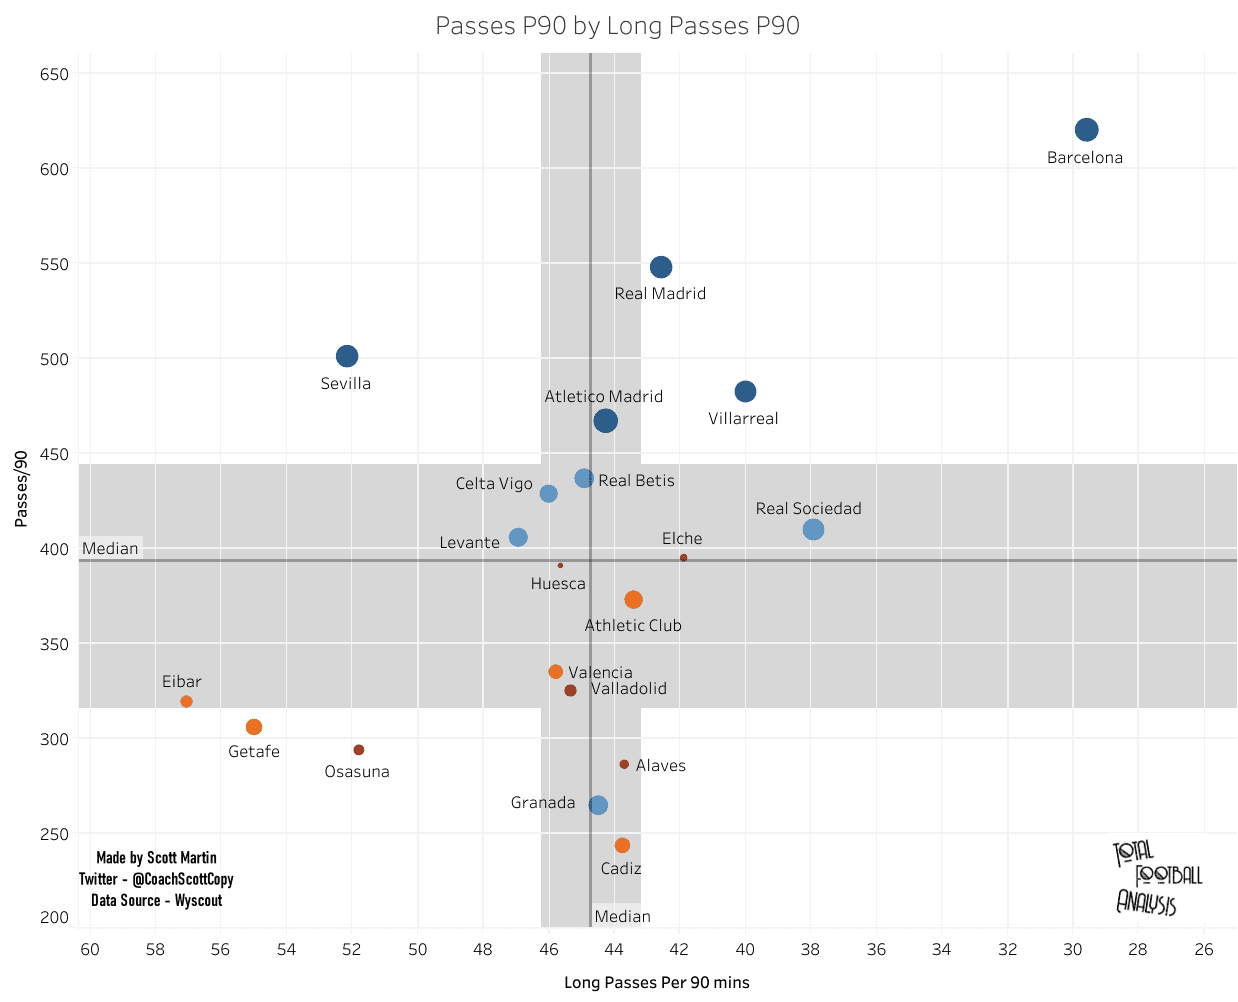
While the top half of the La Liga table tends to play more passes per game and show a lesser reliance on long passes, all except for Sevilla and their 63 per 90 minutes, there is an interesting departure among the bottom half of the table. Elche and Huesca fall almost right on the median despite rating in the bottom five of the league. We then have Athletic Club and Valencia, followed by Real Valladolid. Of the teams rating from 11th to 15th in the passes per 90 minutes category, three rate among the bottom five in La Liga. Further, none of these five teams are among the heaviest users of the long ball. Valencia comes closest, rating 7th in the category.
Among the teams that fall in the top half of the La Liga table and top 10 of counterattacks per 90 minutes, we find that only Sevilla routinely resorts to longer-range passes. For the most part, the elite teams will utilize either shorter to intermediate passes or the dribble.
Moving on to the dribble, our next chart shows progressive runs per 90 minutes by 1v1s and dribbling per 90 minutes. Many familiar faces show up in the top-right quadrant. Only Huesca, with their 15.36 progressive runs per 90 minutes and 32.43 1v1s and dribbles per 90 minutes, represents the bottom half of the league table.
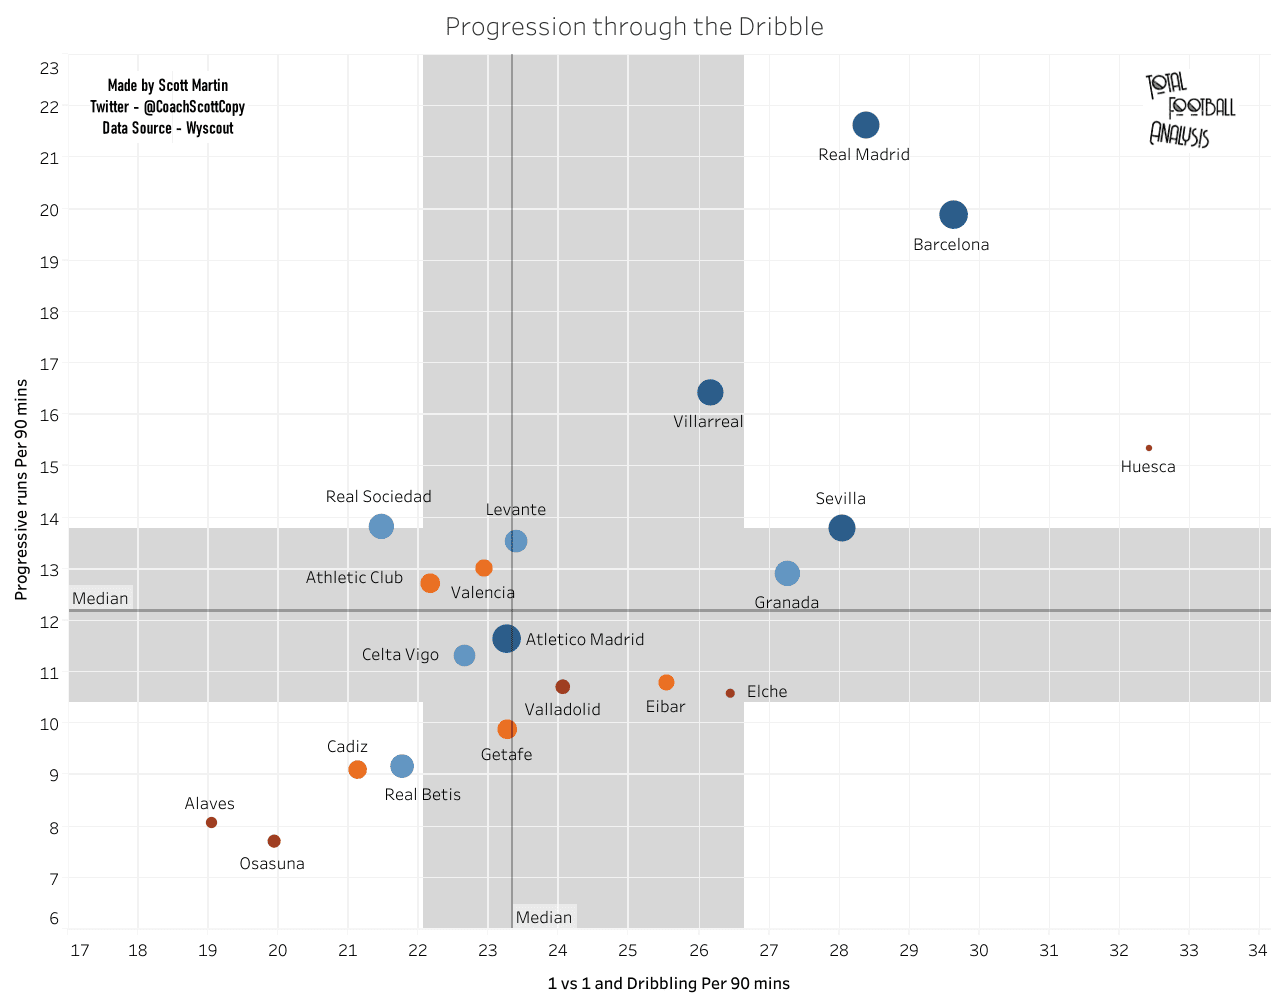
One of the interesting finds here, in addition to Huesca, is Granada falling in the top-right hand quadrant. In the previous chart, we saw that they were 19th in passes per 90 minutes and hit the median in long passes per 90 minutes. And here we see why. They rate 5th in La Liga in 1v1s and dribbling per 90 minutes with 27.27.
Other than our two outliers, Granada and Huesca, we do see that progressive runs, 1v1’s and dribbling in a more general sense are the luxuries of the elite teams. Atlético Madrid is the one exception, and a bizarre one at that.
To wrap up our counterattacking section, as well as attacking in general, this analysis has uncovered the fact that top possession-based teams are also among the top counterattacking teams in the league. While there is certainly a greater representation across the league table in the counterattacking categories, top teams find a way to use newfound space to the best of their abilities. Additionally, it was interesting to note that so few of the league’s bottom half rate among the most frequent counterattacking teams, debunking our original assumption.
Defensive Performance
Finally, we’ll take a look at the defensive performances across La Liga. Spanish football tends to implement an aggressive counterpress and many teams are willing to engage in a high press when the conditions are right, namely, when they have numbers behind the ball. You’ll certainly get teams that drop deep in a low block, especially Cadiz, on the whole, teams are willing to engage higher up the pitch. Since it is an aggressive, high-intensity league, we do want to see if there’s any relationship between PPDA, passes for defensive action, and success on the pitch.
Our first graph sets up PPDA in relation to goals allowed per game. Above the median, we have the top counterpressing teams. Eibar leads the way with 7.81 opponent passes between their defensive actions. At the bottom end of the scale, we have the 18.37 PPDA of Cadiz.
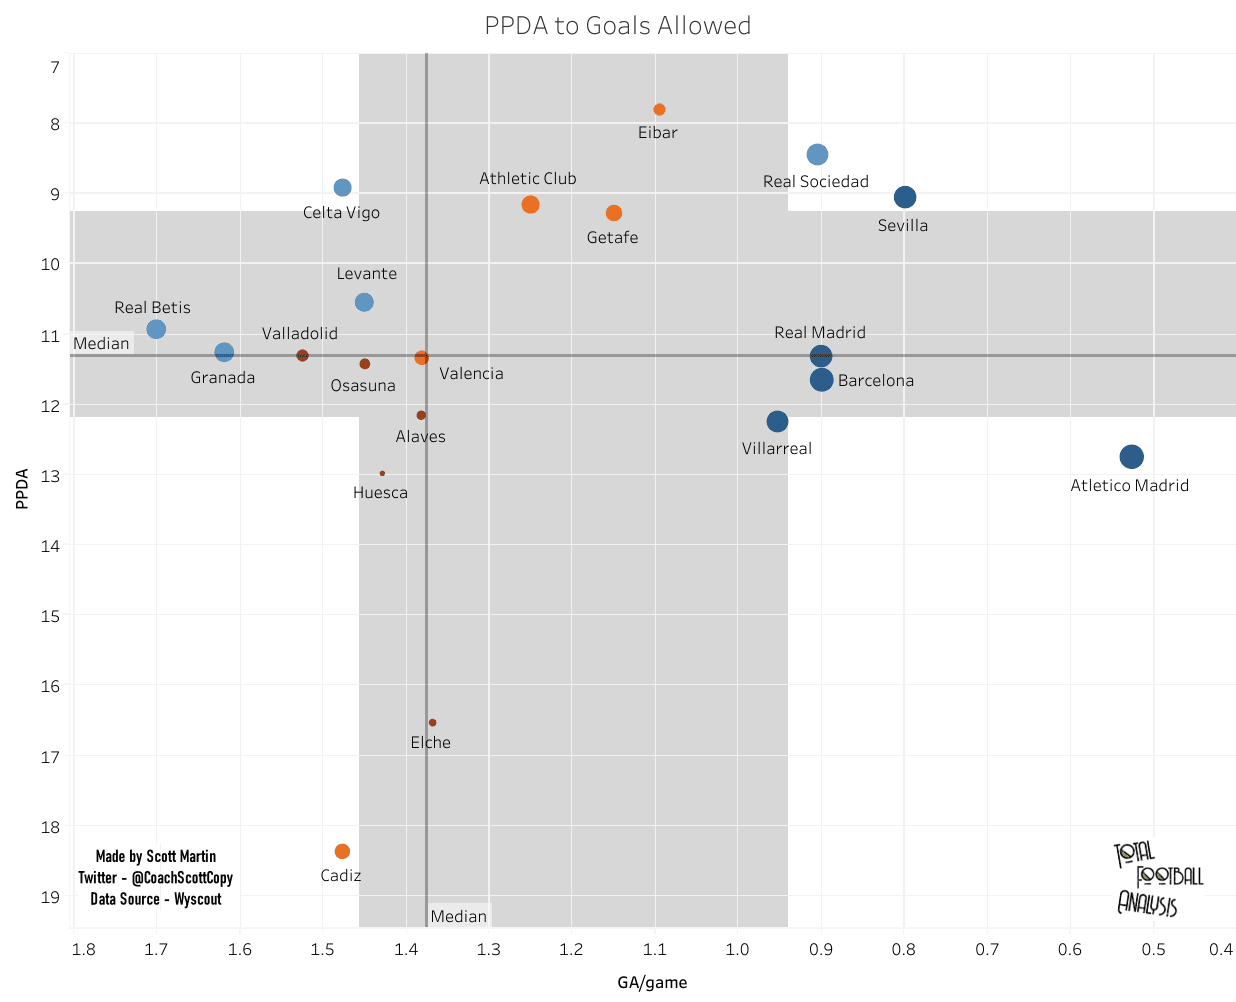
This is one of the more interesting graphs. The first point worth noting is that the top six teams in the table also rate one through six in goals allowed per game, with Atlético setting an incredible standard of just 0.53. Sevilla’s the closest rival with a 0.8 average goals conceded per game, 66% more than Atlético.
However, when you look at PPDA, Sevilla is the only team in the top five of both the league and the statistical category. Outside of Sevilla, the teams most likely to engage in a high-intensity counterpress fall in the middle of the table. In fact, the current league leaders have the fourth lowest PPDA.
Even though their PPDA isn’t very high, the eye test gives an indication as to why La Liga’s top teams tend to counterpress at a lower rate. Looking at Real Madrid in particular, one of the big tactical analysis points in my book, Revitalizing Real Madrid, was that Zinedine Zidane had two purposes for the counterpress. First, to win the ball back if possible. Second, to force the opposition backwards in an attempt to set up the high press, which, for Real Madrid, was man-oriented. That explains Real Madrid’s 11.31 PPDA. The objective isn’t always to win the ball back immediately. For some teams, especially La Liga’s elites, the priority is killing the opposition’s counterattack by forcing them to play negative. Then, once the press is in place, these top teams can direct more pressure in the vicinity of the ball.
By killing the counterattack, top teams are able to limit the quality of the opposition’s shots. That’s the next step in our analysis, looking at expected goals against per 90 minutes relative to expected goals per shot against. We want to see which teams are conceding the most chances, as well as the highest quality shots.
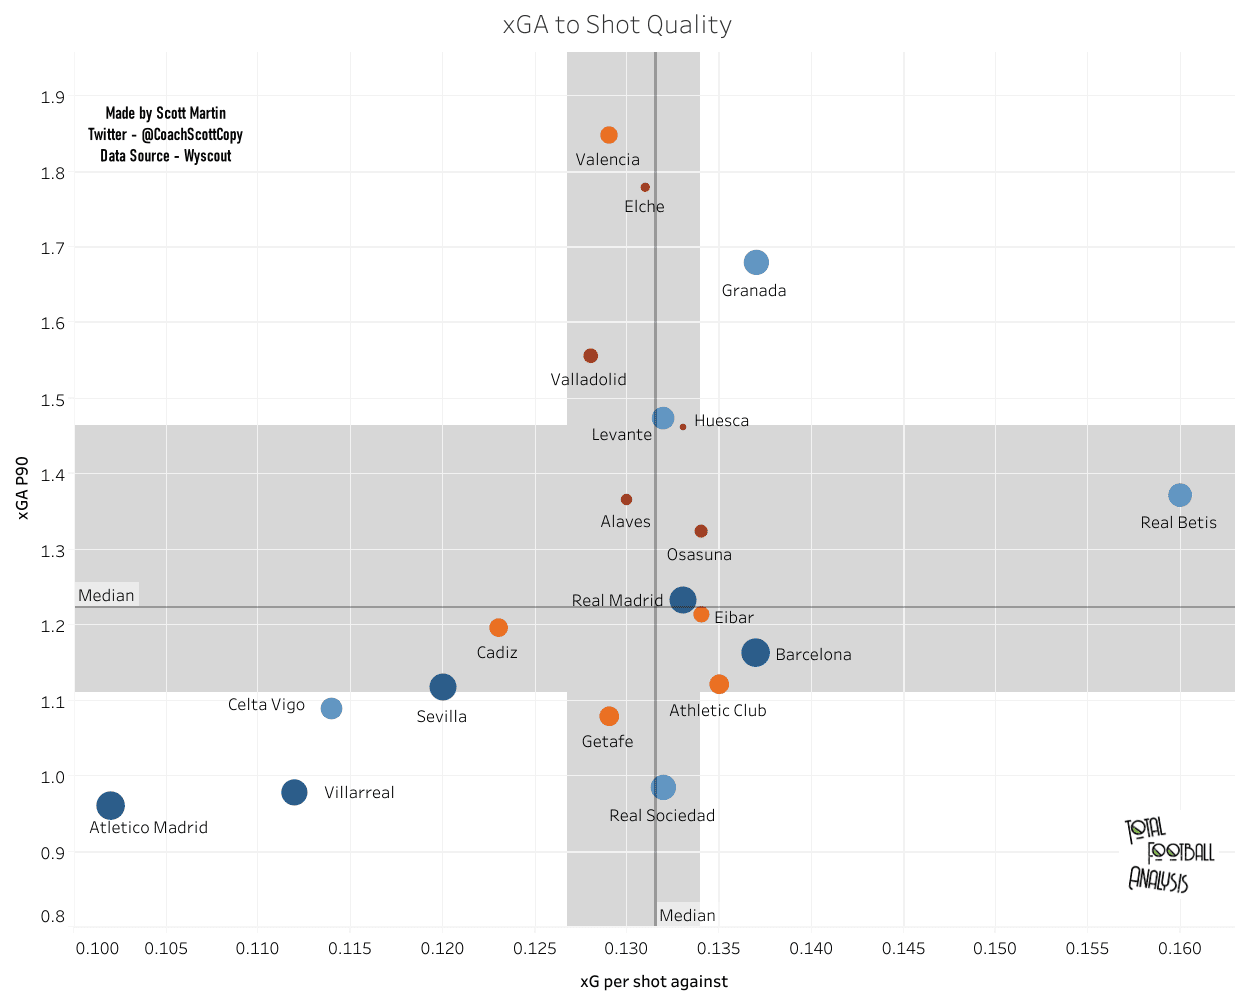
It’s no surprise that Atlético Madrid is in a league of their own. They’ve been incredible on the defensive side of the game, all while producing an entertaining attacking brand of football.
Seven of La Liga’s top 11 teams concede the fewest expected goals per 90 minutes. Contrary to last year’s stellar defensive work, Granada is the team from the top of the half of the table with the most expected goals against, owning a 1.68 xGA that rates third highest in the league. Levante, Real Betis, Real Madrid and Barcelona join them as teams with underperforming xGA P90s and high xG per shots against.
This defensive analysis shows why Atlético Madrid is the favourite in La Liga. Not only are they among the top attacking teams the most prominent categories, but they’ve been absolutely ruthless defensively. Meanwhile, their two nearest competitors, Real Madrid and Barcelona, rate well in goals allowed per game, but there’s certainly an element of luck given their xGA P90 and the quality of the chances they’re conceding. Fortunately for both teams, they have world-class goalkeepers to bail them out of difficult situations. Without the likes of Thibault Courtois Marc-Andre ter Stegen, these two would be even further behind Atlético Madrid.
Conclusion
To wrap up this analysis, we’ll look at xG and xGA comparisons, and then finish with the chart on points, pitting expectation versus reality.
Looking at expected goals for and against, Barcelona is the clear leader in xG, whereas Atlético Madrid holds a nice margin in xGA. Real Madrid and Barcelona’s defensive work is middling at best, placing more pressure on the success of their attacks. Meanwhile, Atlético Madrid, Villarreal and Real Sociedad have found a nice balance in the attacking and defensive sides of the game.
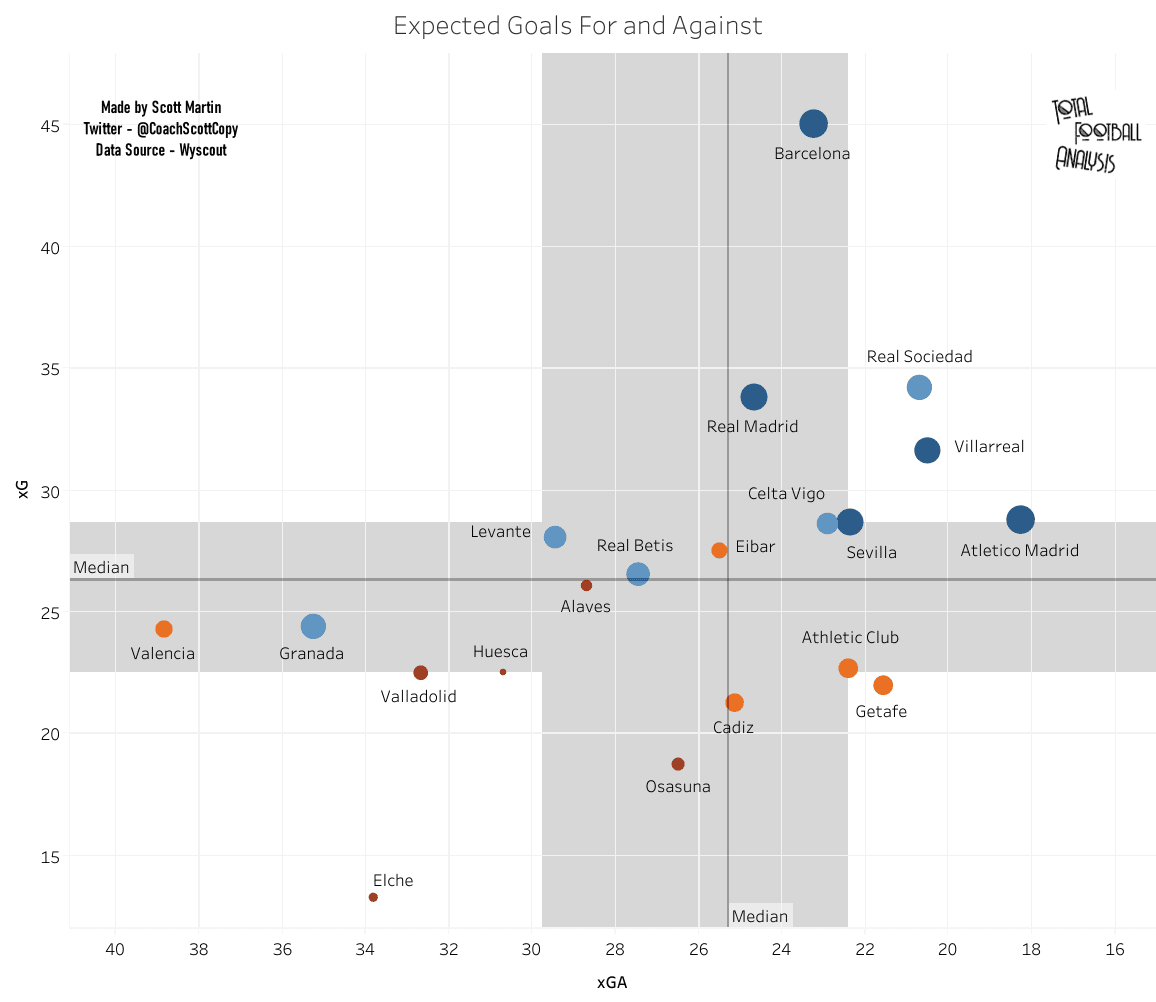
As we move into the final half of the league season, one of the big storylines will be who survives relegation. The odds certainly aren’t favouring Huesca at the moment, but that bottom-left quadrant is heavily populated with teams that are struggling both to score goals and keep them out. Look for Deportivo Alavés to improve their league standing, whereas Real Valladolid, Granada and Valencia are likely to see point regressions if their performances do not improve.
Finally, we have our expected versus real points. According to expected points, Barcelona, Real Sociedad, and Villarreal should round out the top three in the league, but that certainly hasn’t played out. With a 10-point lead and a game in hand, Atlético Madrid is in prime position to win their first La Liga title since 2013/14.
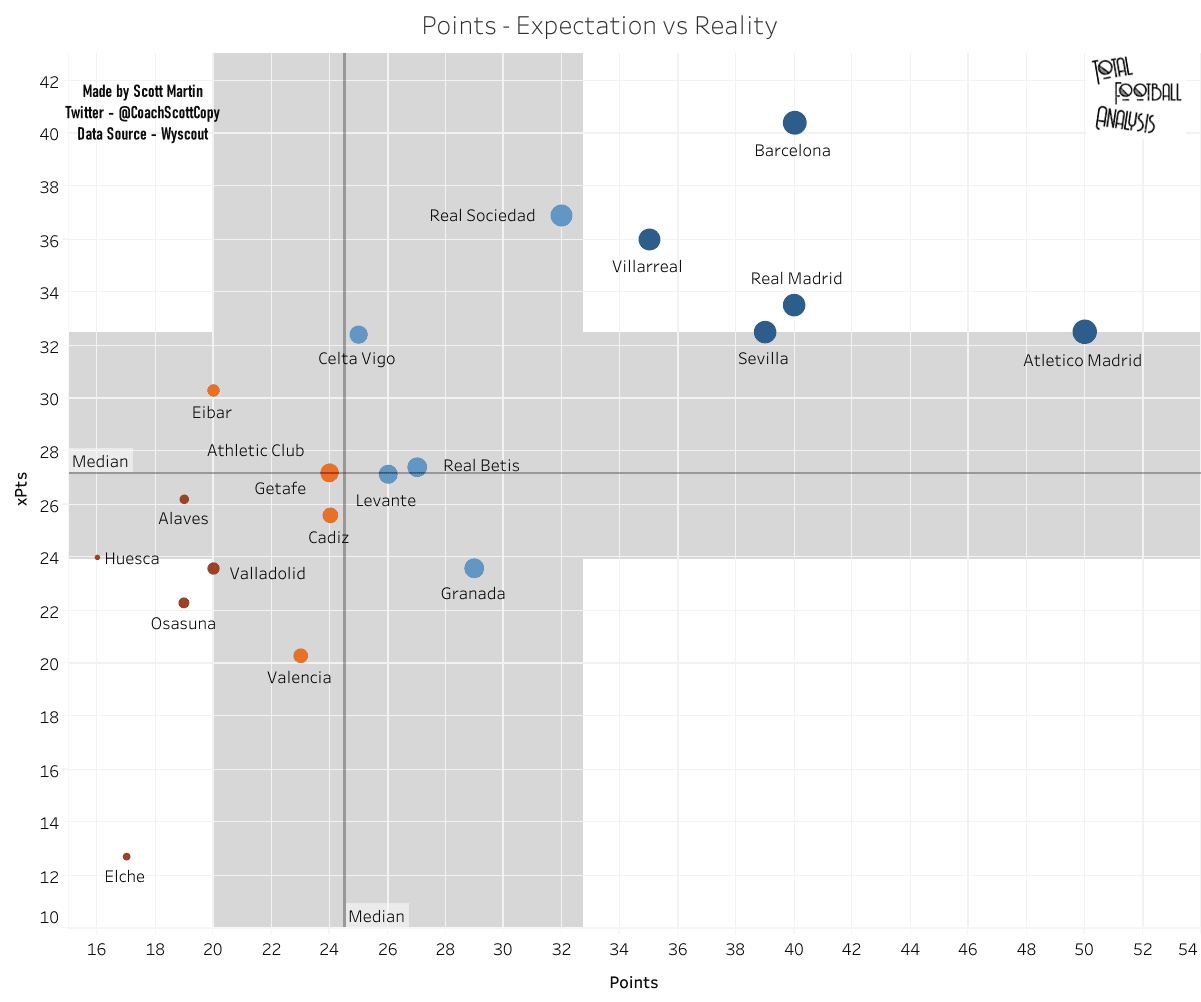
On the other end of the scale, we find Valencia near the bottom of the expected points category for the second season in a row. This year, only Elche have fewer expected points. If you’ve listened to the Total Football Analysis La Liga podcast, you’ll remember Chris Mumford predicted Valencia would suffer relegation this season. Only four points from the drop zone, that’s a very real possibility, especially given their poor showing in the expected statistical categories. They’ve just signed Ferro on loan from Benfica, one of Portugal’s top centerback prospects who certainly fills a position of dire need for the club. If he can step into the starting XI and give them an upgrade at the position, the second half of the season could be kinder to them, but that’s a big if.
So, to wrap up this data analysis, we do find that La Liga’s top teams are possession dominant. Additionally, most of them are also among the league’s top counterattacking teams.
At the other end of the table, we find several clubs that have low possession percentages, are limited in the counterattack and are most likely to drop deep behind the ball before engaging the opponent. While their lack of success is in large part due to their limited financial backing and the quality of the players on hand, the standard method of dropping deep to take away space and counterattacking simply isn’t working for them. For smaller clubs, status quo tactics are leading to status quo results, putting each of them in a position where they have to claw their way to safety. From a statistical standpoint, a great deal of research has been done on how goals originate. In most cases, teams will have fewer than four passes and possess the ball for less than 12 seconds on goal-scoring moves. Sitting deep in a low block and taking chances with the long ball goes against scientific evidence, reducing the minnows’ chances of scoring a goal.
Each season has its low income, high-performance club. This season, Levante looks to be the league’s overachiever. While they have some defensive vulnerabilities, they routinely put themselves in a position to threaten the opponent at the other end of the pitch with a high number of progressive passes and runs per 90 minutes. They’re a brilliant tactical example for less financially robust clubs, as was Getafe during the 2019/20 campaign. If the history of the game has taught us anything, it’s that smaller clubs must innovate or suffer relegation. This season is no different.


Comments