On 29 January Manchester United rescued a late draw at home to Burnley, in which Paul Pogba scored a penalty to get United back in the game on 86 minutes before Victor Lindelöf’s dramatic 91st minute equaliser.
In that game Pogba took seven shots, more than any other United player. The Frenchman recorded an xG rating of 1.32, also higher than any of his teammates, though this included his penalty that made up 0.76 of his xG.
If we take the penalty out of the equation, that comes to an xG of 0.56, somewhat higher than Pogba’s average xG for the season of 0.34 up until that game (excluding penalties). I say up until that game, because since then something has happened. United’s record signing has seen his xG drop to just 0.11 per game (excluding penalties) in the nine Premier League games since that date.
As we can see from the graph below of Pogba’s xG per 90-minute blocks, there has been a marked decrease in Pogba’s goal threat since that meeting with Burnley on 29 January.

Since that game, Pogba has seen his place in the Premier League xG rankings drop from 52nd to 84th (again excluding penalties, which we’ll come to later). But isn’t Pogba supposed to have one of the highest xG in the Premier League? Yes, and we’ll also get to why that is later. First let’s step back a moment and consider what xG ratings mean and how we should interpret them.
Why xG matters
The xG metric is now widely used in order to assess whether or not a team’s results match their performances. That is to say, if a team is struggling to score but their xG suggests they should be scoring more than they are then their problem could just be down to finishing rather than any deficiency in their build-up.
But how do we use xG to assess players’ performance?
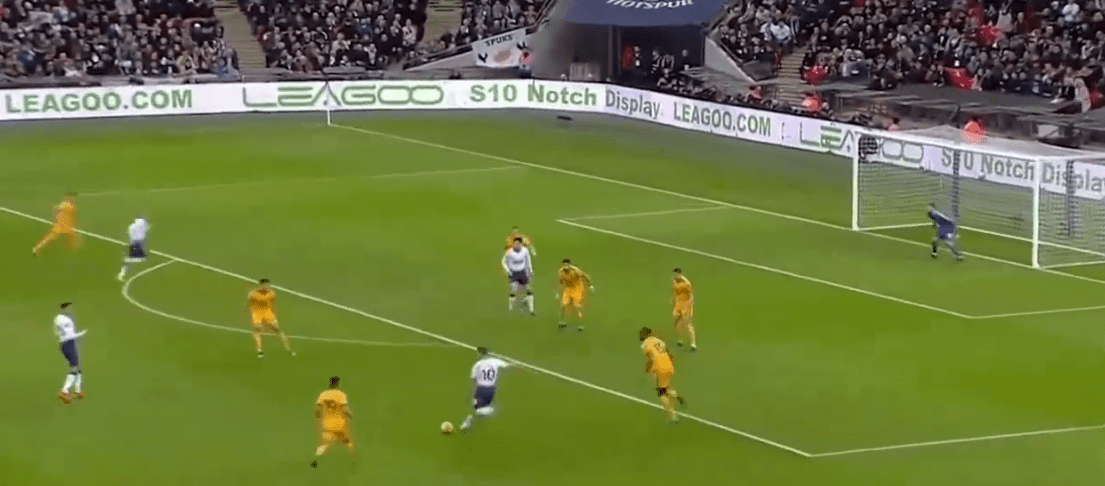
Generally speaking, if a player has a high xG that means that they consistently shoot in situations where they have a high chance of scoring a goal. This usually means shots from inside the penalty area. The reason for this is that shots from outside the area tend to have a very low xG, in the region of 0.02 to 0.07. That means that a shot from long distance, like Harry Kane’s goal against Wolves at Wembley this season, would only have a 2% chance of going in.

In contrast, a penalty will always have an xG of 0.76, as the average player has a 76% chance of scoring from the spot. This is why it is important to look at a player’s xG rating with penalties taken out of the equation.
When a team’s xG is boosted by penalties, some credit can be given to that team for at least having won the penalty, as this invariably involves some kind of attacking play in the opponent’s box. When it comes to players on the other hand, by leaving the penalty xG numbers in, all you are doing is giving that player credit for being their team’s chosen penalty taker.
How does this affect Pogba?
Overall, Paul Pogba’s current xG for the season is at 15.2, the sixth highest in the Premier League. On the face of it it seems an impressive statistic, but when we factor out his penalties (Pogba has taken 10 this season), it comes to a much more conservative 7.58. Simply by taking penalties out of the picture Pogba drops from having the sixth highest xG in the division to the 25th highest.
The penalty factor aside, Pogba’s xG rating has shown a marked decrease recently. His NPxG (non-penalty expected goals) for the nine games since Manchester United’s January game against Burnley stands at just 0.94. He managed 6.64 NPxG in the 20 Premier League games he played up until that point, so what’s changed? First, let’s consider the positions Pogba has been shooting from.
Pogba’s positioning
Such a dramatic decrease in xG will most likely indicate a lack of shots from high-xG locations, that is to say, inside the penalty area. So has the Frenchman simply stopped shooting from inside the area?
The statistics show that in the last nine games Pogba has shot just six times from inside the area, including scoring the opener against Fulham, his only non-penalty goal in the same period. To put that into perspective, the ex-Juventus midfielder had previously registered 29 penalty-area shots over the course of the preceding 20 games: a decrease from an average 1.45 penalty-area shots per game to 0.67.
Has Pogba’s role in the Manchester United team changed?


If we compare the two heat maps above, it is very clear that Pogba played a much more withdrawn role in the second game away at Leicester. In that game he had hardly any touches in the box, and in fact registered no shots at all in the whole 90 minutes.
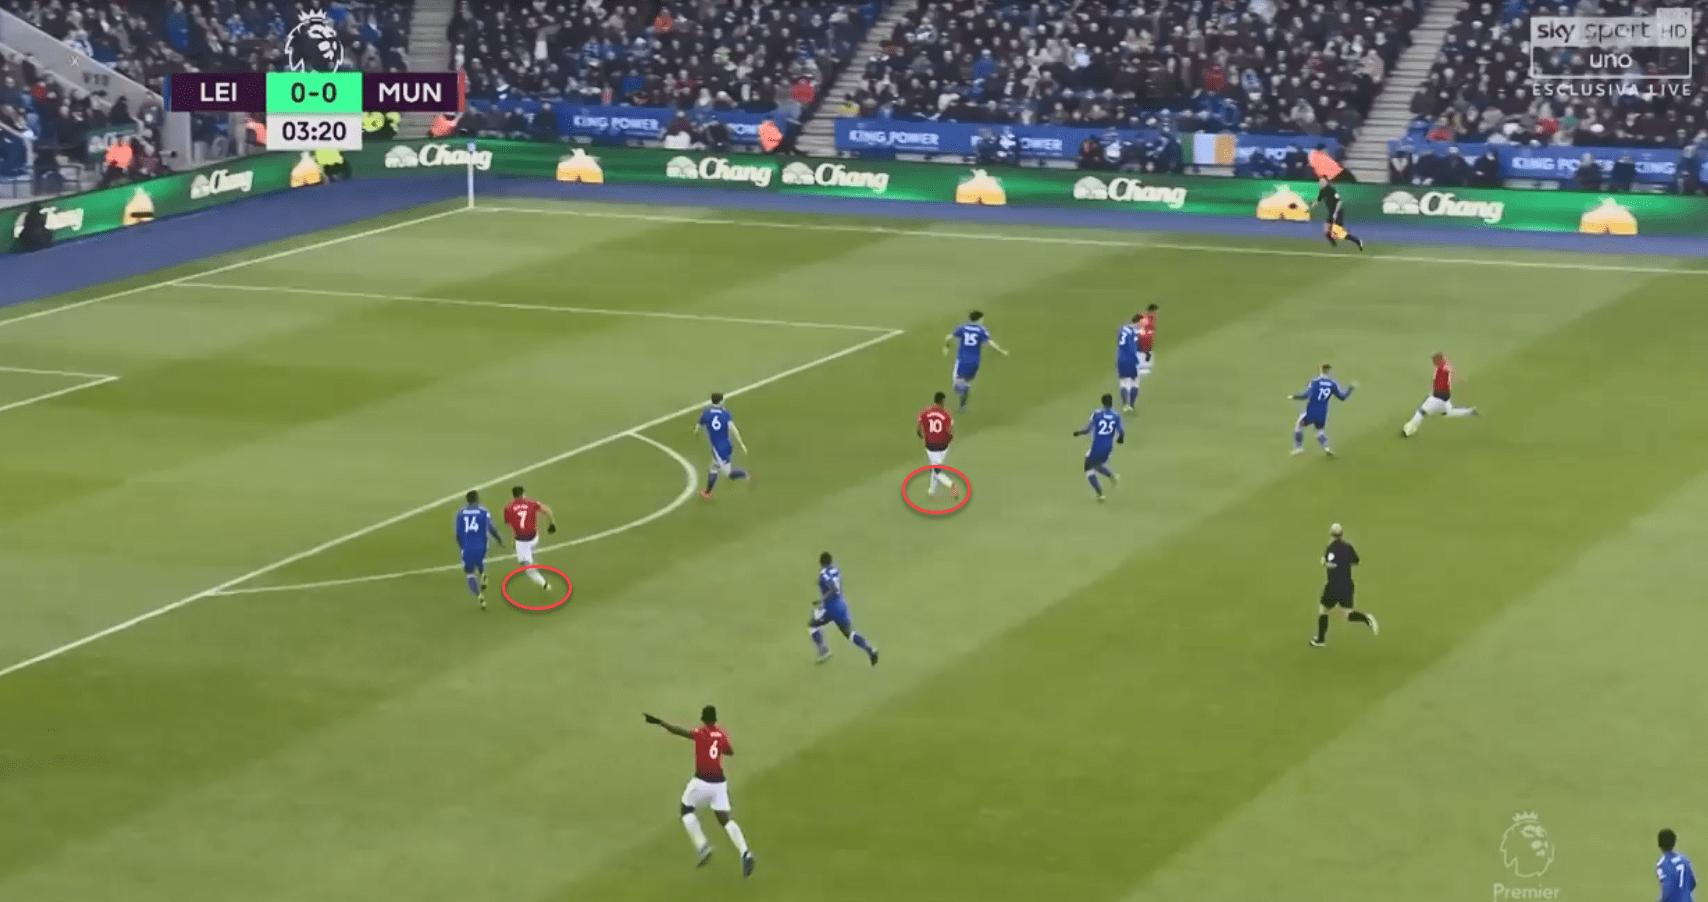
This may be explained by Ole Gunnar Solskjær’s changes to United’s formation in this nine-game period. The Leicester game marked Solskjær’s tactical shift to a two-striker formation, with Alexis Sánchez joining Marcus Rashford up front.

As we can see from the image above, the presence of the two strikers making early runs into the box means that Pogba has to seek out other areas of space to exploit. This tends to mean runs down the left flank, a move that is facilitated by the strikers’ positioning. In the above image, Leicester’s full-back Pereira is busy marking Sánchez, leaving the flank completely exposed for Pogba to make his run.
It seems therefore that one of the main reasons why Pogba is getting into fewer good shooting positions is the switch to the two-striker system. Prior to the xG increase, Pogba had played 48% of his minutes in a one-striker 4-3-3 formation. In that system he would be one of the midfielders expected to make runs into the box to support the striker. But with two strikers in the area Pogba is more effective exploiting spaces behind the forward duo or on the flanks.
The change of system doesn’t seem to have had much effect on United’s team xG. They averaged 1.65 NPxG before the Leicester game, and this has only slightly dropped to 1.58 since then, which suggests that Pogba’s decreased xG hasn’t had a negative effect on the team’s ability to create chances.
Conclusion
Pogba’s xG decrease appears to be a side effect of his change of role within Ole Gunnar Solskjær’s system. No longer required to offer a goal threat from within the penalty area, Pogba’s rate of shots from dangerous positions has decreased.
The World Cup winner’s xG will continue to be deceptively high as long as he serves as his club’s designated penalty taker, but scratch under the surface and you will realise that Pogba shouldn’t be expected to score many goals at all based on his actions from open play.
If you love tactical analysis, then you’ll love the digital magazines from totalfootballanalysis.com – a guaranteed 100+ pages of pure tactical analysis covering topics from the Premier League, Serie A, La Liga, Bundesliga and many, many more. Buy your copy of the April issue for just ₤4.99 here, or even better sign up for a ₤50 annual membership (12 monthly issues plus the annual review) right here.


Comments