Every football fan loves an underdog story.
Leicester surprised many when they clinched the Premier League back in 2016; the crazy gang beat the culture club as Wimbledon ran out 1-0 winners over Liverpool in the FA Cup final in 1988.
Another underdog story occurred last week as EFL Championship side Middlesbrough defeated Chelsea 1-0 in the first leg of the EFL Cup.
The atmosphere inside the Riverside last Tuesday was reminiscent of Boro’s glory days when they won the same competition 20 years ago.
Whilst the Teesside outfit was a top-tier side back then, it was a different story this time around as their starting XI against the Blues cost a snippet of the billions paid to assemble the current Chelsea squad.
Mauricio Pochettino’s side were heavy favourites going into the tie, dominating the match with 72% possession.
The Blues did have their chances, although they hit the target with only 28% of their efforts.
It could be conceived that greater possessional play will equate to success, but as this match proved, it is not always the case.
In this tactical analysis and tactical theory piece, we will show how possessional dominance does not always lead to victory.
We will provide an analysis of what went wrong for Chelsea in their cup defeat, as well as provide examples of sides whose tactics have them dominating the possession charts but find themselves not dominating their respective divisions.
The Boro brick wall
Chelsea set up in 4-2-3-1 at the Riverside, utilising Cole Palmer as a false number nine.
Despite Chelsea failing to find the back of the net, the former Manchester City player was not short of chances.
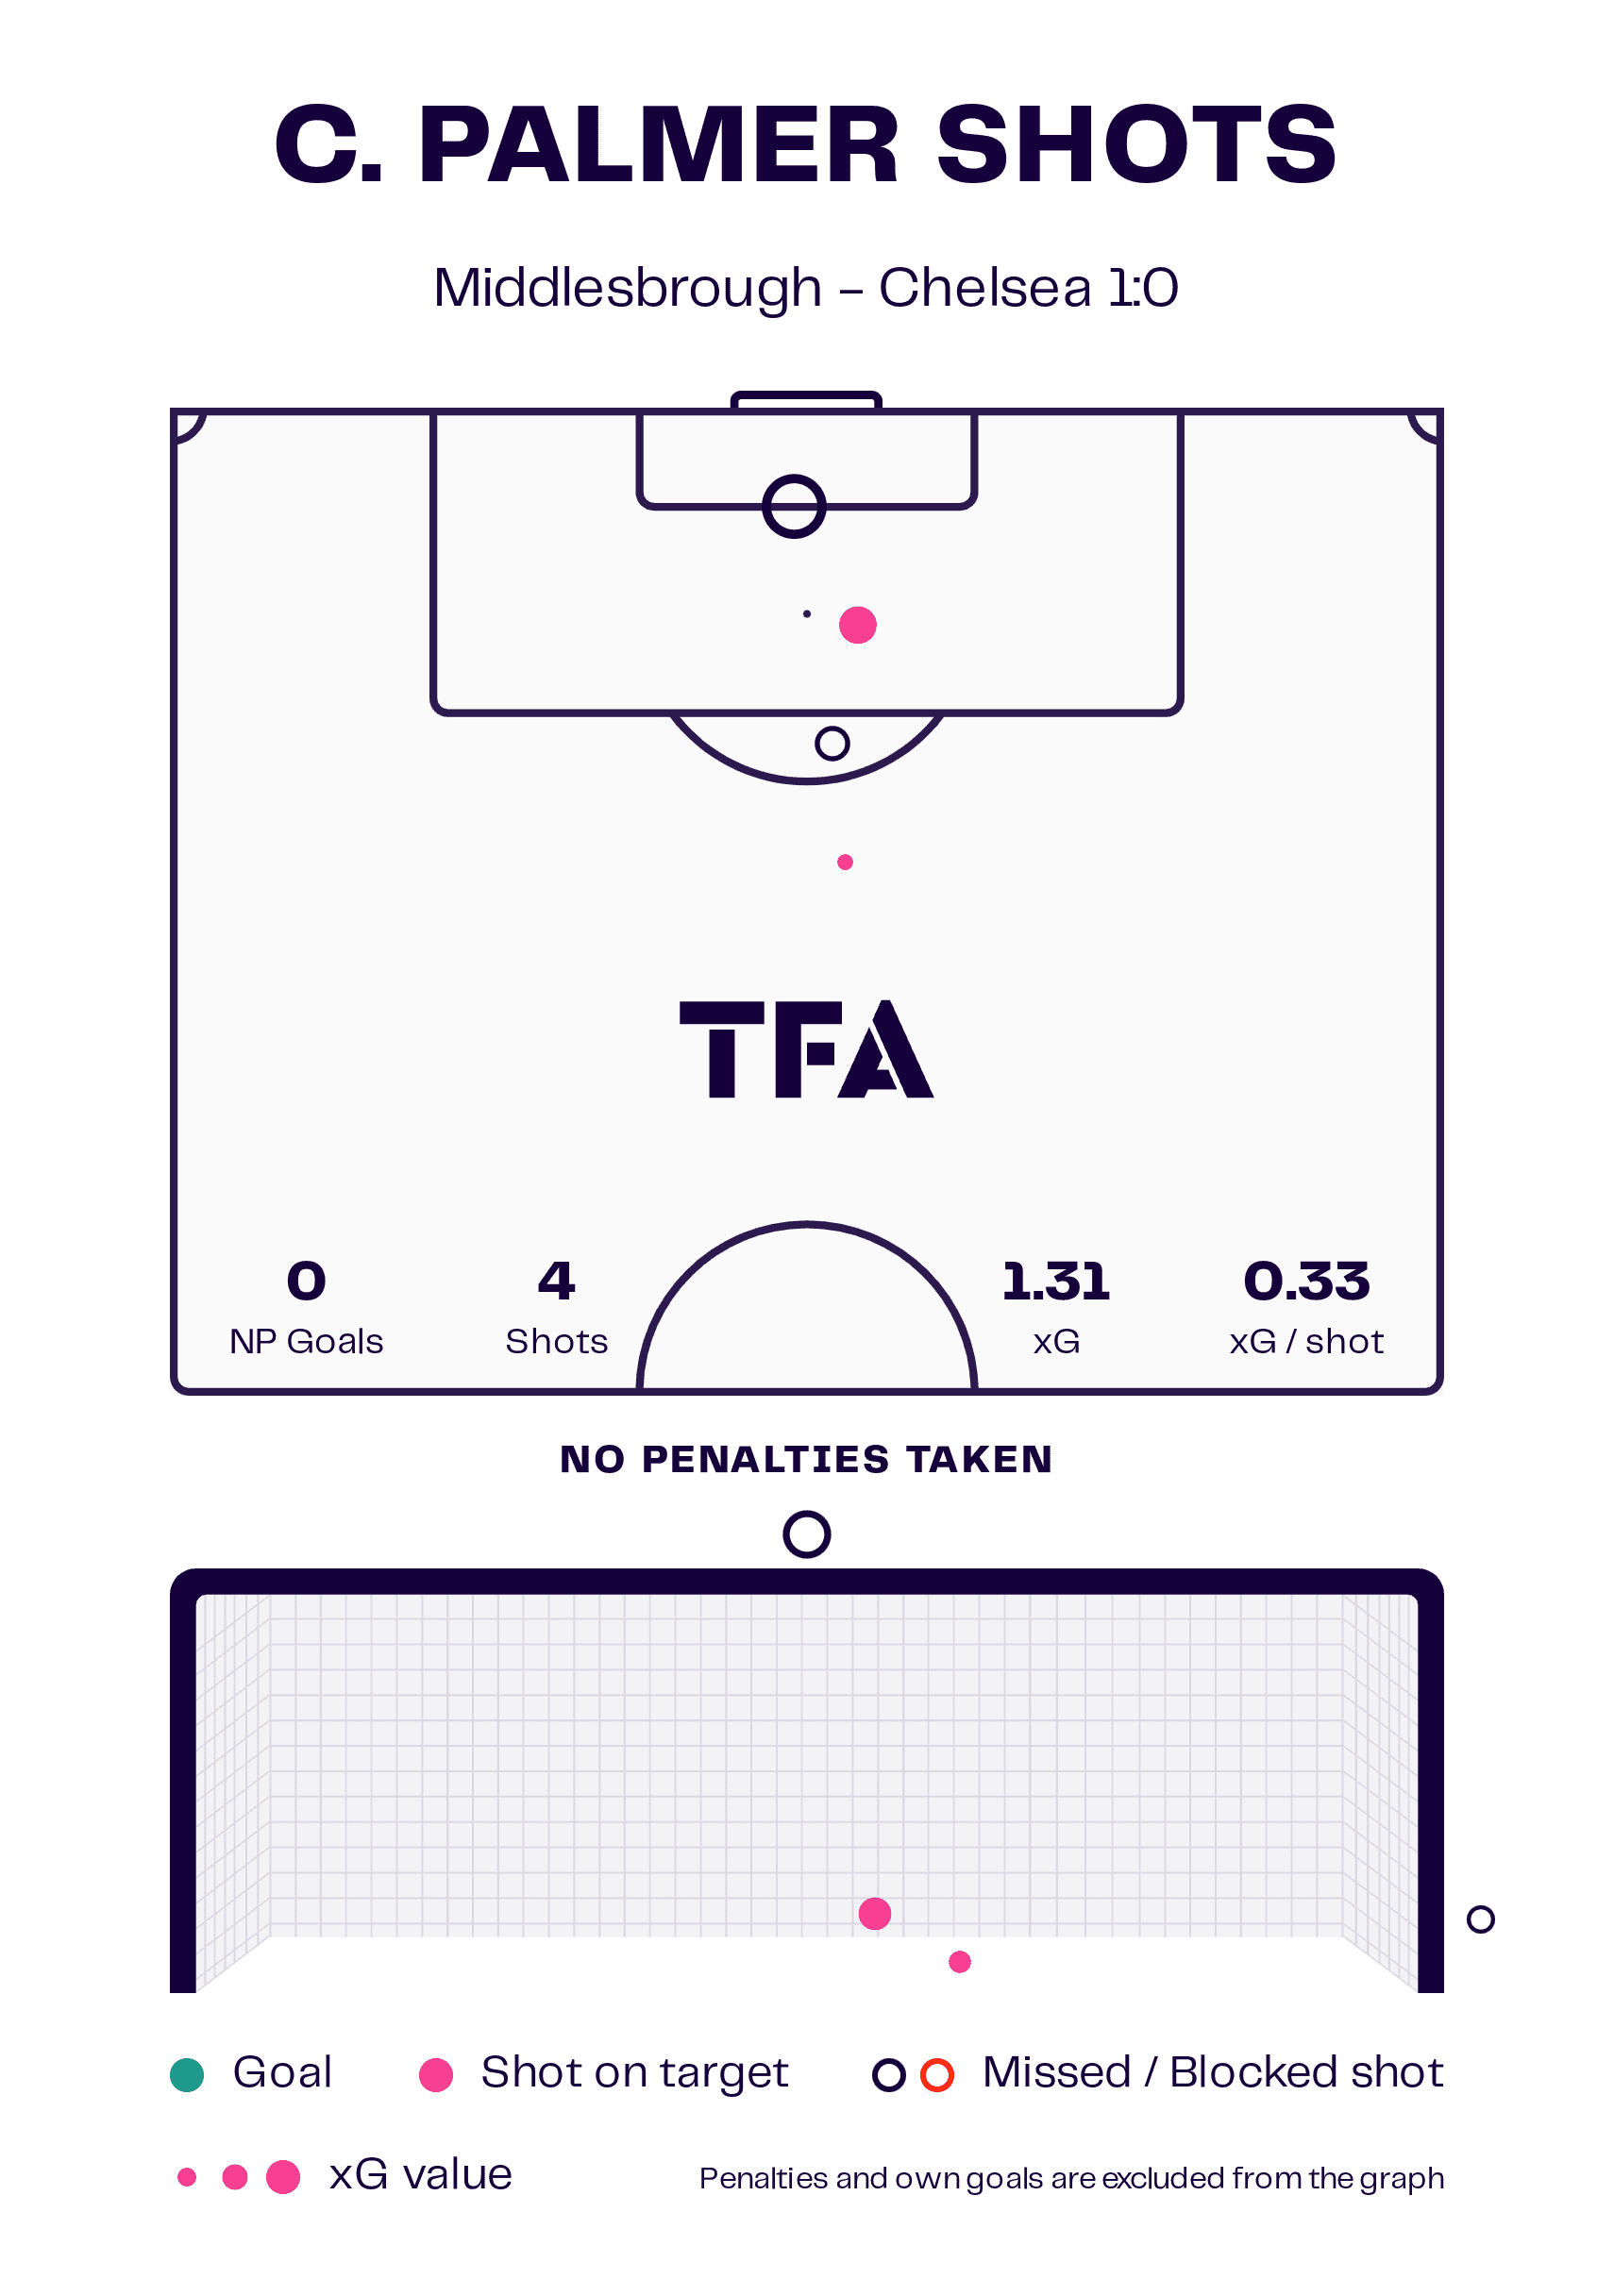
The graphic shows that, given his efforts, Palmer should have found himself on the score sheet at least once.
But half of Palmer’s efforts were created courtesy of errors by Middlesbrough players rather than build-up play by Chelsea.
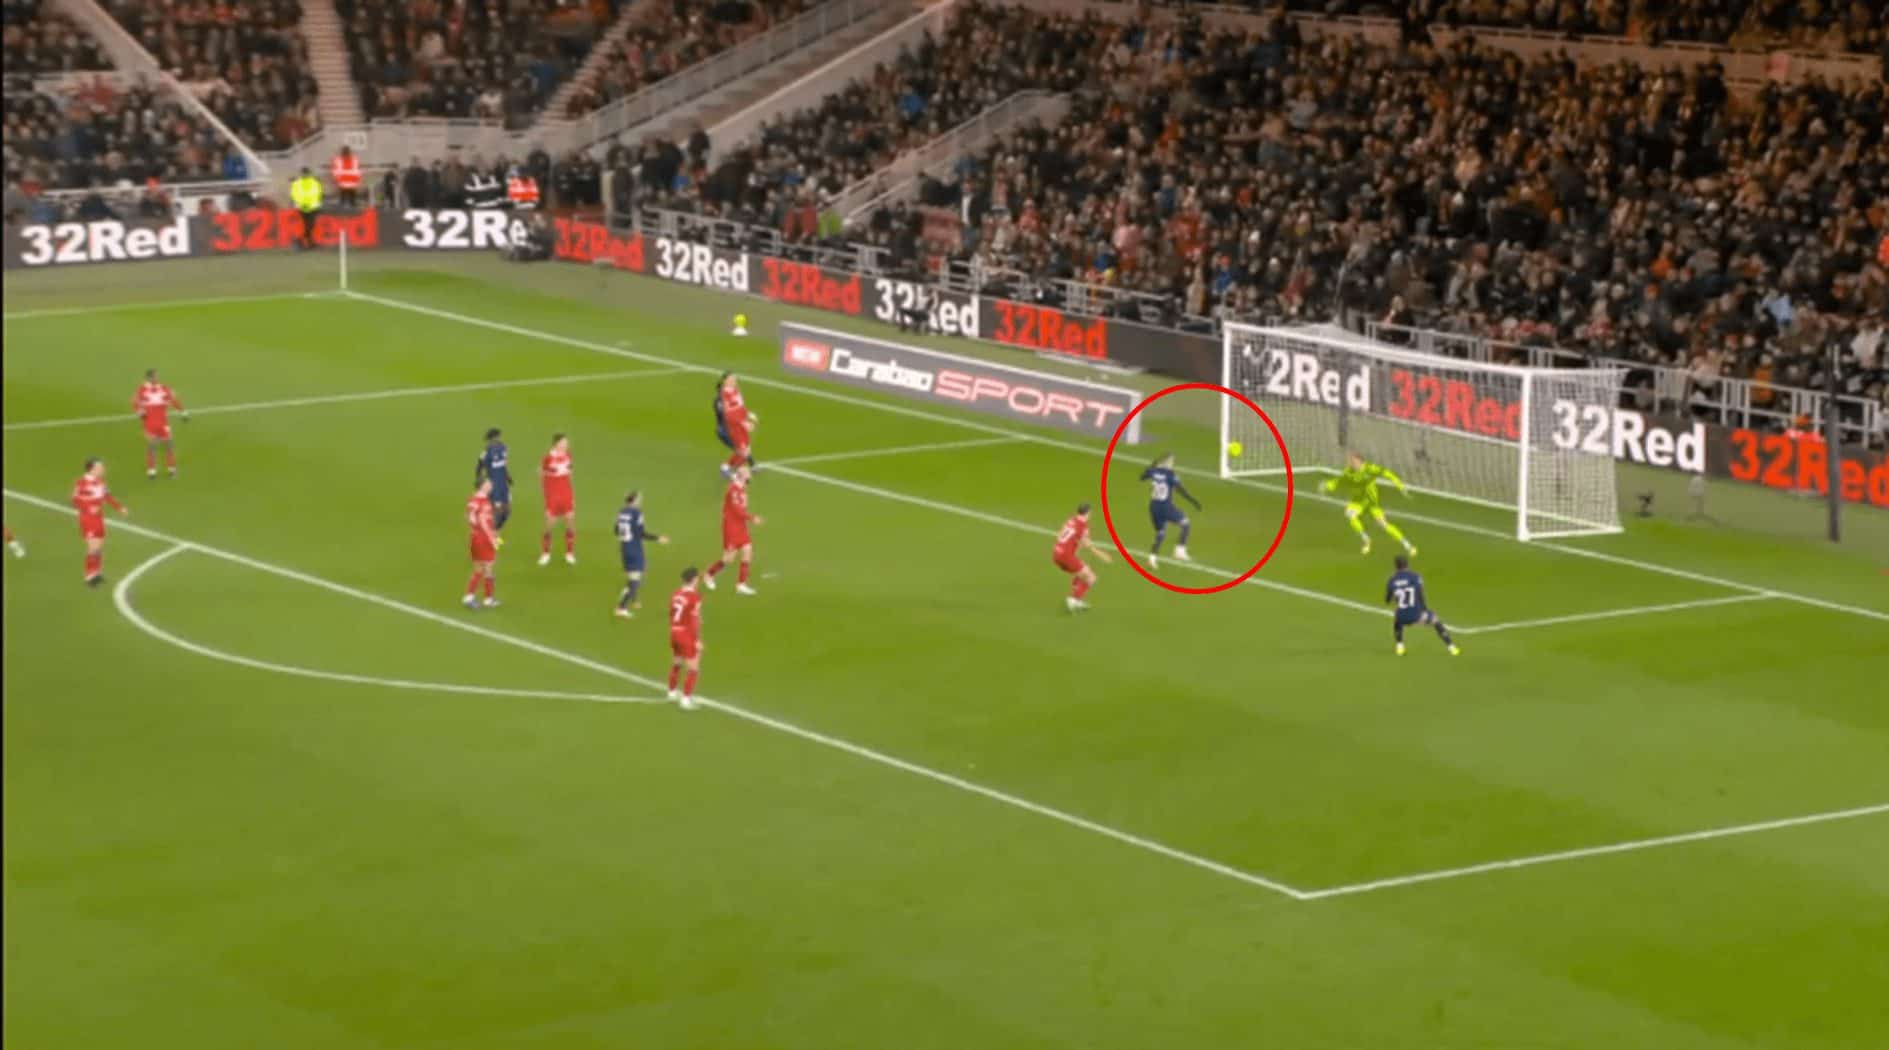
Goalkeeper Tom Glover dropped an Enzo Fernández shot, and Palmer had an open goal to aim at, unopposed.
However, the youngster scooped his attempt over the bar.
This miss came after an off-target attempt following a misplaced pass by Jonny Howson.
The previous graphic showed that all of Palmer’s efforts came from a central position, and it was through the centre that Chelsea tried to break down the Middlesbrough defence.
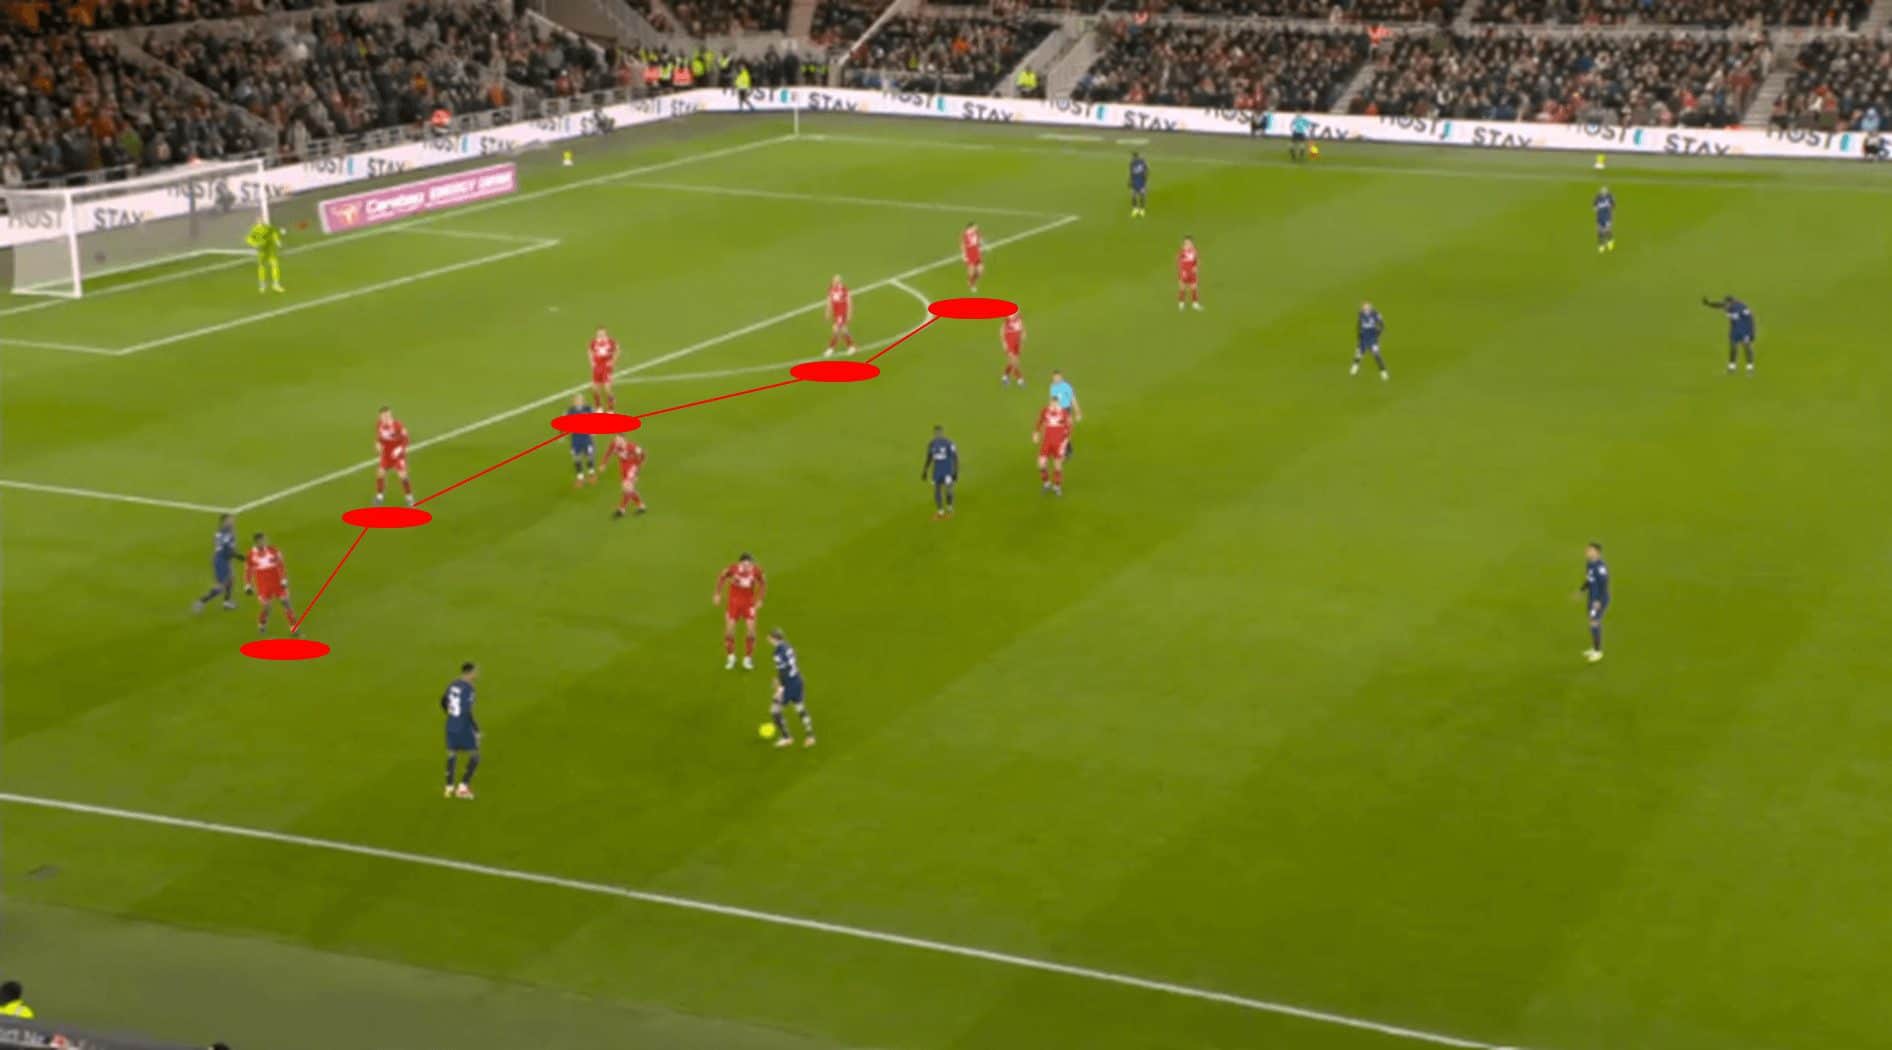
However, the Blues were unable to find a way past the low block adopted by Boro.

Although Michael Carrick’s side lined up in 3-4-3, out of possession, the wing-backs would drop deep to form a back five.
Moreover, the forward players sat deep inviting the Chelsea pressure and putting the onus on the Premier League side to find a way to goal.
Chelsea tried to play through the Boro backline but the second-tier side were resolute and well-organised with their shape and positioning without the ball.
As Chelsea tried to break forward, they often found Boro bodies in the penalty area clearing the danger.
Furthermore, as the clock ticked on, Chelsea found themselves restricted to hopeful long-range efforts from outside the penalty box.
This demonstrates that even without the ball, it is still possible for teams to frustrate the opposition’s attack.
Pochettino’s side would look to pass into the channels, but their end product from the wide positions was poor.
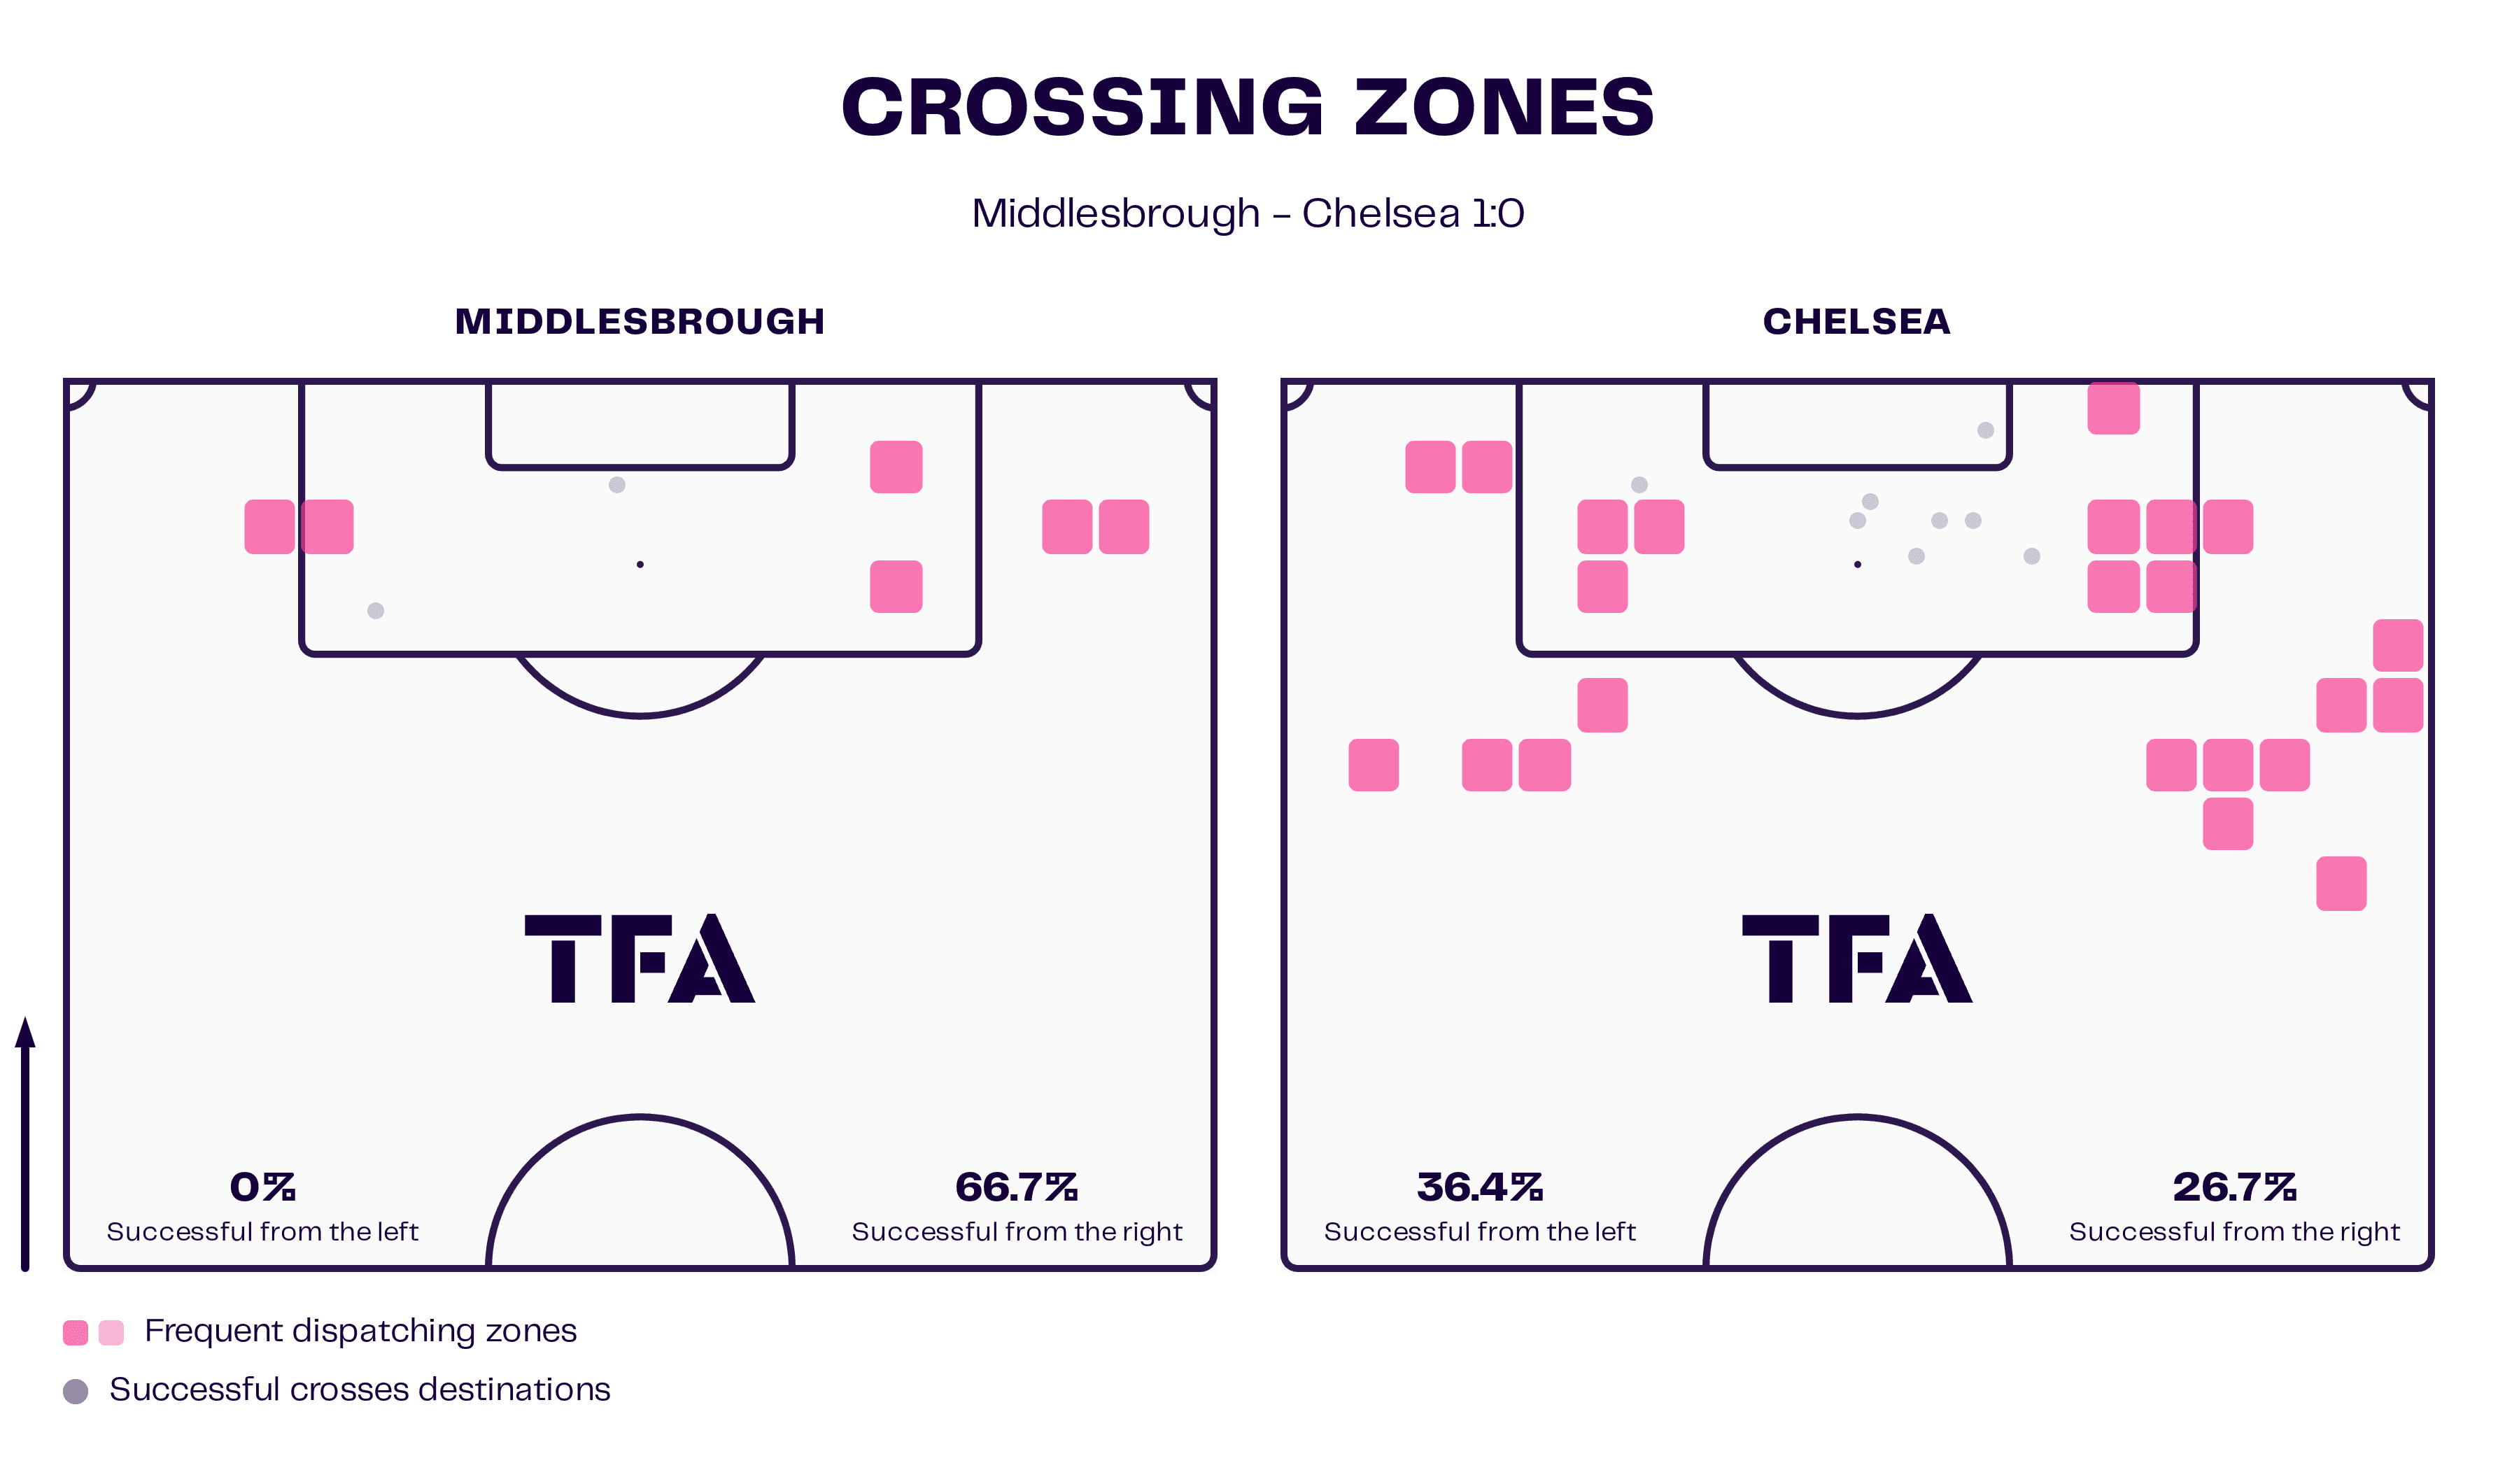
The graphic shows that Chelsea were wasteful with their crossing with only 36.4% successful crosses from the left and 26.7% from the right.
Although Middlesbrough were not a threat from the left channel, they were from the opposite flank.
Boro had a higher percentage of successful crosses down the right-hand side than both of Chelsea’s flanks combined.
Carrick had identified the weakness in the Chelsea backline: Levi Colwill at left-back rather than his more natural position in the centre of defence.
It was through exploiting this weakness that Boro was able to take the lead.
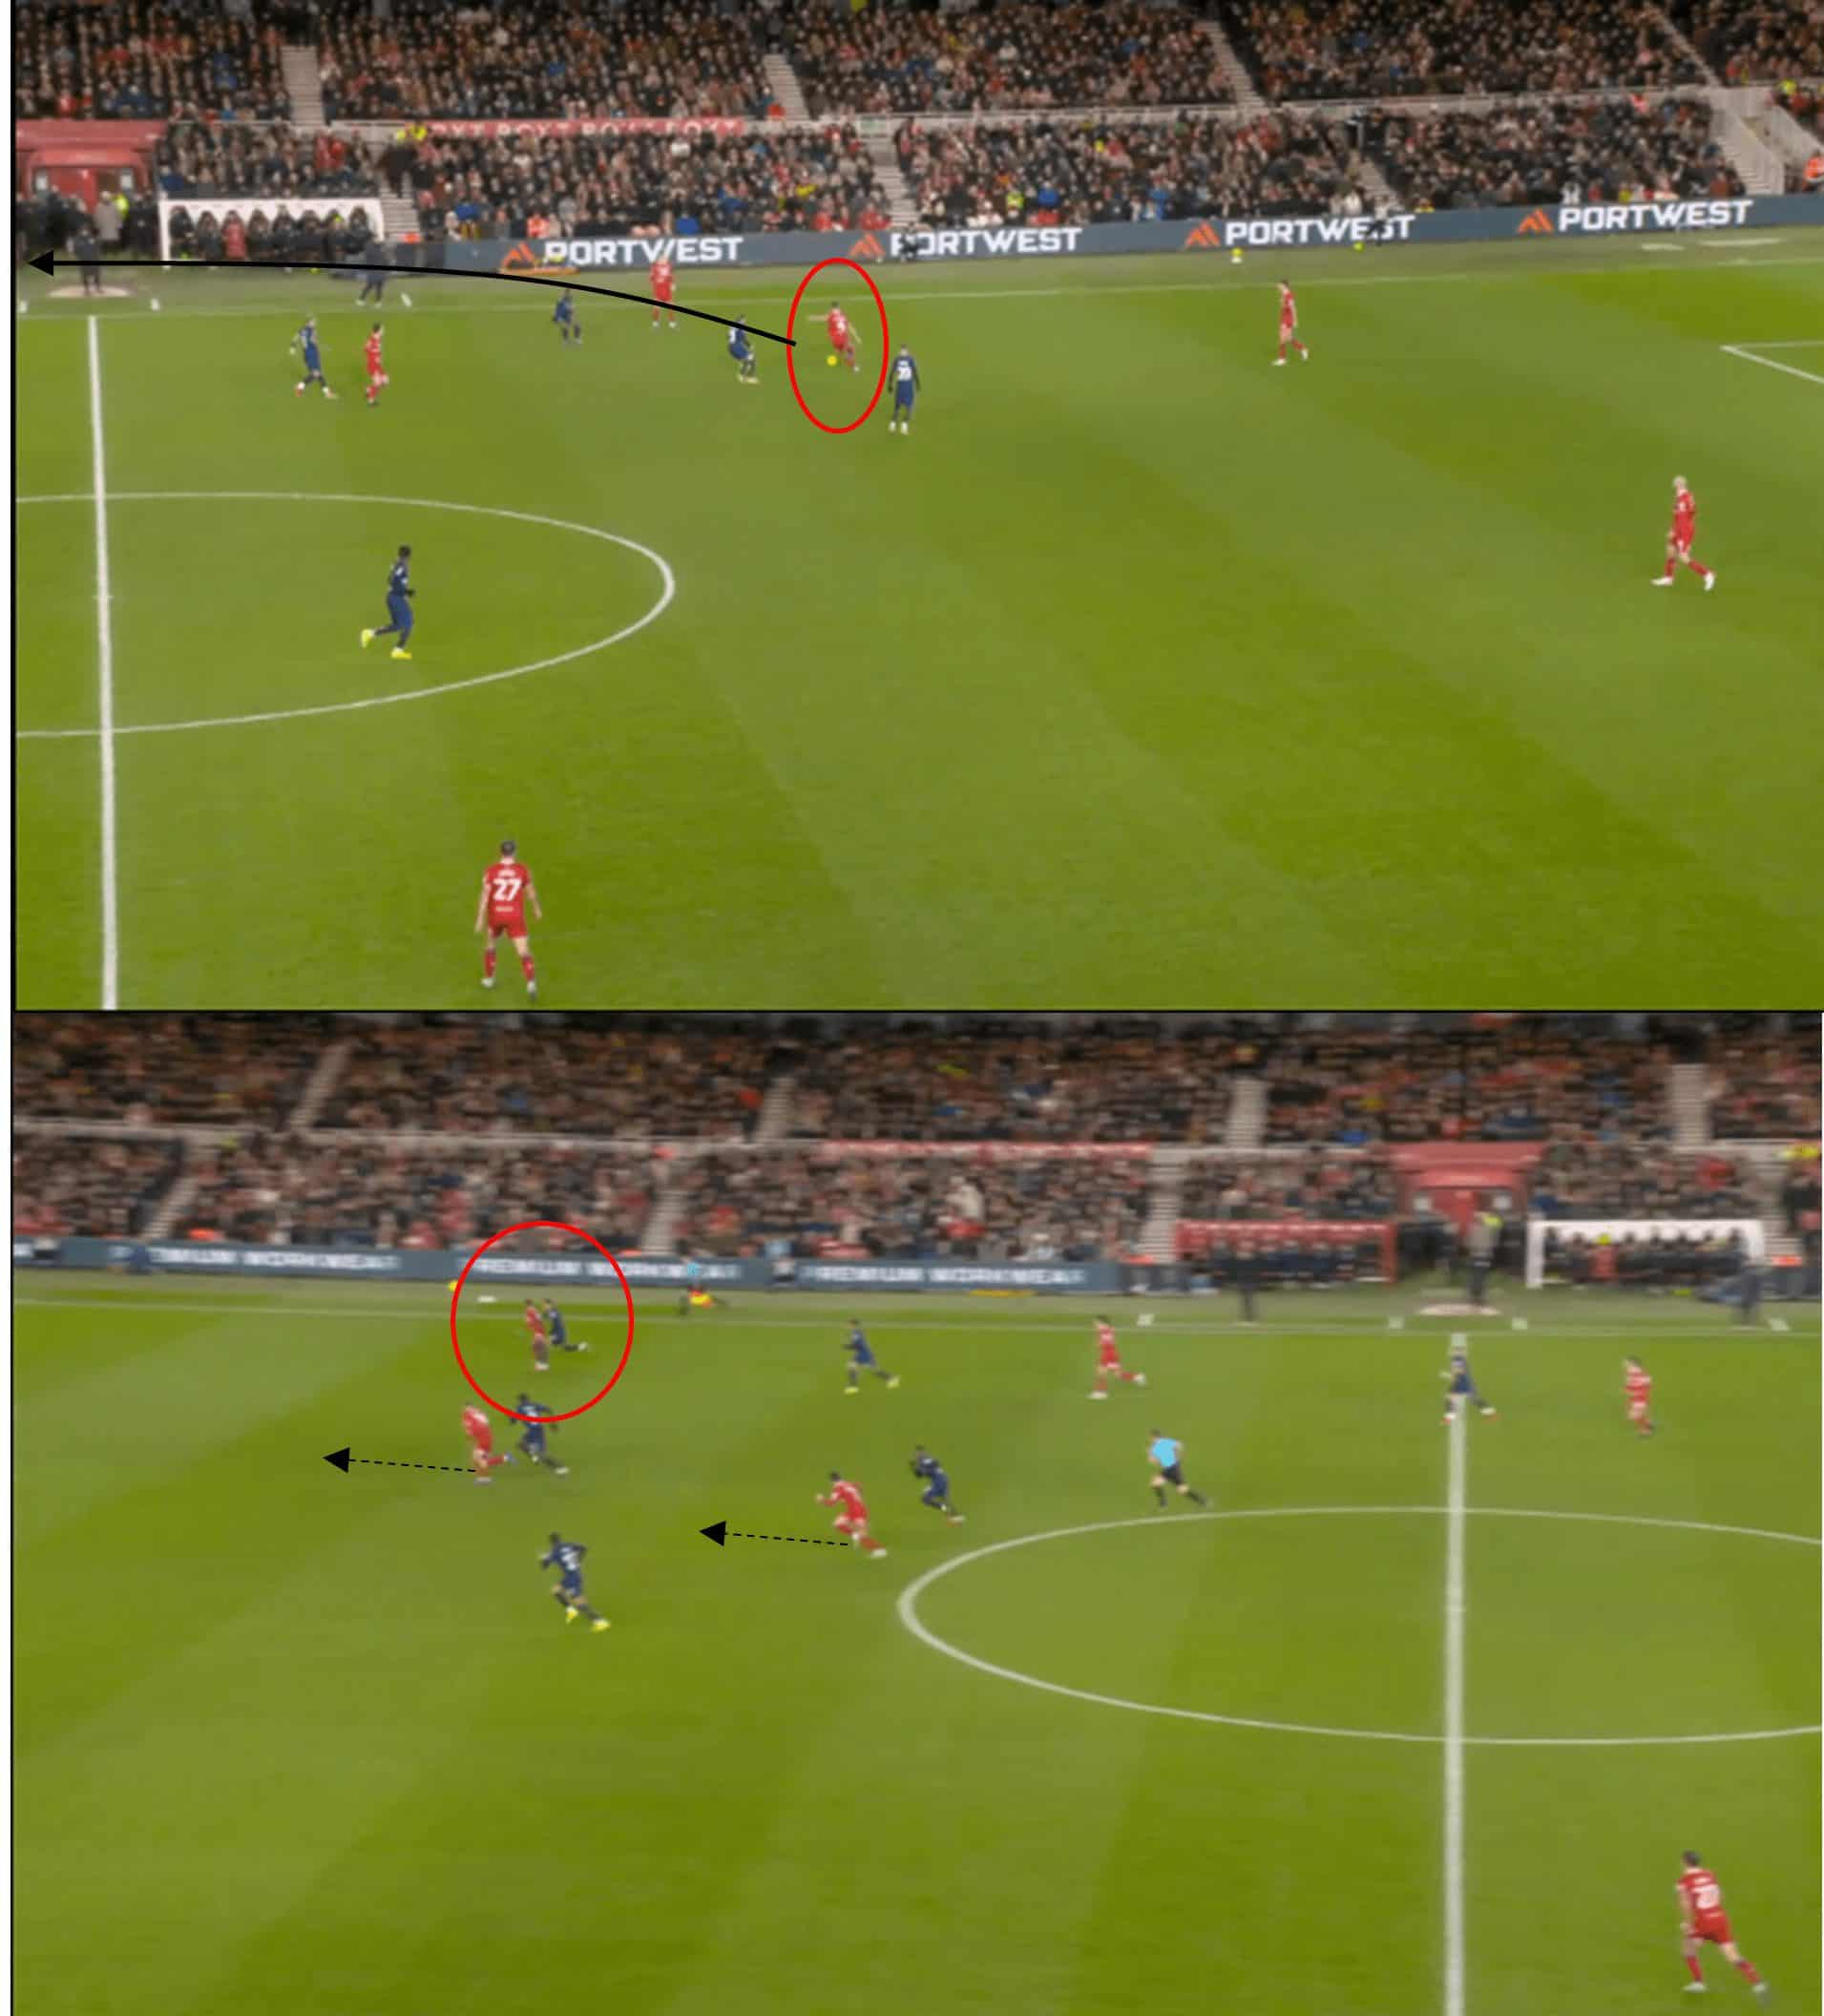
The match still shows the long ball played by Dan Barlaser down the right channel for Isaiah Jones to latch onto.
Jones was able to outpace Colwill, for not the first time in the match, to eventually cross for the advancing Hayden Hackney to score.
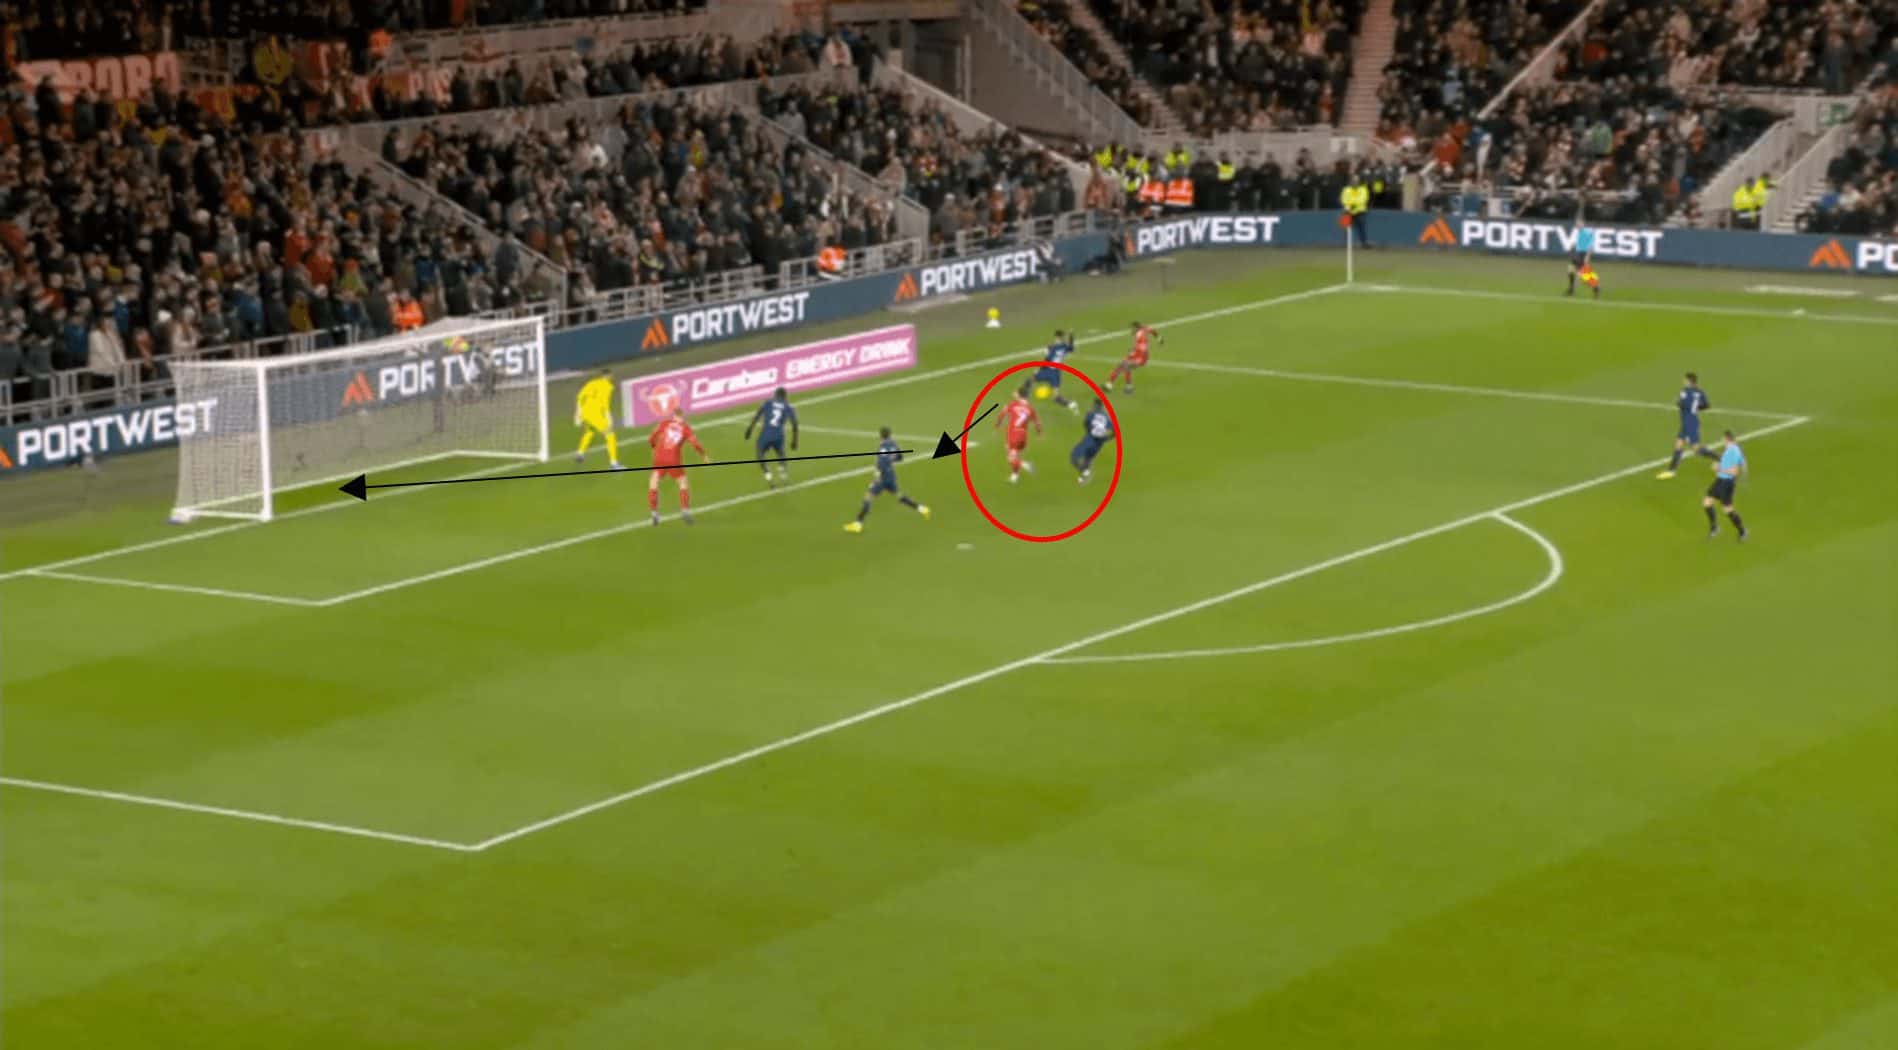
Even though Jones had the better of Colwill to get a cross away, it is arguable that had Moisés Caicedo continued to track the run of Hackney, the midfield youngster may not have been able to get a shot away.
It shows that despite the overall pressure that a team can apply with the ball, individual errors can still occur, which can prove costly, as it did in this game.
Boro will have undoubtedly been aware that they would not have been expected to outplay Chelsea, and with this in mind, they had a plan such that when they had possession, they ensured they were productive with it.
It was a blow for the Teessiders to lose the pace of forward Emmanuel Latte Lath and Alex Bangura due to injury in the early stages of the encounter.
However, they were still able to execute counterattacks with the players at their disposal.
The Championship outfit only had six efforts on goal against the Blues, but when their chance came, they took it.
Whilst this is an example of possession-based football not being rewarded in a single game, what about throughout a season?
The unusual case of Notts County
Prior to Luke Williams’ move to Swansea’s managerial dugout, Notts County had been a heavily possession-based side, which is somewhat unusual for England’s fourth tier.
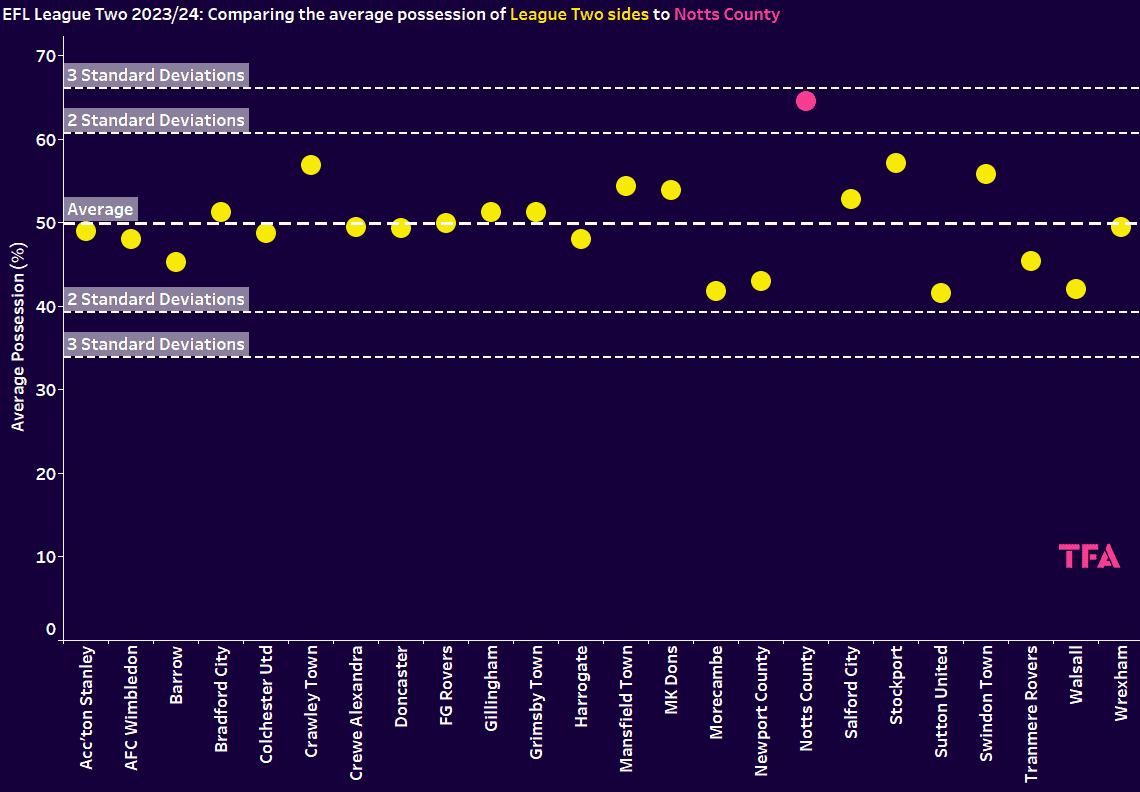
The above graph plots the average possession for each side in EFL League Two as well as the league average possession and corresponding standard deviations such that any teams above or below the three standard deviation lines are considered outliers and those above or below the two standard deviation lines, are unusual.
A look at the above graph shows that at the time of writing, Notts County are unusual for their possession play, averaging 64.8% of the ball.
A much higher average than their competitors.
With such dominance, it would be expected that the East Midlands side would be top of the league.
Whilst they currently occupy one of the playoff spots, their goal difference is only +8.
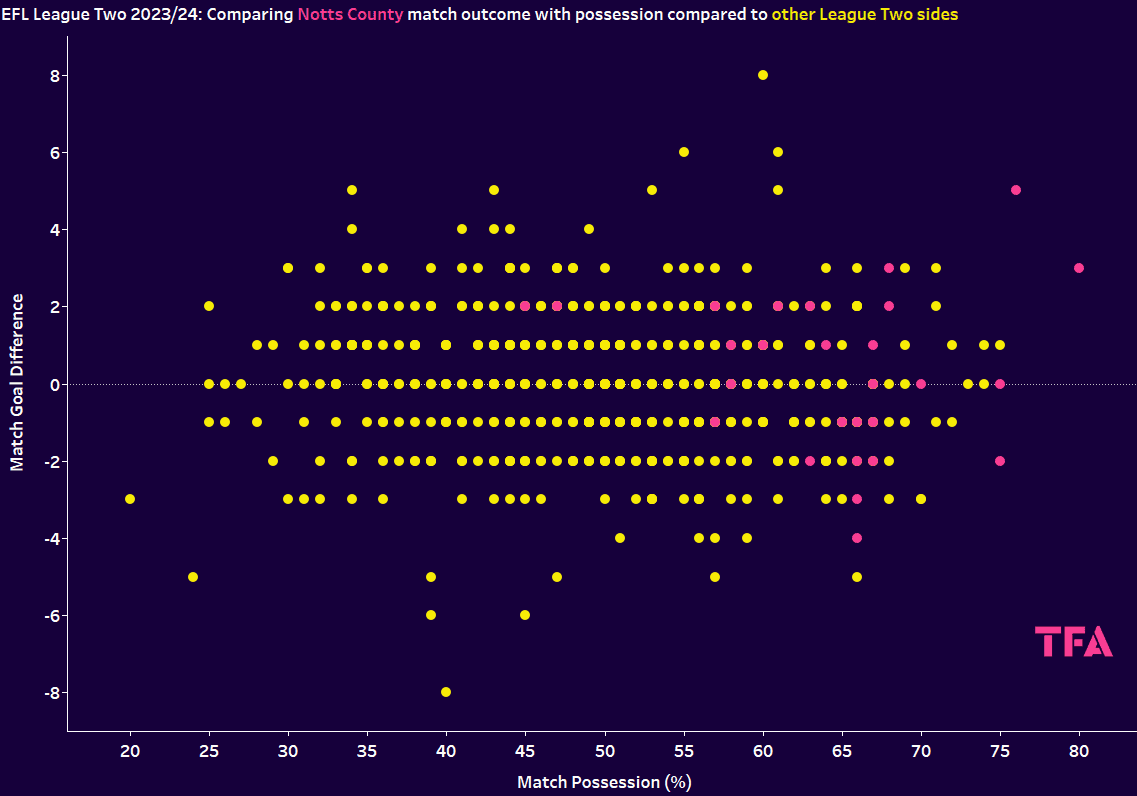
The graph shows the average possession for each team in League Two for each of their respective games this season and the corresponding goal difference outcome for each respective match, with the Notts County possession statistics represented in pink.
It is shown that there is no obvious pattern between the two variables.
For example, County often has high possession in games, but most of their games result within a +/- two-goal difference.
This highlights that possession does not guarantee success, as it is shown that teams with less than 50% possession have still won matches with a comfortable goal difference.
At the time of writing, Notts County FC are the current top goal scorers in the fourth tier, but also, only four sides have conceded more.
Of the twelve worst defences in the division, County is the only top-half side to feature.
Their evident weakness is their defence despite often dominating the play.
A particular weakness of County’s is defending set plays.
They have conceded 11 non-penalty set play goals despite a 6.44 expected non-penalty set play goals against.
Even in open play, they often struggle with defending crosses.
The Magpies play a relatively high line and have been prone to be dispossessed within their own half.
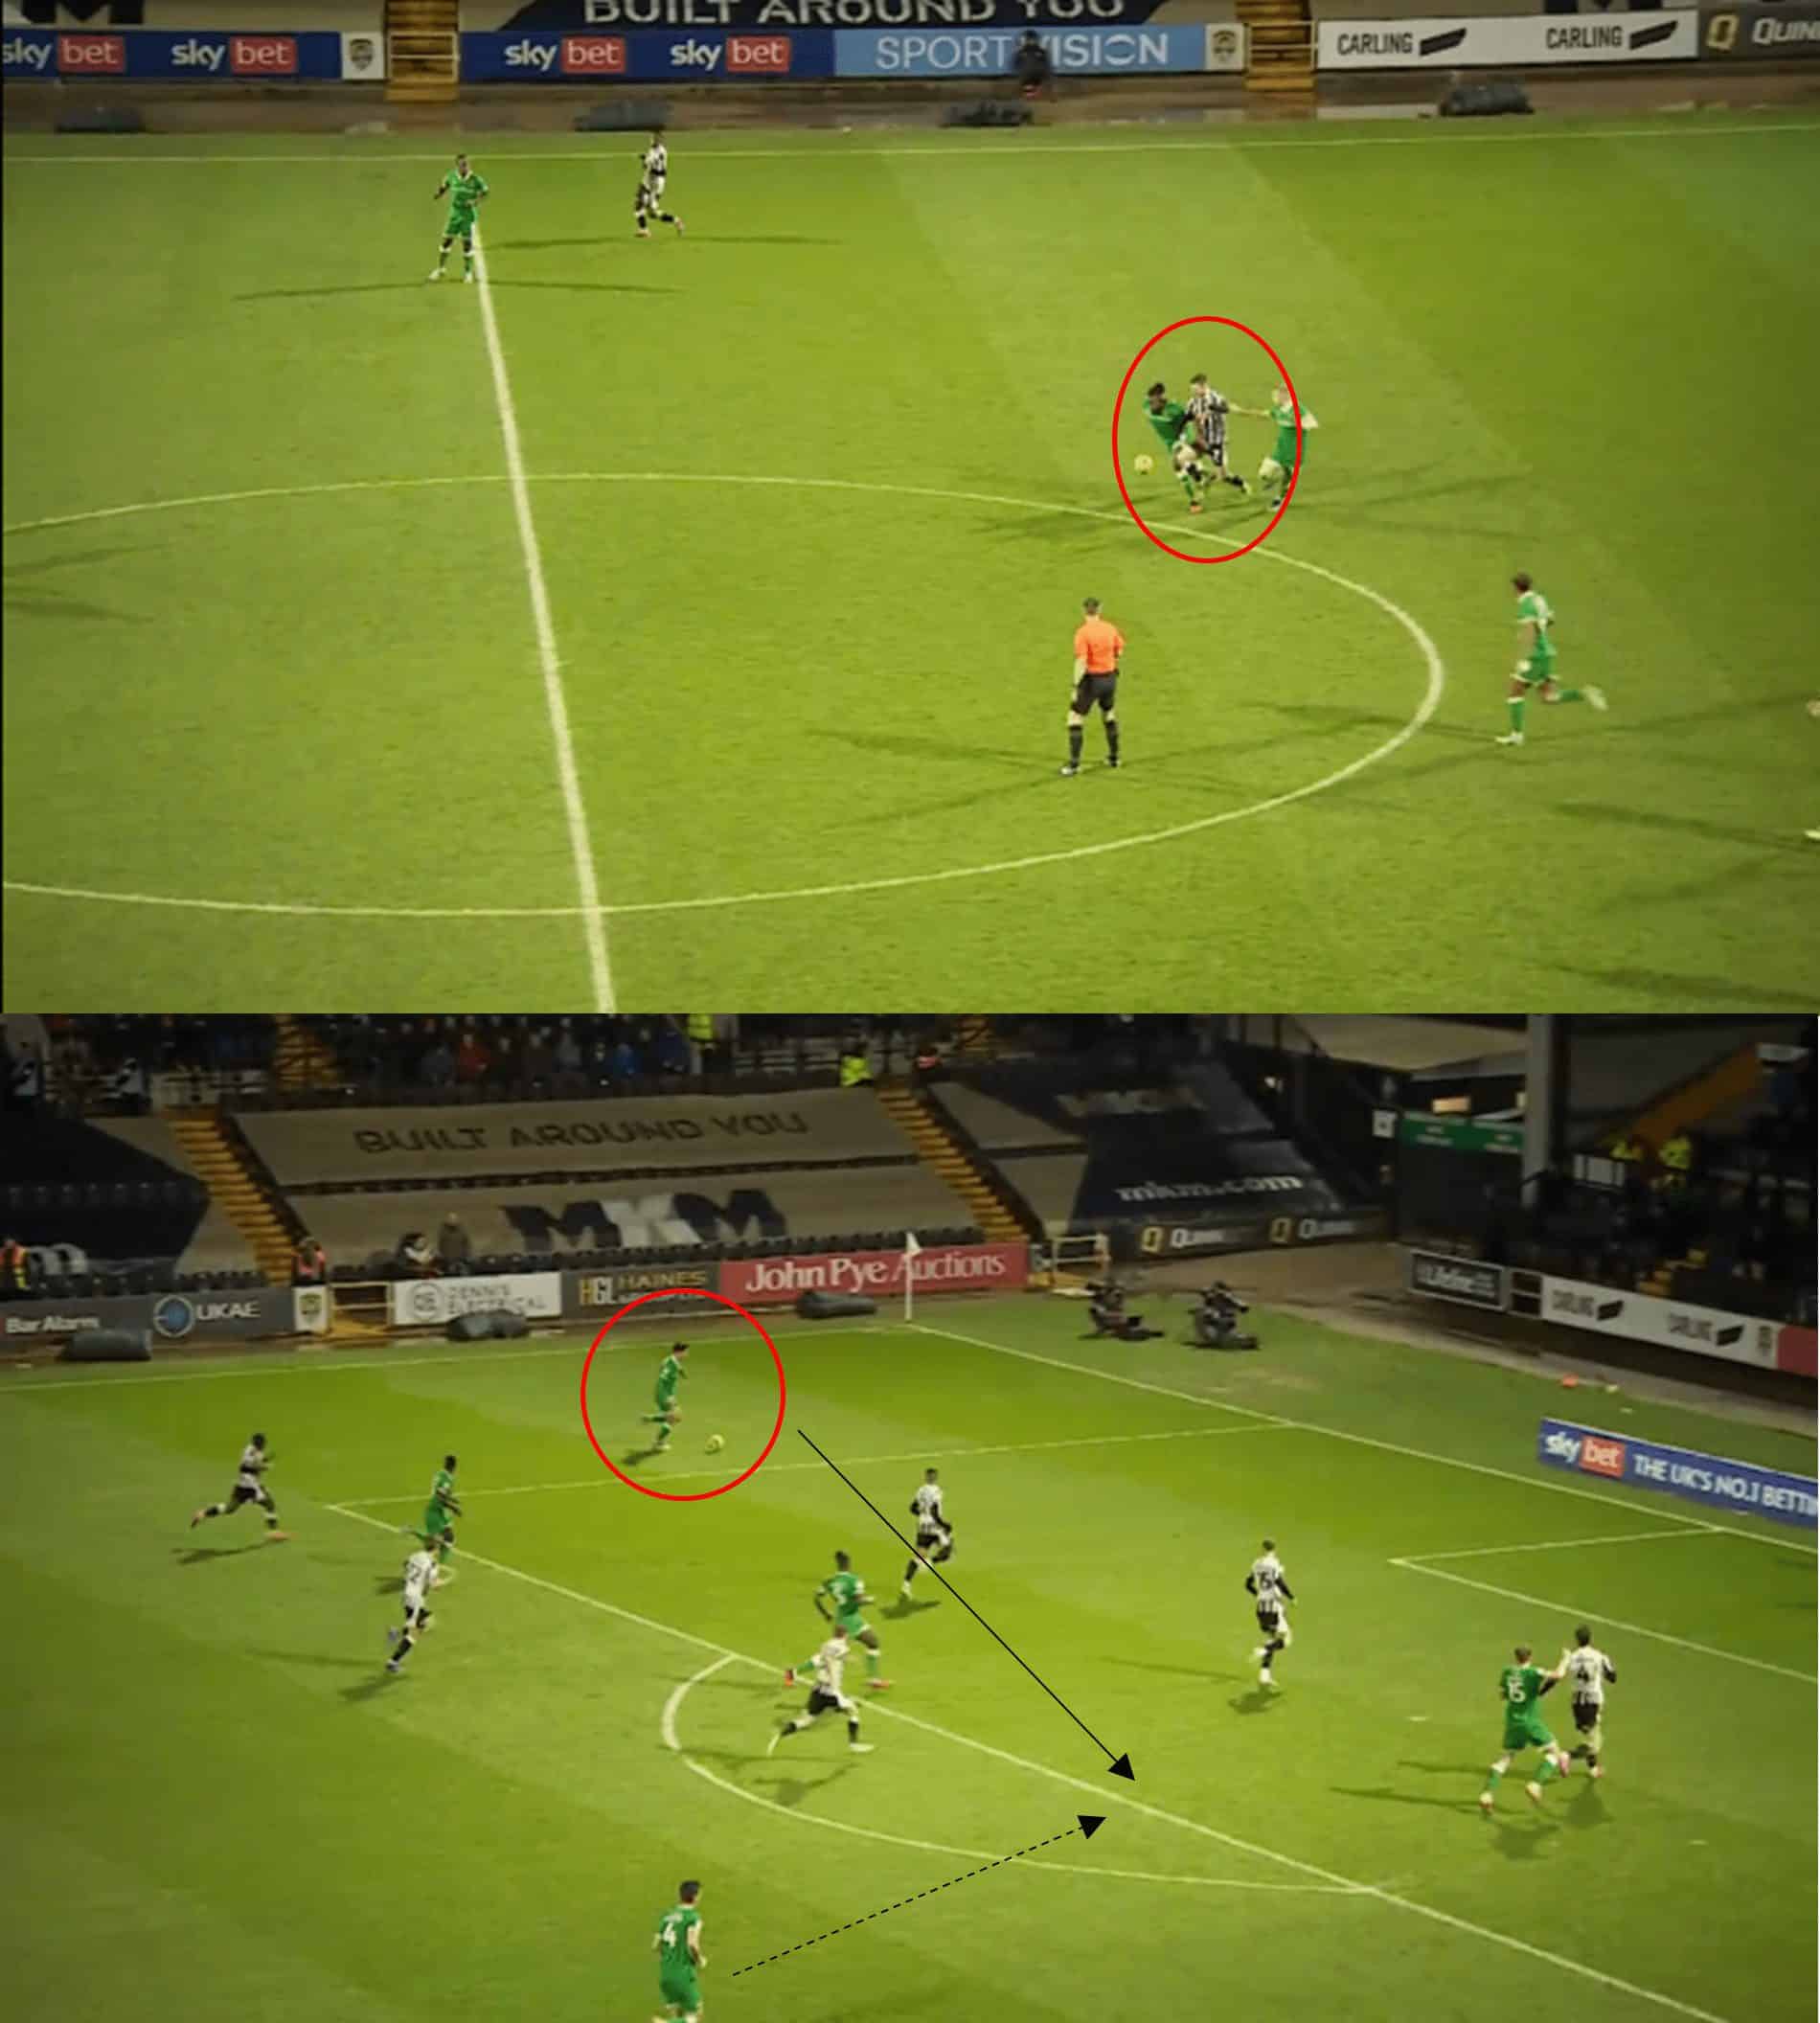
In this example, as Notts County have attempted to advance, they are outnumbered in the midfield and are dispossessed.
The ball is quickly distributed out to the wing, and a low cross is played across the box for the advancing opposing player to score.
It is noticeable how County were unable to track the run of the midfielder, and as a consequence, they were punished.
It shows that teams need to make their movements count as much without possession as with it.
Lack of attacking ideas costly
In the Spanish Segunda division, FC Andorra currently lies in 18th position, above the drop zone on goal difference.
This is despite dominating the possession charts, averaging 65.9%.
It is a similar story in Germany’s second tier, as Magdeburg currently sits 13th at the lower end of the table, but tops the division’s possession table, averaging 61.2%.
Similar to Notts County, neither of these sides is meeting defensive expectations, with more goals conceded in their leagues than expected.
However, it is unlikely the Magpies, these two sides, are also struggling to find the back of the net.
Coincidently, FC Andorra and Magdeburg have expected goals tallies ranking among mid-table mediocracy within their respective divisions.
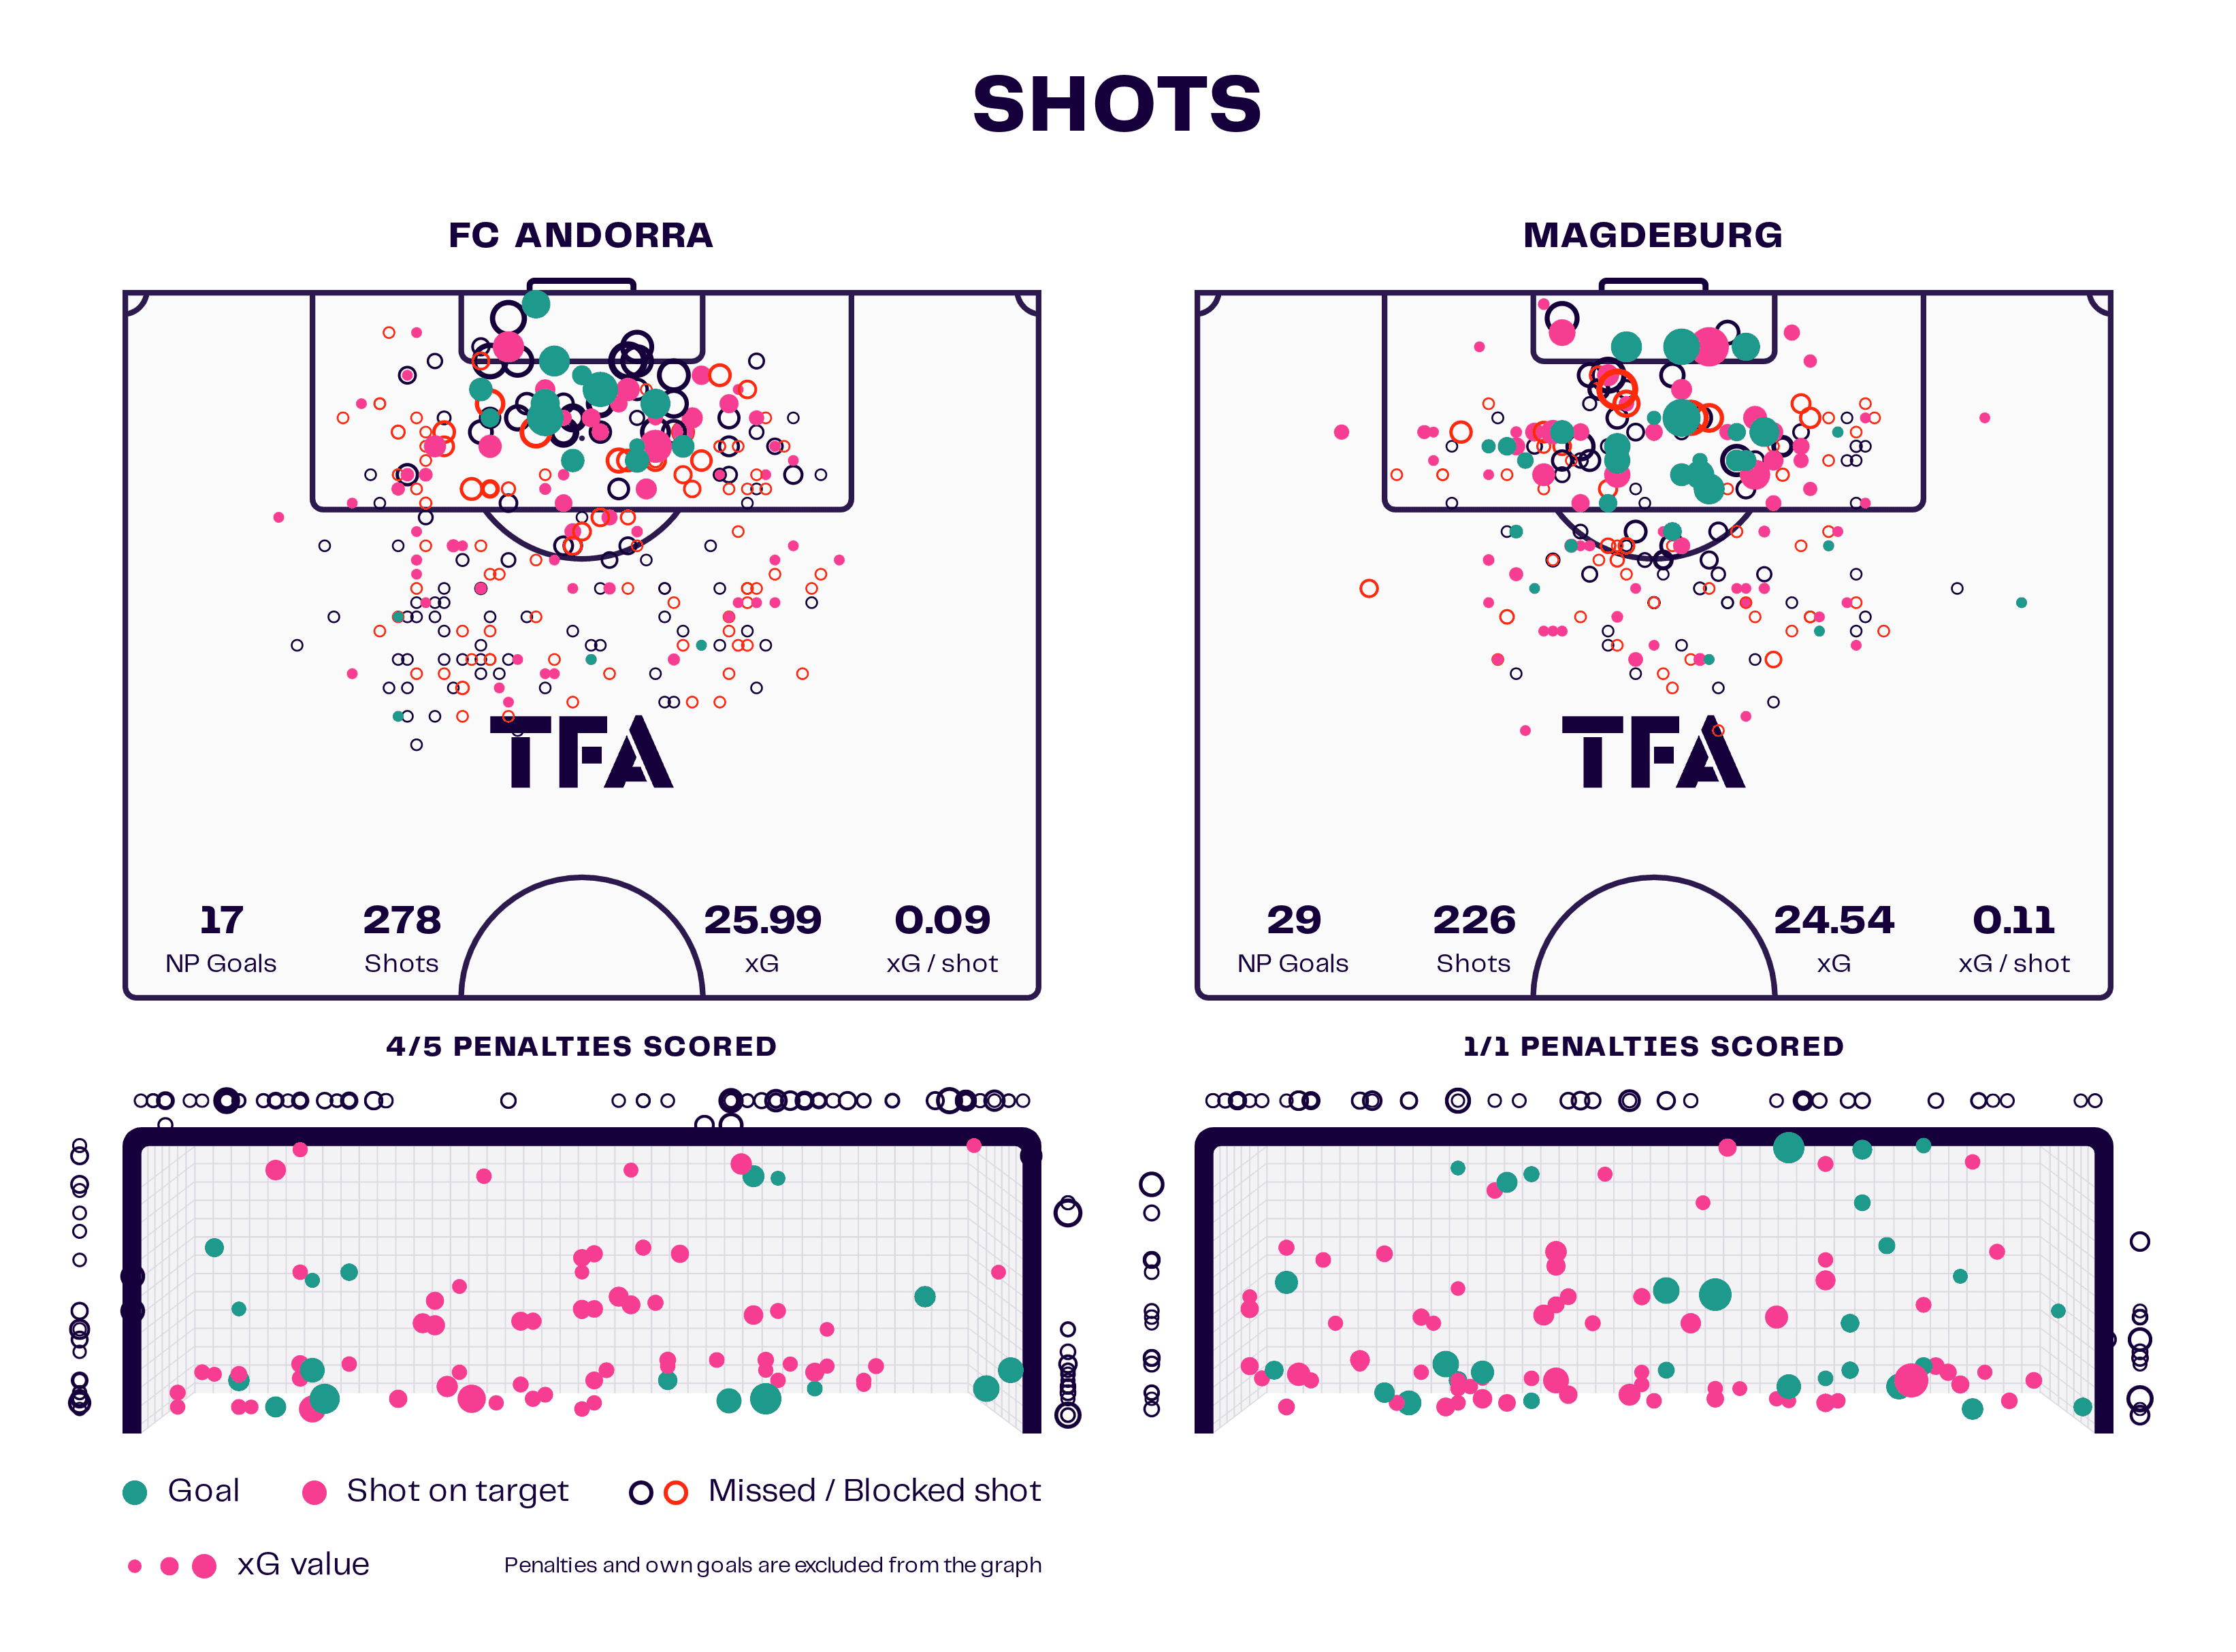
In FC Andorra’s case, they have only scored 21 goals, which is lower than expected, as seen above.
Only three sides have scored fewer in the league.
In contrast, Magdeburg has scored 30 goals, suggesting they are overachieving in their attacking play at present based on their 24.54 expected goal tally.
Despite overachieving, Magdeburg’s goals scored this season rank mid-table in 2.Bundesliga.
Regardless of whether these two sides are overachieving or underachieving, the fact remains that neither side is creating plenty of chances their possession game would be expected to warrant.
Moreover, considering the previous shot graphic for each side, it is noticeable that both teams have been restricted to long-range shots with low goal expectancies.
It suggests they struggle to find space in the penalty area for better opportunities.
Whilst FC Andorra’s long-range efforts regularly fail to hit the target, Magdeburg has been much more fortuitous, dispatching more of such long-range efforts.
This would explain why the Germans are overachieving in front of goal this season.
FC Andorra will look to use the wide areas in the attacking phases, but more often than not, the wingers will invert inside.
This can make them slightly predictable.
There are positives to the Spanish side’s play as they rank top of their division this season for passes into the final third per 90, averaging 40; they also rank second for progressive carries, averaging 22.1 per 90.
Despite these positives, they struggle to get the ball into the penalty area, averaging 7.18 per 90 passes into the penalty area.
This value is only slightly larger than the league average for this statistic.
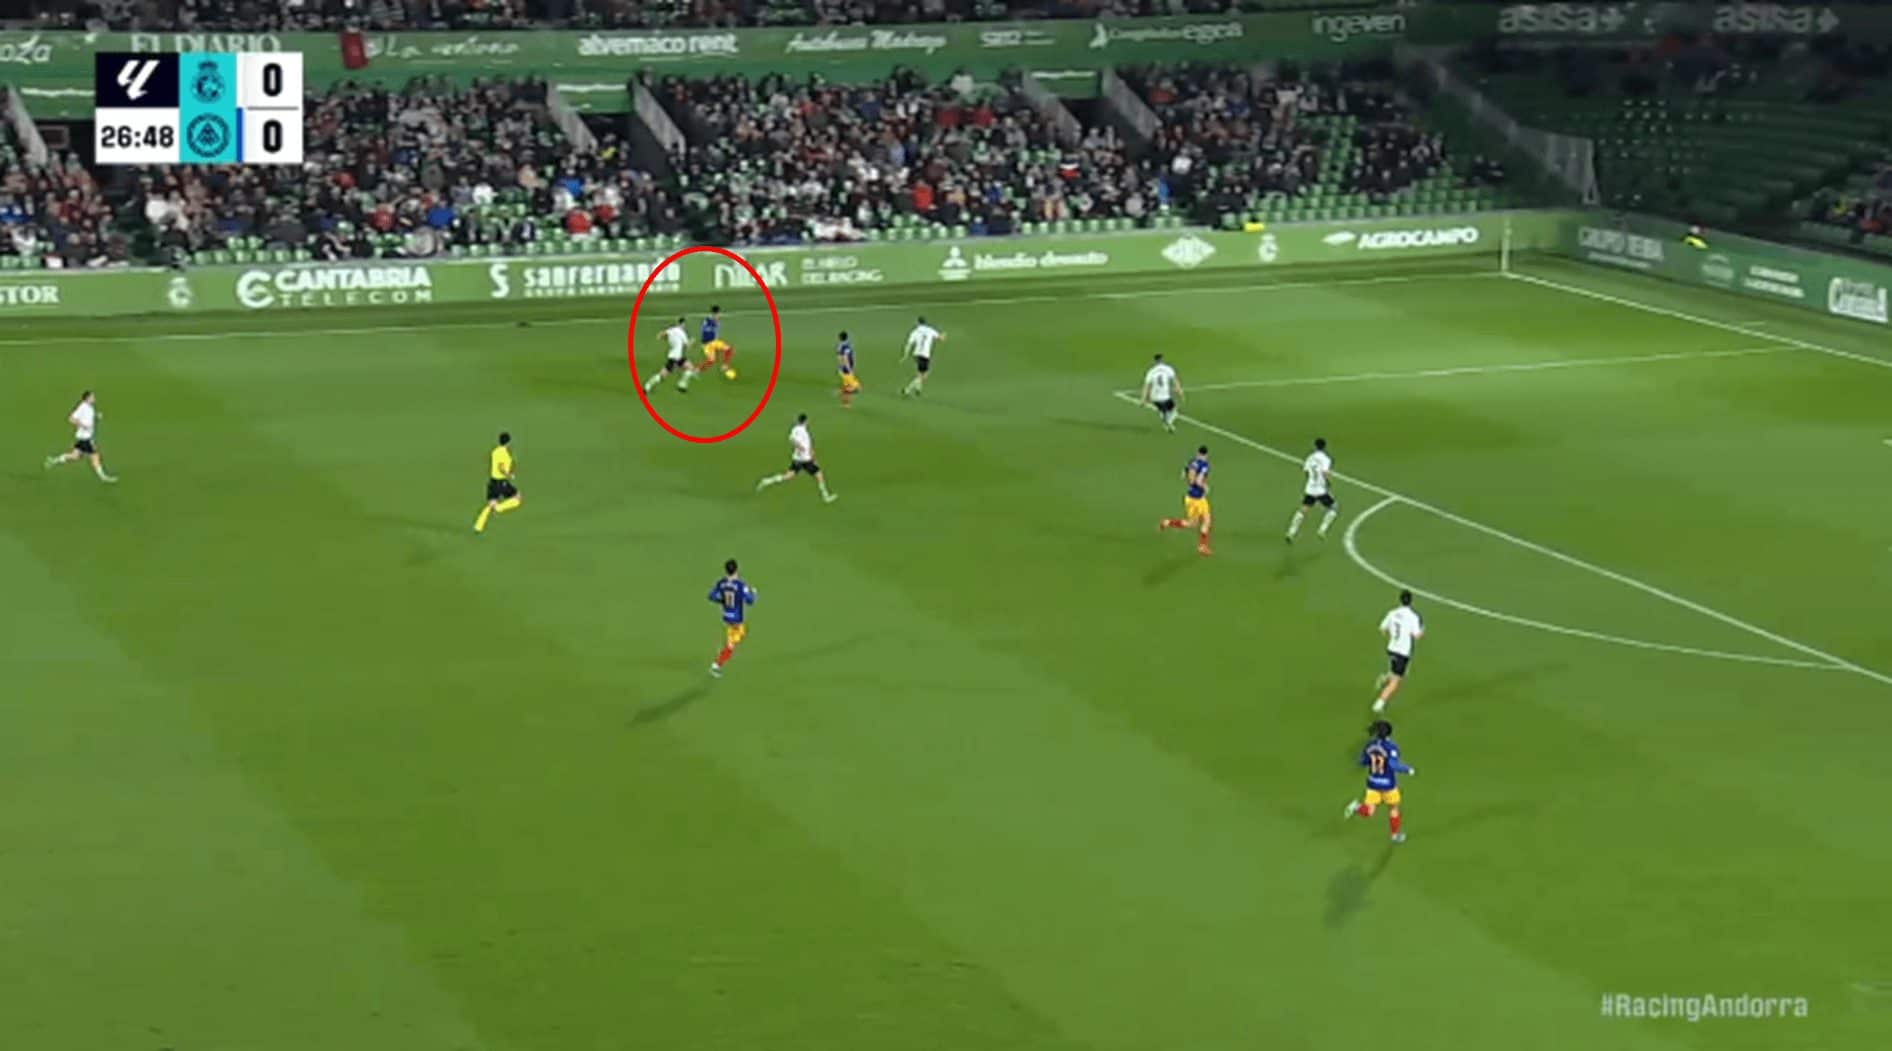
From the image above, it only took two passes from the goalkeeper’s distribution, and FC Andorra soon carried the ball into the opposition’s third.
However, instead of continuing to drive forward, the play slowed down and was passed back and forth across the flanks.
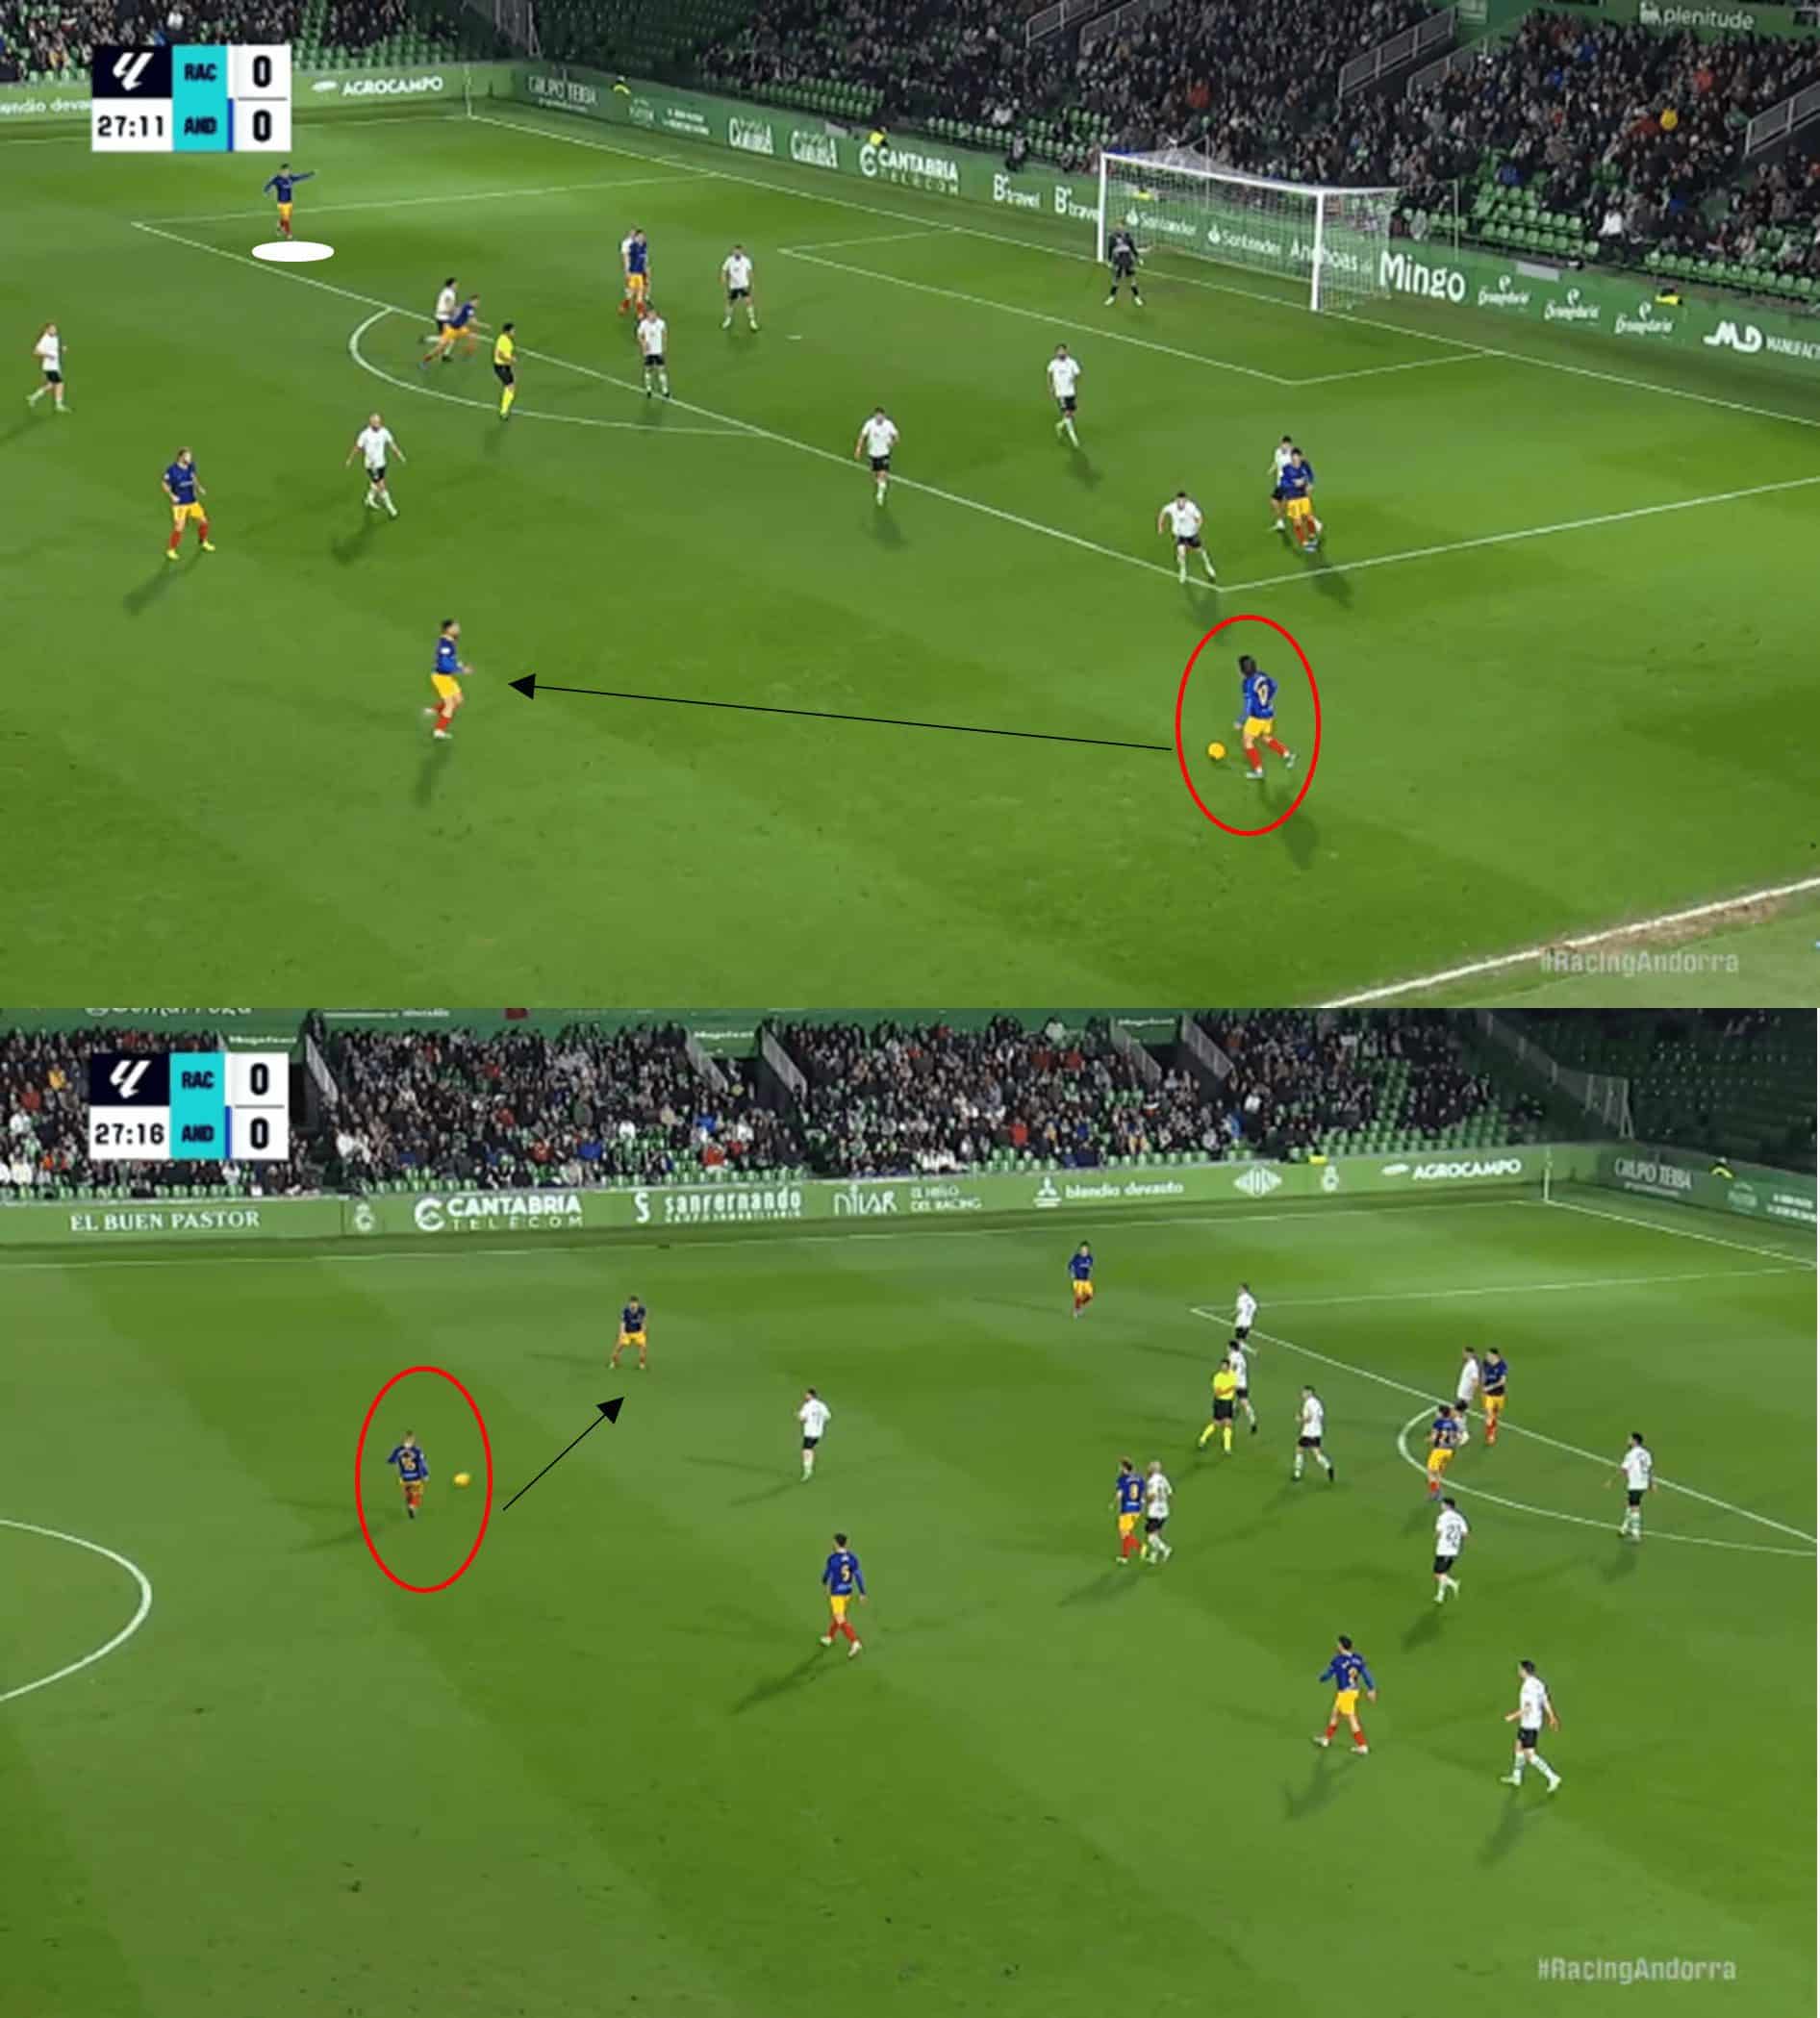
The passing continued side to side despite opportunities to cross into the area, as seen above, where Andorra had an unmarked player free to make a run towards the back post.
This particular sequence featured more than 20 passes, but the eventual cross into the area resulted in a goal kick.
This highlights their inefficiency in front of goal and carving out opportunities as their initial build-up play is very slow.
When they have had efforts on goal, a mere 28.1% of their shots in the league have been on target.
At the same time, they rank joint worst for goal-per-shot rate.
Despite over 20 matches being played in Segunda this campaign, FC Andorra’s top goalscorer is Nieto, who has four goals.
Similarly, with 17 games played, Magdeburg’s Jan Luca Schuler is their current top goal scorer with only five goals.
This shows both sides’ lack of quality in their forward lines.
However, this doesn’t paint the full picture for Magdeburg.
The German side is one of the top sides in 2.Bundesliga for efficiency in front of goal with 40.8% shots on target, and 12% of their shots have resulted in a goal.
However, Magdeburg does not rank highly for shots per 90.
This suggests that they are less adept at creating attacking opportunities.
Magdeburg are a very composed side on the ball and comfortable in passing in dangerous areas within their own third, but they lack movement to facilitate seamless transitions through the thirds of the pitch.

In the above match still, the keeper’s positioning has enabled the full-backs to advance up the field, but the marked double-pivoted midfielders lack movement in creating angles to play through the opposition.
The ball is subsequently played across the defence and back to the goalkeeper, who launches a long ball.
A lack of creative off-the-ball movement meant possession was gifted back to the opposition.
But this issue isn’t just about playing the ball out from defence for the German side.
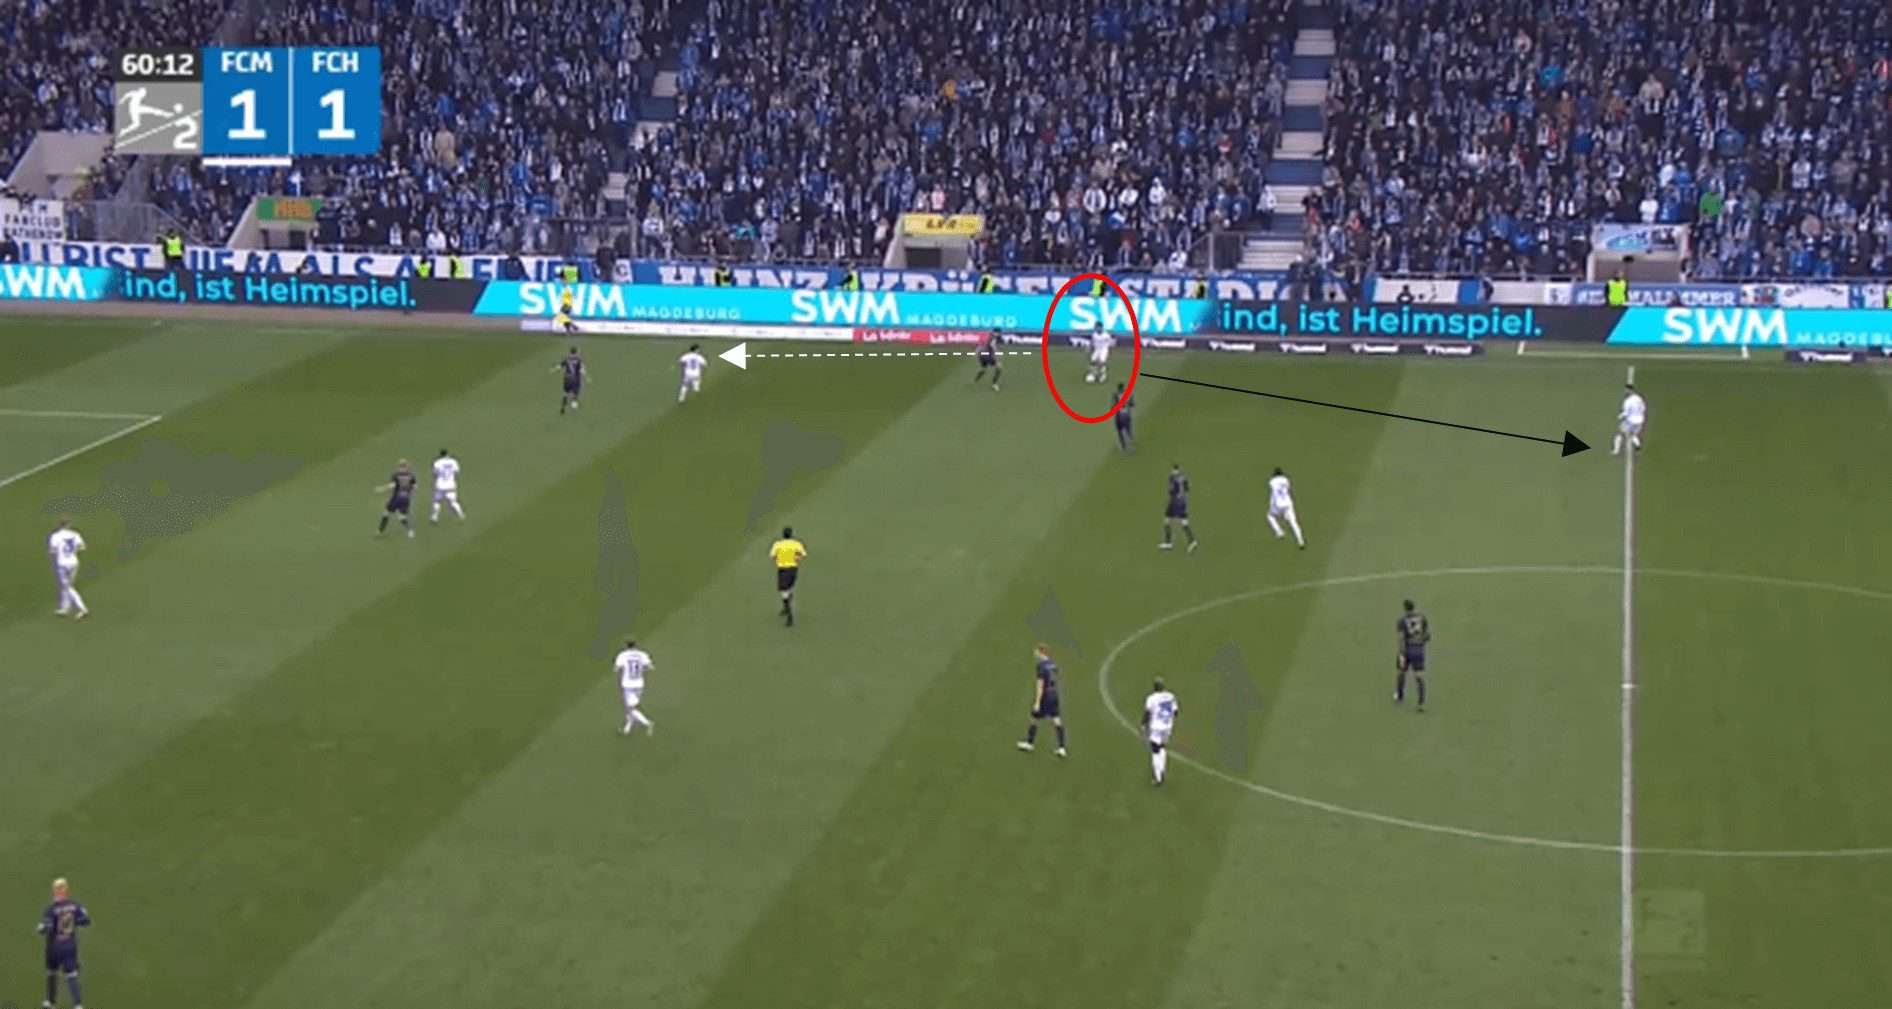
In this case, there is a perfect opportunity to play along the channel either through a pass or a take-on, but instead, Magdeburg slows the attack down and retreats backwards to the defender.
If Magdeburg could improve their positioning in the final third and decision-making, given the previously mentioned statistics, they appear to have the potential to dispatch efforts.
This will prove key if they are to advance up the table.
Conclusion
In this tactical theory piece, we have identified how possession doesn’t always lead to success, whether that be during a single match or across the course of a season.
We have shown how some possession-based teams have not been able to break down a low block; poor defensive discipline can be costly, no matter how much of the ball a team can retain.
Furthermore, we have highlighted that teams need to be more willing runners in their off-the-ball movement in order to aid in advancing play from defence to attack.
A team can have all the possession in the world, but if they aren’t productive with it, then it counts for nothing.
Equally, sides and individuals need to focus when not in possession.
It seems that possession only part tells the tales of football’s narratives.



Comments