Do big clubs buy titles in the transfer market?
Does the club with the highest wage bill win the league?
Is there any hope for small to mid-sized clubs?
With talks of a European Super League returning to the table, one of the primary motivators, after cold-hard cash, is the appeal of pitting Europe’s elite clubs against each other on a regular basis.
“Who wants to see Real Madrid vs Eibar or Liverpool vs Burnley” the backers say.
I do.
Give me Atalanta on a tiny budget against Juventus. Let’s see Sevilla and Villarreal build squads that are competitive in Spain and Europe. Preserve the Leicester City dream and Wolves fascinating approach to squad construction. Give us Ajax, Porto and Lyon making deep UEFA Champions League runs against the wealthiest sides in the continent. Save the outliers!
Football’s greatest stories surround the unforeseen rise of overachieving clubs. Not just football, but all sports really. However, if the teams outside of Europe’s top 10 financial powerhouses are going to preserve the domestic leagues, there is a need to consistently contest for titles and usurp power from the typical winners.
To aid this mission, this data analysis takes a looks at the overachieving teams in the global game. With financial statistics from Global Sports Salaries and Transfermarkt, as well as performance data from Wyscout, the aims of this analysis are to determine which financial indicators best predict club success, identify overachieving clubs and expound on existing models of overachievement.
Performance and financial data from the top five UEFA leagues are used in this analysis and the data sourced ranges from the 2013-14 season to 2019-20 campaign. Dates listed next to each team represents the ending year of the campaign, so “Wolves 2019” corresponds to the Wolves 2018-19 team. Each piece in the data analysis uses uniform measures from across the top five leagues, ensuring the integrity of the data.
Team salary
Our first task is to identify if there is a meaningful correlation between salary and season outcome. This seems like the natural indicator of predicting table rank and identifying overachieving teams. From a purely logical standpoint, top players earn top salaries that are continuously adjusted to the current market. If Player A is deemed underpaid one year, the likelihood of a new contract that better reflects his production and significance in the squad is easily produced.
That brings us to the first graph, plotting competition and salary rank to gauge financial stoutness on a club’s success. Grouping the clubs into four clusters, the colouration and quartiles give a rather clear indication of which teams hit the expected mark, which underachieved and our class of overachievers.
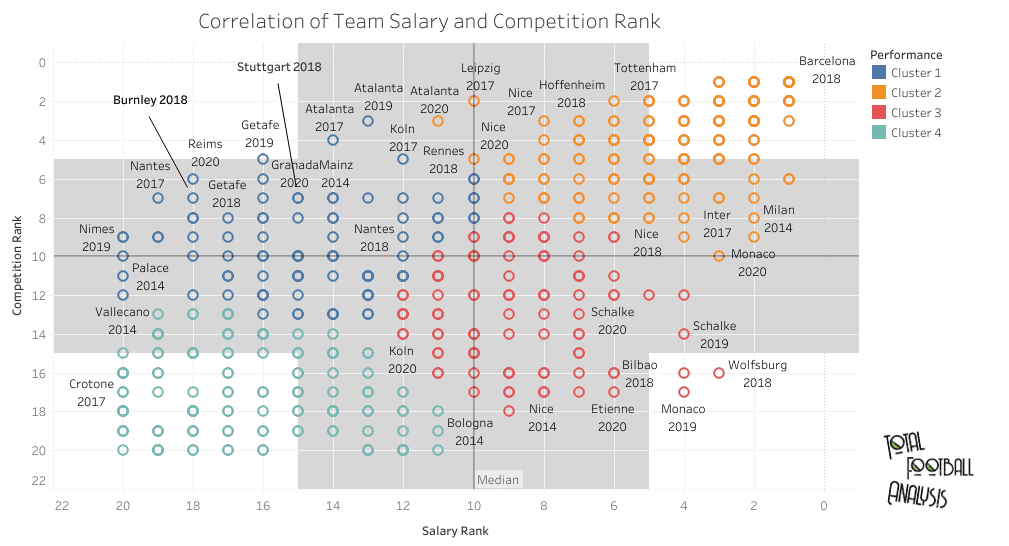
On the top right, you have all the usual suspects. That’s where we find the Real Madrids, Barcelonas, Juventuses, Bayern Munichs, PSGs and Manchester Cities of the top five leagues. Greater salary immediately seems to point to a greater season outcome.
Over in the top left quartile, we get a sense of which teams have over-performed relative to their spending power. Atalanta and Getafe are prominent fixtures on the list, as is Nantes. Interestingly, RB Leipzig’s inaugural Bundesliga season saw them rate 10th in salary in an 18 team league, but finish 2nd in the standings.
Next is a graph of expected points and the difference in salary and table rank, taken from the 2016/17 through 2019/20 seasons. With salary and table rank +/-, we’re putting the above graph into one statistic, which lets us put that mark against another data point, such as xPoints.
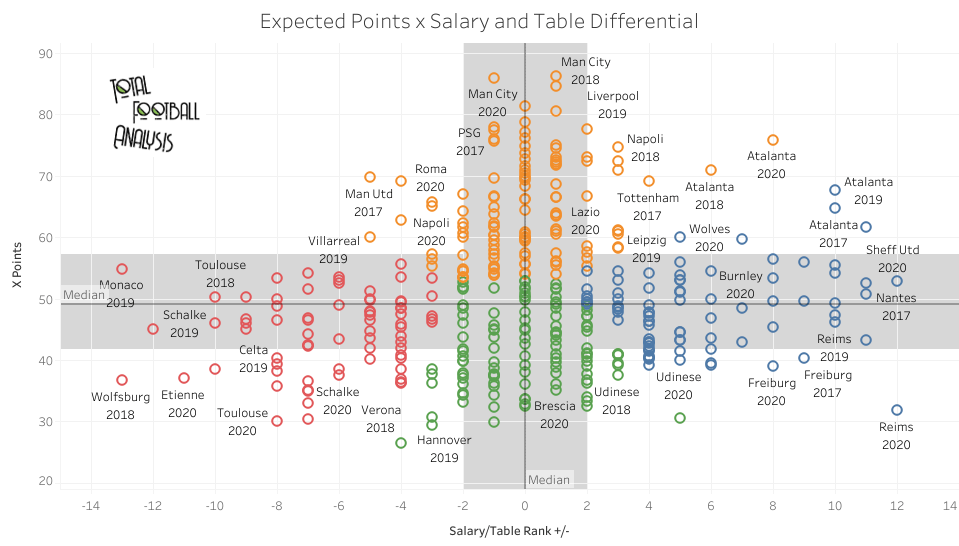
Again using clusters, we find that most teams hit a table rank that coincides with their wages, give or take two spots. The further to the left, the greater the underachievement. At the other end of the scale, we find the greater overachievement. Teams in the top right quadrant have both exceeded actual and expected points values, making them the stars of this analysis. One important note is the early termination of the 2019/20 French league, bringing down the Ligue 1 expected point totals for the season. That said, we can still see that a club like Reims wildly outperformed expectations given their salary rank and low xPoints total, even in a shortened 2019/20 campaign.
Moving from relative to absolute spending, we turn now to the relationship of average player salary to xPoints. La Liga’s giants have far outspent on salaries in recent years, though Juventus, PSG, Bayern and the Manchester clubs are closing the gap.
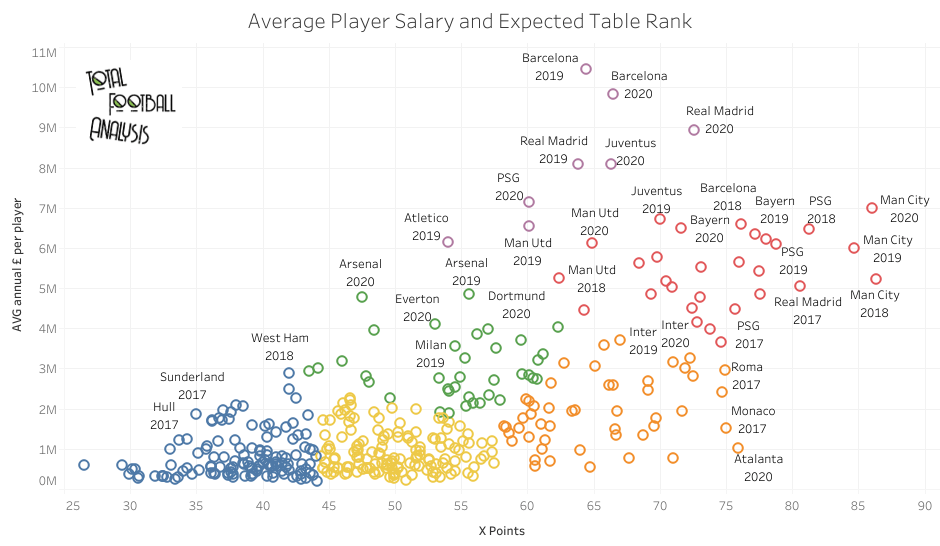
Red and purple circles give a nice indication of the performance from Europe’s elite, with red showing better performance. For the most part, green and blue are more or less expected finishes while yellow and orange indicate overperformance relative to wages.
By now, it’s clear that there’s at least a strong correlation between wages and table rank. It’s that group of oranges that are our focus. We want to hone in on those clubs and narrow our list for further study.
Narrowing our margins, filtering for top 10 finishes in domestic play and 10th+ spending in each team’s respective league. This is our “Overachiever Quadrant”, with colours representing league table rank.
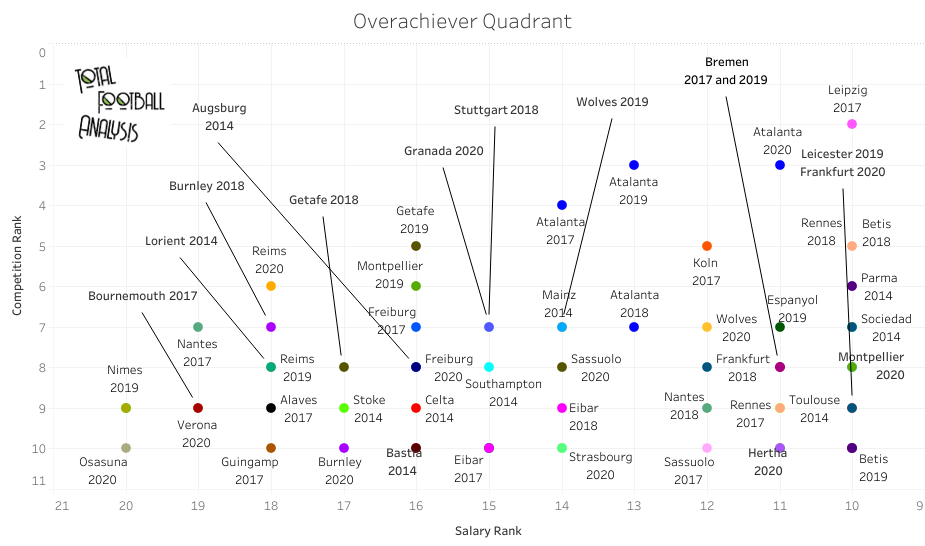
Atalanta, Getafe, Wolves, Köln, and RB Leipzig are some of the more prominent sides. You could make the case that those first three teams over the greatest insight into beating the odds because of their consecutive years of punching above their weight. When clubs have a successful season, it’s common for wealthier teams to raid their rosters. To reach this quadrant in consecutive years is an incredible feat, one that leaves clues of a superbly run organization.
Finally, paring the list even further, we find the best individual seasons of overperformance relative to wages. The graph below shows the best of the best. You’ll also see a percentage attached to each listing. That’s the club’s wage bill relative to their league’s top spender.
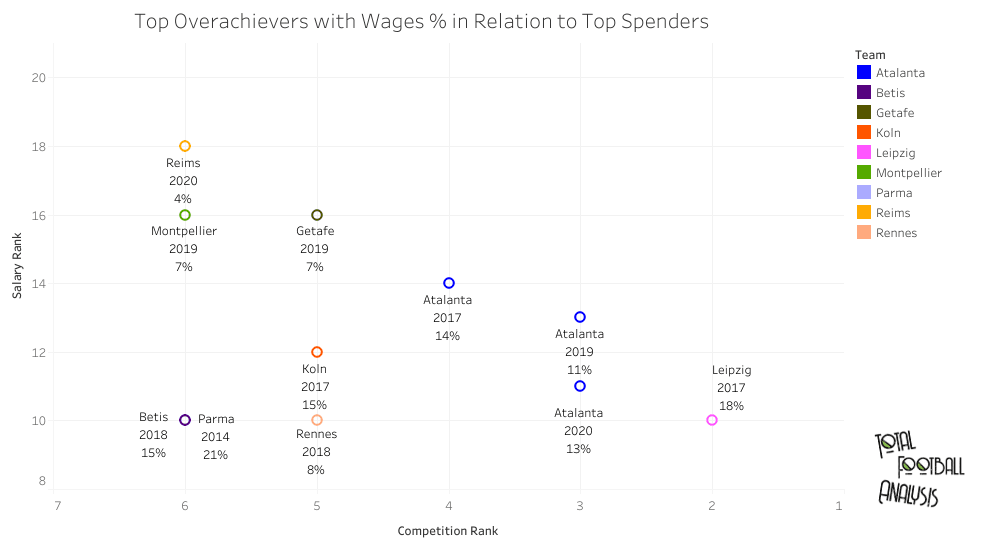
Incredibly, the top percentage in the group is Parma’s 21% mark relative to Juventus’ spending in 2013/14. Even in the 2016/17 season, Roma, Serie A’s 2nd biggest spender, had a wage bill that was 74.32% of Juventus’. At the end of the 2019/20 season, Roma still had the second-highest wage bill, but their spending percentage relative to Juventus dropped to 44.45%.
Taking four of our overperformers (Atalanta, Getafe, Leipzig, and Wolves), we can now directly compare their performance from recent top-flight seasons. For Getafe and Wolves, note that each team returned to the top flight later than Atalanta and RB Leipzig.
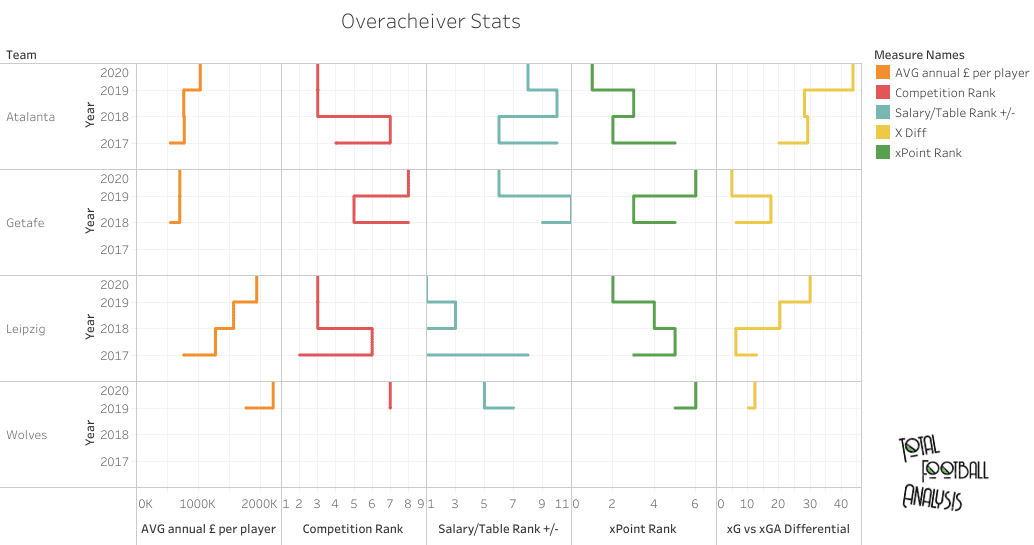
Our chart measures average annual £ per player (salary), competition rank, positive difference in table over salary rank, xPoints rank and xG/xGA differential. Atalanta offers the most impressive set of statistics across the board. Not only do they routinely outperform their wage bill, but they have been dominant in doing so, consistently rating among the top four Serie A teams in actual and expected stat categories. Their expected goal differential is a strong indicator of their extraordinary performances over the past two seasons.
We do want to examine the sustainable performance models at these four clubs, so there’s more to come on these teams in our final section. But, before heading there, it’s time to examine everyone’s favourite topic, the transfer market.
Transfer market spending
This analysis has already shown that there’s a strong correlation between the wage bill and table rank but how does transfer spending factor into the equation? Can a team buy their way to a trophy?
Given the spending habits and domestic trophies now sitting in Manchester City’s cabinet, you’re probably inclined to say, “yes, absolutely.” That claim has further backing by the transfer spending of Real Madrid and Barcelona since it seems a summer of transfers has ended with a La Liga title in May. Juventus, Bayern Munich and PSG follow up by hammering the final nails into the coffin, right?
Well, you’re right…and wrong, though not in the same regard. Not all transfer spending is created equal, as you’ll see momentarily.
To begin our inquest, the first image shows transfer balance (in millions of US dollars) and league table +/- from the previous season. If a team was newly promoted, I rated them 21st from the previous season, except in Germany where the new Bundesliga teams received a 19th place rating because it’s an 18 team league. Even though these numbers are a little wonky, I wanted to give the newly promoted clubs a seat at the table, especially since that 2016/17 RB Leipzig team, seen at the bottom right, was an important figure in the wages section.
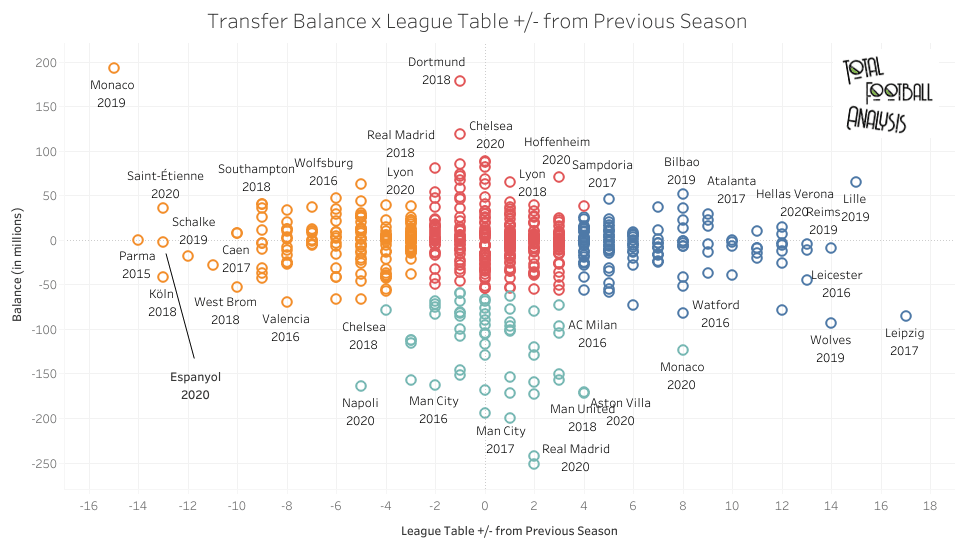
Glancing at the chart, the lower on the placement in the image, the more money that was spent in the transfer market. Monaco’s 2018/19 mark at the other end of the spectrum shows a huge gain in the transfer market due to Kylian Mbappe’s sale to PSG. Light blue marks out the big spenders, whereas the other three colours are more performance-based measures.
With regards to the left and right extremities, further to the right shows improvement in the table from the previous season. RB Leipzig finishing 17 spots better represents them jumping from newly promoted to 2nd place in a single season, a remarkable feat. To accomplish that end, they spent $85.20m while not recouping any money in player sales.
Leicester City’s 2015/16 title win is another standout. Yes, they did spend, but six EPL teams had a lower balance than Leicester’s -$44.77m, and that doesn’t include Liverpool, Arsenal, Chelsea or Tottenham. The -$93.45m balance of the 2018/19 Wolves team in their return to the EPL is a better indicator of how well-spent transfer money can help a team.
Next, the image below plots balance and competition rank, again using colour clusters to provide additional clarity in the visual. You’ll see most teams fall within a range of a $50m to -$50. A common trend is a year of spending followed by a year of selling. The other thing to note is the general balance range. Purple is generally a tight cluster, whereas the blue and green side of the scale on the right is greatly extended.
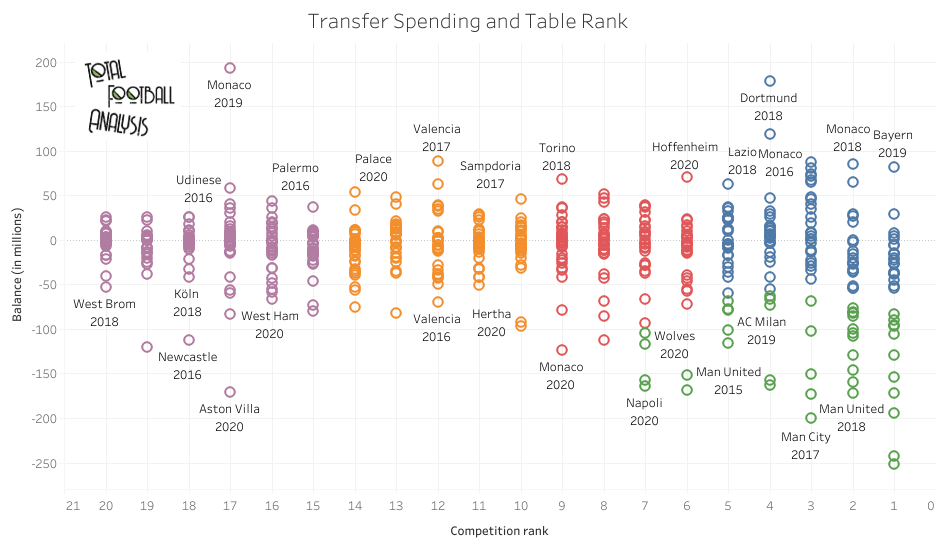
If anything, the table mutes the significance of transfer spending. Of the 33 occasions where a team has a balance of -$100m, they only won the league seven times (21%). On average, teams with a transfer balance in excess of $100m improved their spot in the league table by 1.7 places in the following season. It’s not until that balance reaches -$170 that table improvement even reaches a two-point average improvement. So, spending big only makes a difference if the club was a title contender before spending money.
So, can a club “buy the league”? In the EPL and La Liga, you can certainly make the case that the powerhouse that spends in the transfer market is the favourite. Annual top five finishers, as seen in the image below, tend to use the transfer market to fill gaps in the existing core rather than cleaning house and rebuilding. That stability sustains their status.
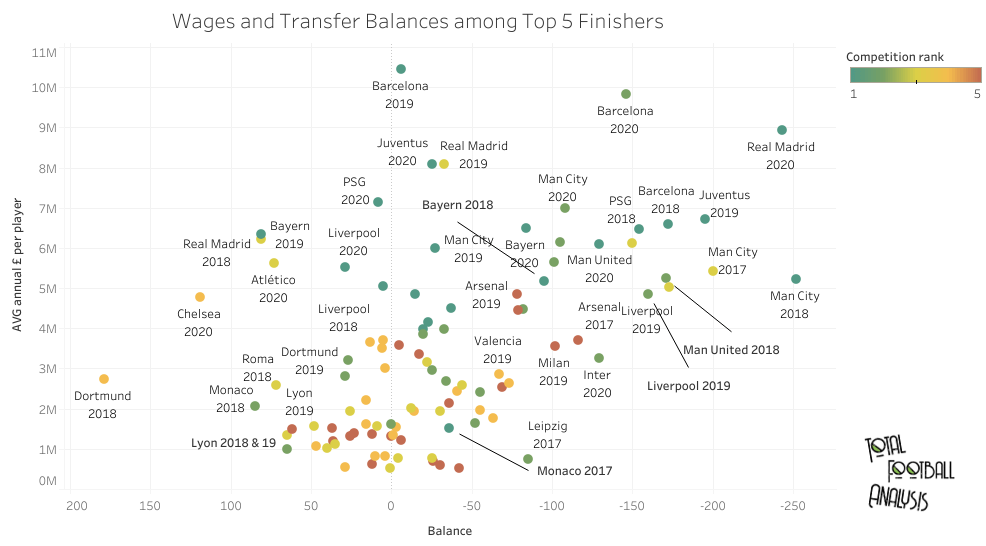
Transfer spending is certainly important, but, as the above image shows, salary is more important. Find a league winner, then look for the teams with the highest salary and transfer spending in that season. With just a few exceptions, you’ll find that the league winners had a higher salary, not necessarily a high transfer spending spree.
Additionally, there is something to be said for squad stability. Moving or bringing in too players often negatively impacts performance. That’s what the image below suggests. Analysing the top five finishers in each league, clubs are most likely to improve their table rank with minimal, but high-quality transfers. Even for clubs with lower wages, squad stability, possibly even selling a few players, can lead to significant improvements.
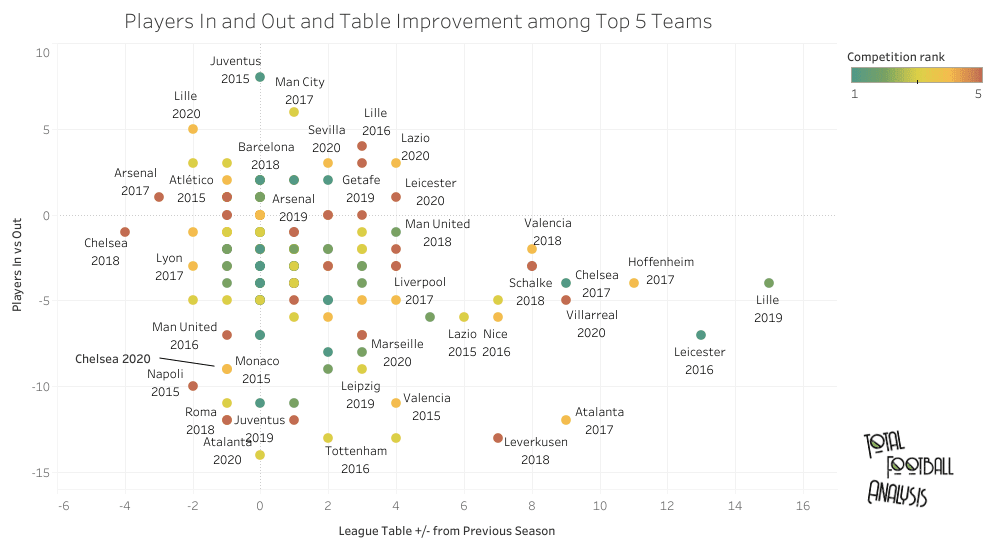
So the key isn’t to spend, it’s to spend well. AC Milan’s spending sprees over the past few years show that you can’t “buy trophies” if the existing core is far behind the other contenders.
With a better idea of the link between transfer spending and status in the table, let’s return to our top performers from the wages section to see how they spent their money. The graph below shows both transfer spending and players in and out +/-. Atalanta is coloured in blue and has a full range from 2015 to 2020 since they were so spectacular during that time frame. All other clubs are orange.
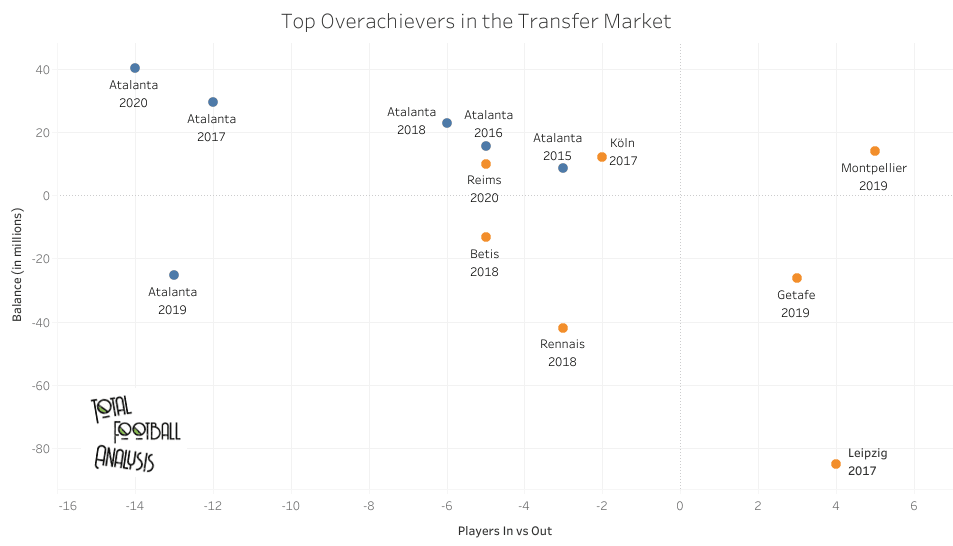
Remarkably, Atalanta only had a negative transfer balance in one of those six seasons, which includes three top-four finishes and a UEFA Champions League quarterfinal appearance. You’ll notice they have a high “players in and out” rating, skewed towards departures. That’s by design and it’s a recruitment philosophy for the next section.
Recruitment philosophies
This is the pivoting point in the analysis. Having analysed clubs wages and transfer spending, it’s time to investigate what overachieving looks like in recruitment and styles of play. We’ll assess the former first.
Squad stability was mentioned earlier, but the graph below offers further insight. Plotting players in and out by improvement or decline in table rank from the previous season, we come across some interesting findings.
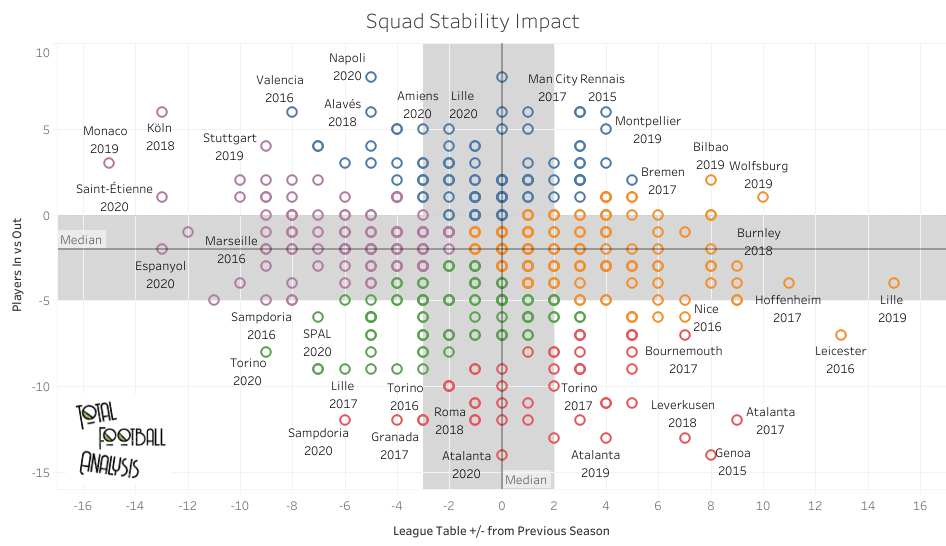
Excluding the grey region of the chart, the top left quadrant, which identifies clubs that are high on arrivals and seeing the greatest drop in the table, is the most populate section, featuring 22 teams (35%). The next most populated quadrant is the lower right section with 19 teams (28%). Fascinatingly, clubs that added more players than they sold were 64% more likely to see a decline in league table rank, whereas teams that had a net loss of five players or more were 63% more likely to climb the table.
Atalanta’s solution – Sell youth to fund core
We’ve already seen that Atalanta is one of the teams that sells each season. There highly respected youth academy has virtually funded the salaries of the first team players. They’re quick to loan youngsters or give them first-team minutes in Bergamo. Looking at the player demographics map below, the core of the squad is Italian.
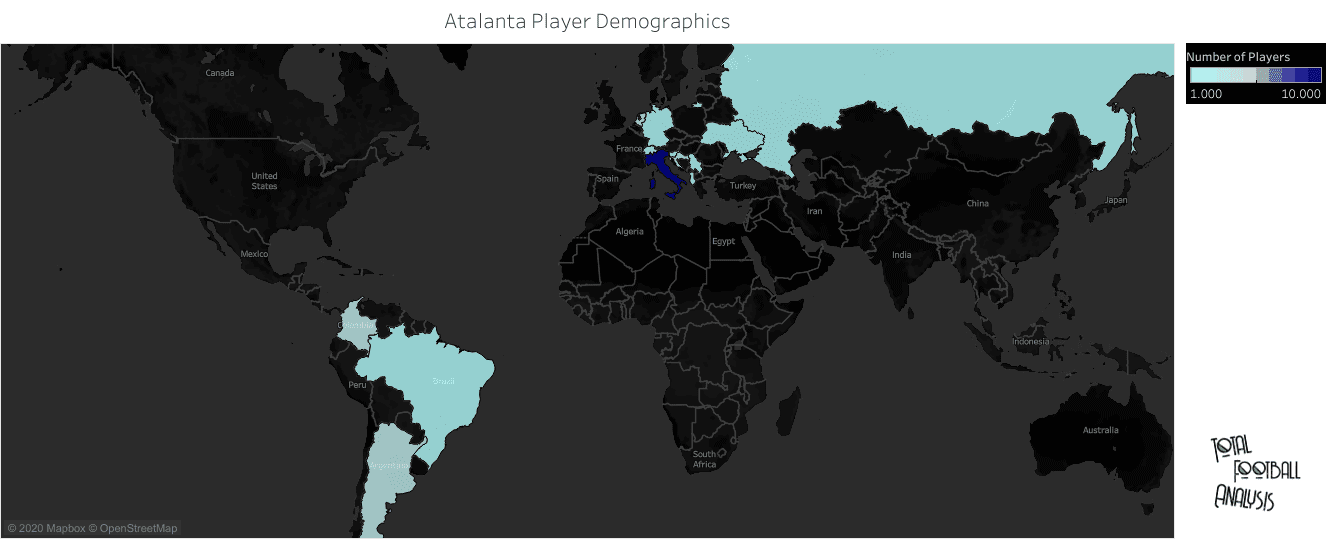
This is where Atalanta’s genius comes to the forefront. Even though the squad has a large Italian contingent, the only Azzurris receiving significant minutes are the goalkeeper, Pierluigi Gollini, and Mattia Caldara, who has been in and out of the lineup the past two seasons due to injury.
When you assess the core of the team, they’ve done a brilliant job recruiting players who fit into the club’s playing philosophy, then sold the youth players to keep the core group together. Those millions in sales essentially become millions in salary, keeping players who would otherwise have left for larger paychecks elsewhere.
RB Leipzig’s solution – Use large scouting network to find and develop top global talent
Next up is RB Leipzig. The crown jewel of the Red Bull Corporation’s football network, Leipzig is one of seven Red Bull owned teams spanning four continents. Nearly a third of the squad is German, with 10 in total. Spain and France are well represented with four players apiece, but, otherwise, you see the power of the Red Bull scouting network. The treemap below shows nationality, the average age of the players from that country and the number of players of that specific nationality.
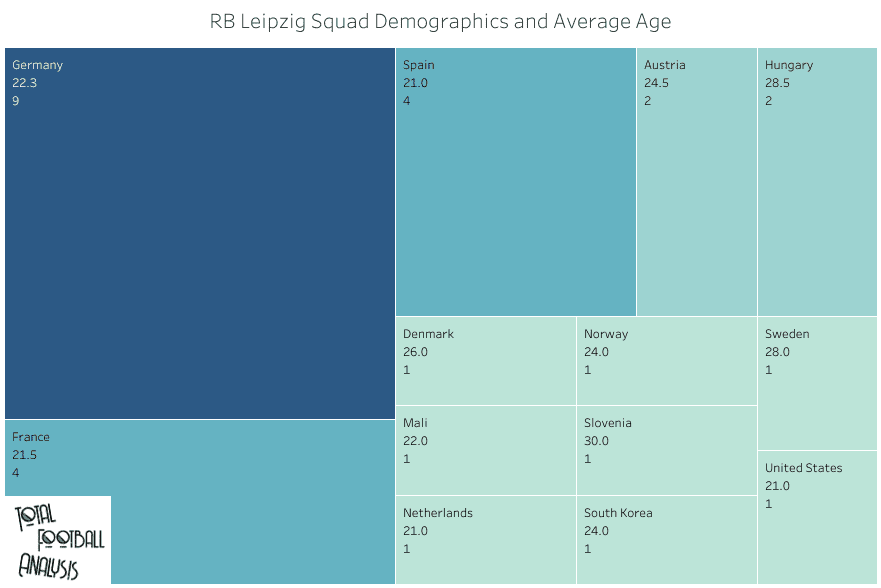
Able to identify top young talents from across the globe, Red Bull can bring the player into the system before moving the top players to Leipzig. Their scouting network allows for extremely detailed reports across any nation where there’s a Red Bull team.
Much like the City Football Group, there are major advantages to operating clubs across the globe. If I was a betting man, this is the single most important trend I’d predict in the coming decades. The benefits are far too lucrative.
Wolves’ solution: Power agent and strong culture-based recruitment
Wolves are a fascinating club. Referred to by many as the Portuguese Wolves, with the red and green kit to boot, nine Wolves players and the manager, Nuno Espírito Santo hail from the Iberian nation. If you’re not up to date on the timeline, Fosun International completed a £45m takeover of the club in July 2016. According to a Guardian analysis of Wolves, Guo Guangchang, chairman of the Fosun corporation, is an investor in Gestifute and close friend of the company’s president, Jorge Mendes. The Wolves website has also acknowledged working with Mendes on a consultation basis. Seven players and Nuno are represented by Mendes.
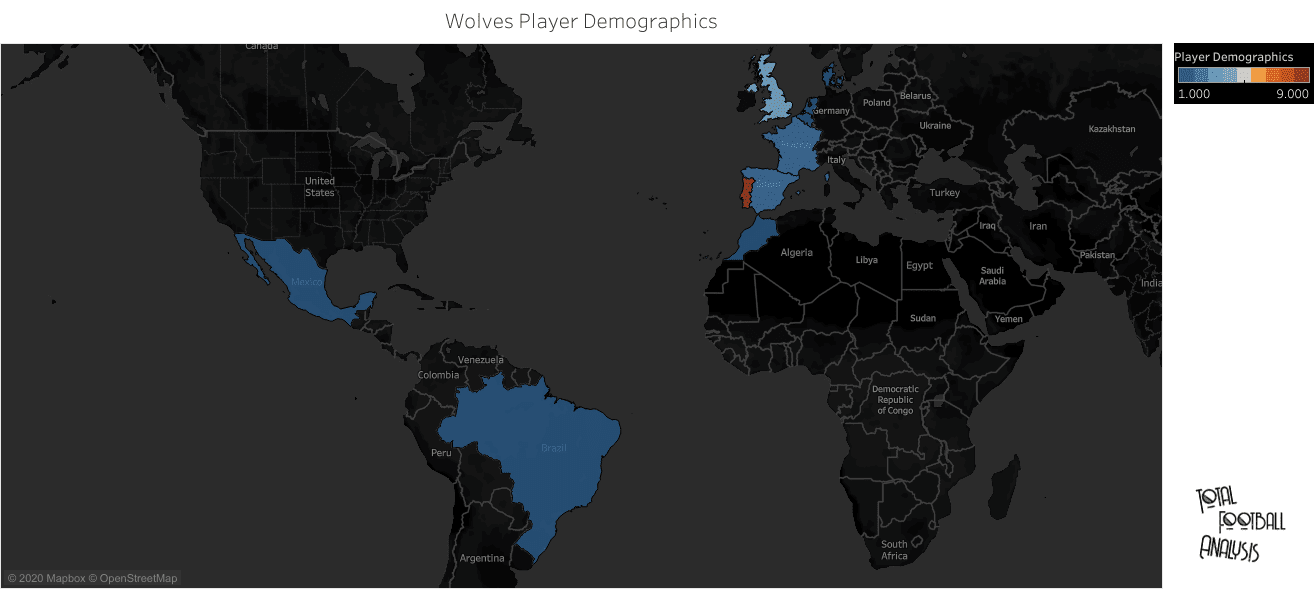
Looking at the player demographic map, the Portuguese influence is clear. After the nine players from Portugal, there are four Englishmen, then France and Spain have two apiece. Those are the only four nations with multiple representatives.
Another factor for their success is the cultural commonality among the squad. Of the players on
the 23 man roster, 11 either grew up or experienced football with one of the top four clubs in Portugal. Porto is especially represented with six players. Add in players like Adama Traoré, who fits the mould of a classic Portuguese winger, and the largely Northern European defenders and you’ve got a clear identity with support in crucial areas of the pitch. With global recruitment and transfers across nations commonplace these days, Wolves have effectively reduced the guesswork with by recruiting a large portion of players from a single footballing culture. In effect, they have a cultural core with support from complimentary footballing cultures.
Extreme Playing Styles
Early in this analysis, we highlighted four teams, Atalanta, RB Leipzig, Wolves and Getafe. Three of the four were profiled in the recruitment section, so, at long last, we turn the spotlight on Getafe.
They’re the stars of this section. With little money to spare in the transfer market and very low player wages, they’ve made their mark in other places (mostly the opponent’s shins). When competing in the top division on a shoestring budget, status quo tactics produce status quo results. If a club rates among the bottom five in salary, commonplace tactics will see them in a relegation battle. Great recruitment helps, but if your approach mirrors that of the other minnows, survival will largely depend on luck and team culture.
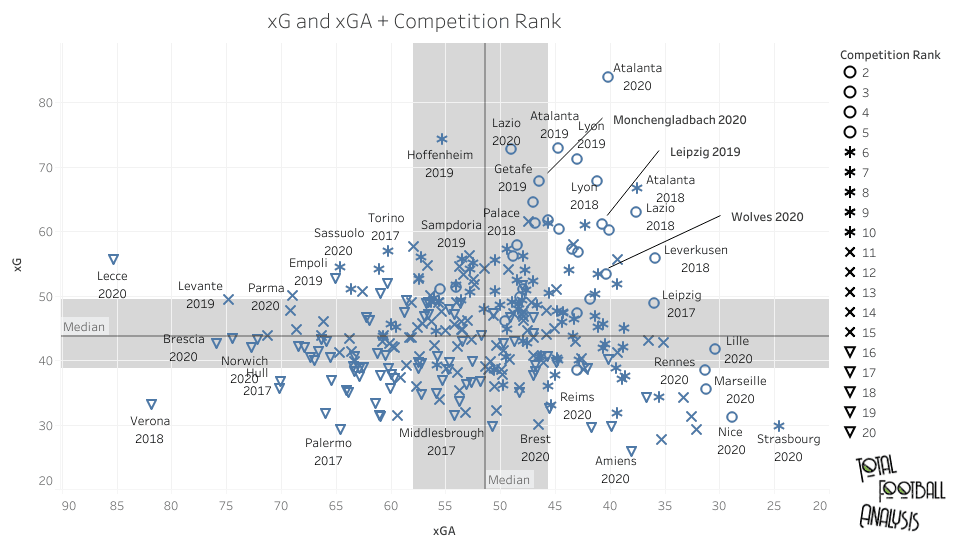
Before venturing into Getafe’s solution, we want to search for teams with more extreme playing styles. To identify them, we will use xG and xGA to find the teams that really excel in attacking and defensive qualities. Further, since we’re ultimately not looking for an overachiever in the ranks of Europe’s elites, the following plots exclude the outliers at the top end of the wage bill and sets each league’s standard by the top spender relative to the remainder of the league. For example, Bayern is filtered out and while Dortmund, the team with the second-highest wage bill, is used as the standard. In the EPL, the top six are generally excluded because of the extreme margin from the pack. Finally, wages are filtered to teams spending 75% or less relative to the Dortmunds of their league.
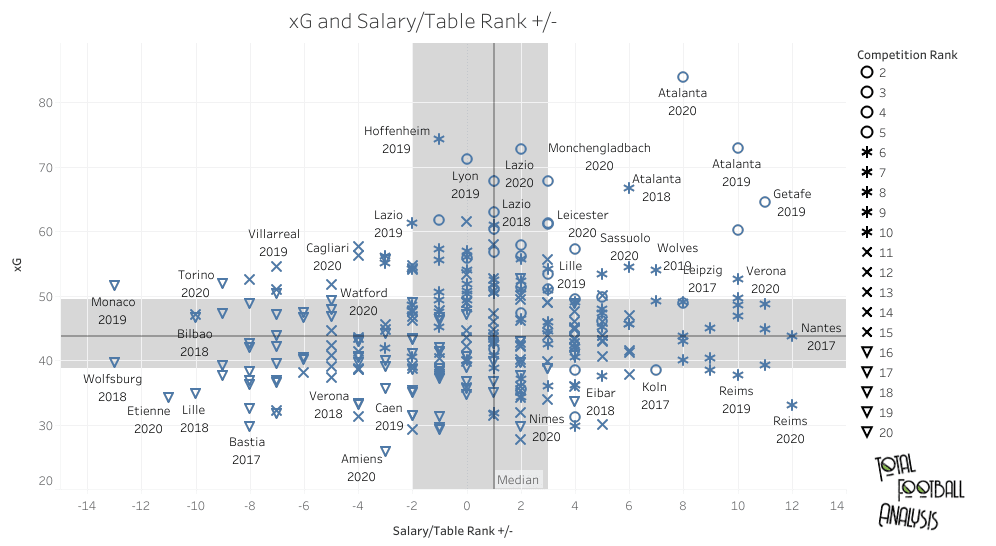
Right away, the xG by difference in salary versus table stat produces some familiar names. Atalanta, Getafe, 2017 RB Leipzig and Wolves are all in the top right quartile. With 360 entries, placement in that quartile is significant. Further, with only a few exceptions, the teams in that quartile finished in the top half of the table. In contrast, teams in the bottom left quartile, the worst producers, mostly fit into the bottom half of the table, many in the relegation zone.
But what about the dominant defensive teams? As the table below illustrates, the outcome is similar. Teams in the top right quartile tend to finish in the top half, while teams in the bottom left are forced to fight for their lives.
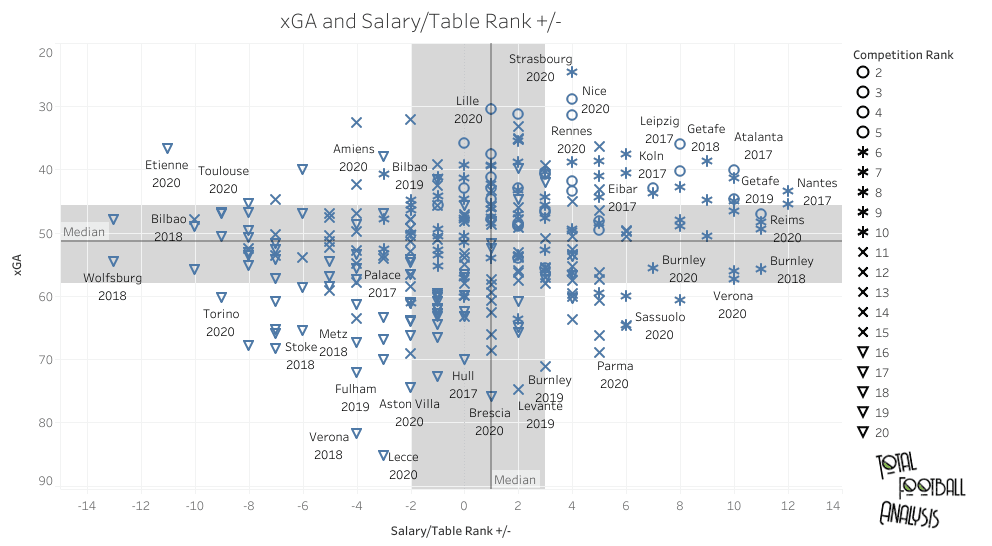
Putting xG and xGA together, we find the really exceptional low-wage teams in the top right quartile. In most cases, those teams finished in the top five of their respective leagues.
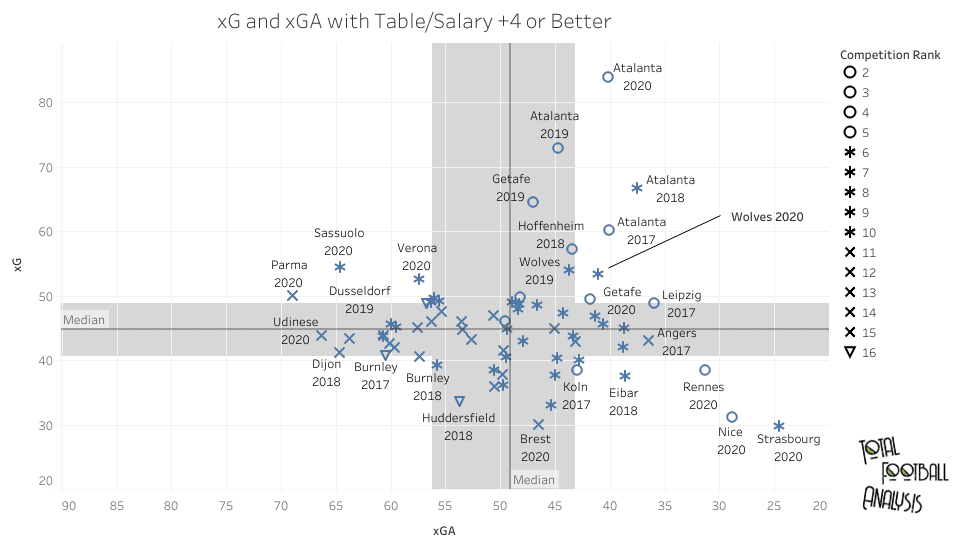
Clearing some of the clutter, filtering the list data set to only include teams with a table rank at least four places higher than their salary rank, we have more concrete examples of overachievement.
Getafe’s solution – Narrow, high-intensity defending with high-risk high-reward attacking
With the exception of the 2018/19 season, Getafe didn’t break away from the pack in the xG statistic. You could argue that the goals were just the icing on the cake.
2019/20 offers a better look at Getafe’s extreme tactics: fewest shots against (261), 1st in fouls committed (704), 1st in yellow cards (133) and the worst pass completion percentage in La Liga (69.6%).
In most xG graphs, Getafe typically slides into the muddled mess at the heart of the chart, but their defensive numbers rate among the best. If you haven’t watched José Bordalás’ side play, do so before he moves to a bigger club. His side is incredibly narrow, both in attack and defence.
Counterpressing is key, just as tactical fouls are. If the first defender is about to lose a 1v1 battle, he’s going to bring the attacker down at all costs. Instead of running at the backline, opponents are forced to watch Getafe get numbers behind the ball before restarting their attack.
There’s nothing beautiful about Getafe’s playing style, but their old-school playing style does offer a refreshing mix in the world of fast-paced, finesse football. Sure, Ajax fans might chant about how awful the playing style looks, but Getafe doesn’t care about style points.
Conclusion
In the end, there are a number of ways that teams can overcome financial limitations, but only if they’re willing to employ an innovative player recruitment approach or embrace an uncommon style of play. Having the daring of a side like Atalanta, innovating on and off the pitch, is not a sustainable business model, but it allows for small budget clubs to put pressure on their wealthier neighbours.
The elites will always have the salary and transfer spending to fill the cracks. If a Super League does come to fruition, the elite clubs will benefit immensely, but that could very well spell disaster for the domestic leagues.
Boldness, innovation and action are the qualities that Atalanta, Getafe, Leipzig and Wolves practice. To break the cycle of dominance at the top of each top-five league, more of this is needed from the mid and lower-level financial class. Yes, staying up is the top priority for many, but the bigger prize awaits those who dare to claim it.




Comments