

With the Tokyo Summer Olympics 2020 scheduled for July, Great Britain will be participating along with 11 other teams. What makes it interesting is that we won’t only see the Lionesses but those from Scotland, Northern Ireland, and Wales will be in consideration for the 18 player squad. Taking a look at all four teams, there are a number of players across the four nations that could bring something to Great Britain’s women’s football team. Matt Dorman and I are exploring the different possibilities and choices Phil Neville has at his disposal using data. Through data analysis, we will examine and analyse the different players in each position to see which players should be picked as part of the 19-player squad. Each article will be split by position and eventually, we will try and deduce the possible starting eleven.
Team GB will come up against a whole host of opponents that will employ a number of different tactics to try and win. Coming up with a squad that can handle the different situations Neville and co. will come up against will be necessary and require more than just traditional visual-based performances to come up with the right mix. Their rivals Japan, France, Germany, and the Netherlands have world-class players in several positions where Team GB may lack.
Matt Dorman and I have applied a few parameters to keep the overall analysis consistent and fair. The 18-player squad will consist of: two goalkeepers, three full-backs, three central defenders, two holding midfielders, three attacking midfielders, three wide forwards or wingers, and two strikers. We will be assuming that Neville will utilise the 4-2-3-1 system he applies with the Lionesses, where the style of play revolves around quick interchanges of play with an emphasis on the wide areas for supply and service. Our squad picks have been based on two parameters:
– Players have played 450+ minutes this season
– Currently, plays in the top tier of their domestic leagues.
In the second article of this data scout report series, I will be focusing on Team GB’s options at centre-back and which three should be considered for the squad. We will first perform data analysis to compare and filter out three potential members from all four nations.
What kind of central defenders are we looking for?
Our initial starting point is to look for players that fall into the parameters we set above and fits into the style of play Neville would be looking for. Getting a mix of central defenders who are efficient passers, positionally aware, and physically powerful in 1 v 1 battles will be important because of the different types of opposition the team is likely to face.
Some matches will see Great Britain dominate possession and require more ball-playing centre-backs to aid in build-up and ball retention and physically strong defenders to compete in duels both ground and aerially. In other games, teams will dominate Team GB and Neville will need players who are quick and strong who can deal with target-men and poachers alike.
The United Kingdom possesses a number of defenders who fit the bill with some plying their trade across the border in the United States. Being exposed to different systems and players gives them experience in handling forwards who may not be present in Europe. The majority of the world champions reside in the NWSL, so playing against them can only improve their skillset.
What kind of data metrics are we using?
The following metric combinations will be used to explore the best options at Neville’s disposal. We are using metrics to find a mix of ball-players and defensive centre-backs all from the current season’s data. This includes the average number of forward passes and defensive duels and the average number of received passes and passes to final third. This is being used to determine the players’ ball-playing ability combined with their engagement in duels through their passing and defensive duels statistics.
From a defensive point of view, I will be looking at average interceptions, average aerial duels, and average defensive duels won and recoveries. These are being used to determine how well the players can defend in a variety of scenarios. With the data originating from Wyscout, their definition of ‘interceptions’ is “It’s used when the player is stopping the ball, intercepting it when the opponent is shooting, passing or crossing the ball. This is an event, which is happening more in the head of the player – (s)he sees the situation and what will happen before the action of the opposite player, his/her ability to “read” the game.”
From this definition, it’s easy to understand that we want to see the players’ positional awareness and intelligence in defending scenarios. Being able to cut out these actions before the opposition player executes their move becomes crucial.
The use of aerial duels will signify the players’ strength in the air. Not every team will dominate the ball and will bait Team GB into keeping more possession. In this case, the team will require defenders who are capable of stopping crosses and long balls against teams that will employ a direct style of play.
Finally, looking at average defensive duels won and recoveries will examine the players’ overall defensive ability. It is important to understand their defensive capacity to ensure Team GB can be tactically flexible and provide support in a defensive capacity as well as an offensive one. Now let’s dive deeper into the statistical comparison.
Average forward passes & average defensive duels
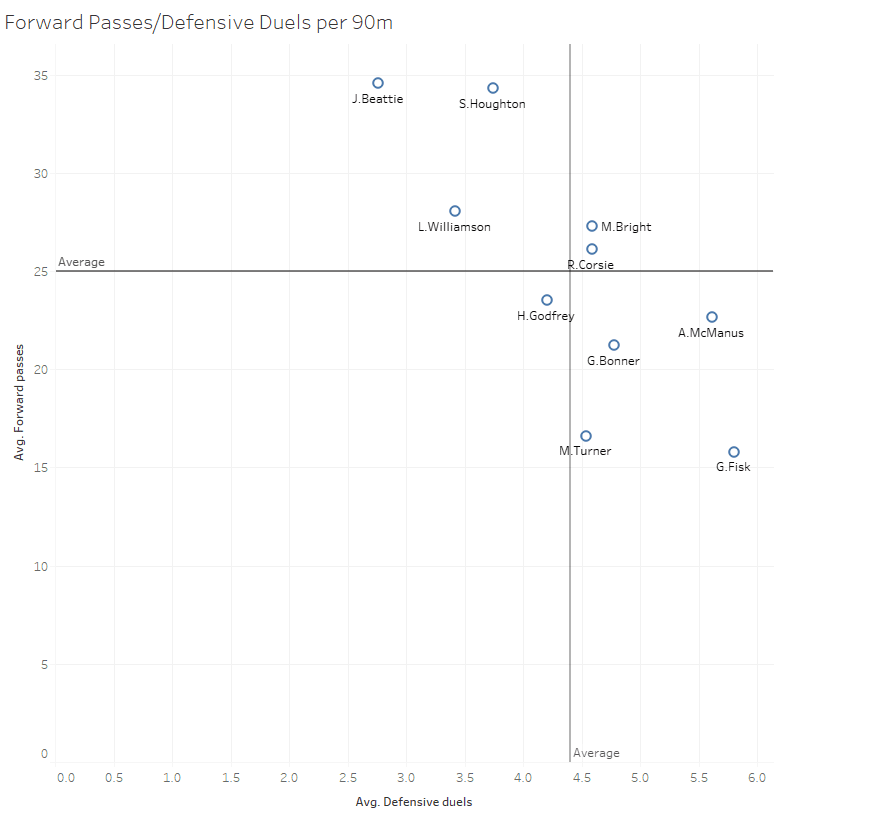
Our first point of comparison is the number of average forward passes and average defensive duels per 90 minutes. This comparison is to deduce how often these central defenders enter into 1 v 1 engagements and are able to release possession positively towards the more attacking players. We will also be able to find out the more aggressive centre-backs. Having a ‘stopper’ and ‘cover’ centre-back pairing gives Team GB a balance and ability to deal with different types of forwards.
From our initial observations, we can see the graph is split into four quadrants based on the average results. Players in the top left quadrant are above average forward passers but may engage in fewer duels per 90 minutes. Players in the bottom right quadrant engage in more duels than passes. Thus the best fit centre-back are the ones located in the top left quadrant. From here we can see there are two players that fall into this category – Millie Bright and Rachel Corsie.
The Chelsea Women and Utah Royals defenders stand out amongst their counterparts. Bright averages 4.5 defensive duels per 90 minutes along with 27.2 forward passes per 90 minutes. Corsie also averages 4.5 defensive duels per 90 minutes and the Royals defender averages 26.1 forward passes per 90 minutes. The two players are the only ones who are above average in both metrics compared to the other players. While Jen Beattie and Steph Houghton are excellent passers, and Abbie McManus and Grace Fisk are more aggressive centre-backs, it is Bright and Corsie who statistically deliver on both counts consistently.
Average received passes & average passes to final third
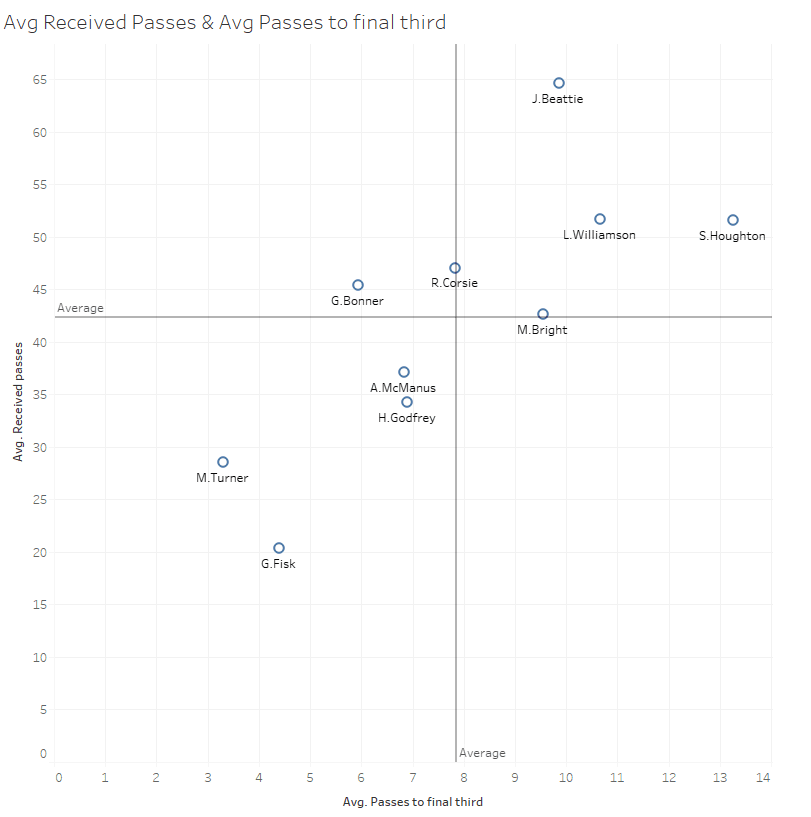
Another metric I’ve decided to compare is the average received passes and passes to the final third per 90 minutes. This will give us an indication at how central these defenders are in recycling, receiving and progressing play forward once they do. Neville likes his central defenders to play out from the back so having centre-backs who are effective passers will be necessary.
Looking at the graph above we can see we have players scattered across the four quadrants. Our main focus will be on the players situated in the top right square. They are ones who are average the highest in both categories. Leah Williamson, Houghton, and Beattie are the three players. Beattie averages 65 received passes and 9.8 forward passes per 90 minutes. Williamson averages 51.7 received passes and 10.6 forward passes per 90 minutes. Lastly, Houghton delivers an average of 51.5 received passes and 13.2 forward passes per 90 minutes. These three players represent the most value in terms of passing and recycling possession.
Average interceptions
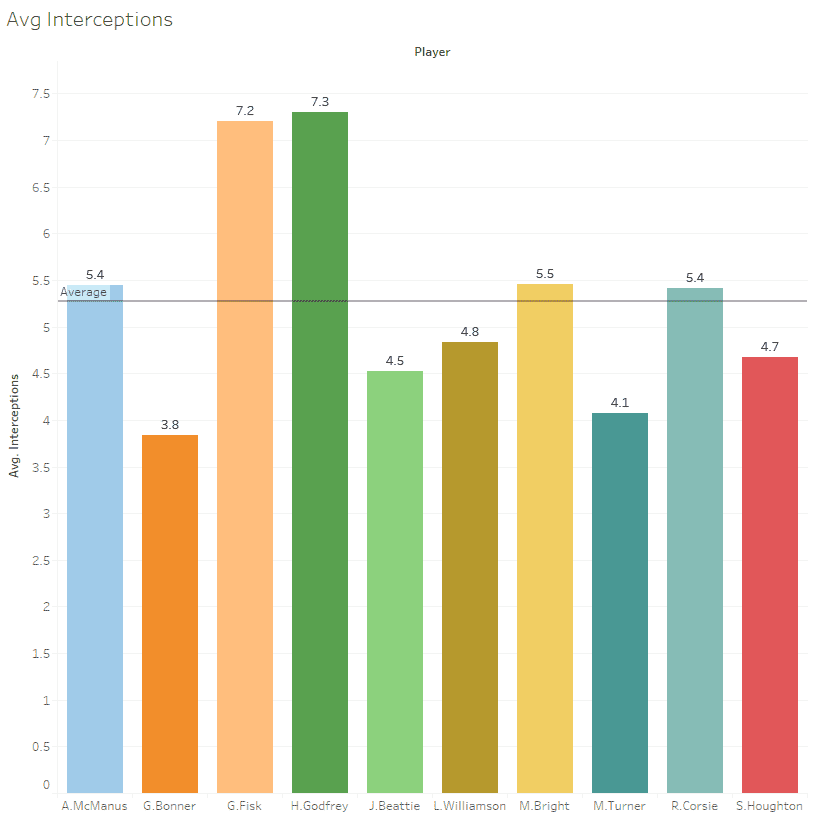
Next, we will look at the average interceptions these players have made over the course of the current season. As I’ve mentioned earlier, interceptions are classified as an event in which the player stops a pass, cross or shot by anticipating the move based on their reading of the game. So it’s important to look at these set of players and understand which players attempt the most interceptions per 90 minutes. Out of the nine players, three remain at the ‘average’ point while two others are above average. Bright, McManus, and Corsie have shown a tendency to put themselves in the opposition’s line of sight and stop their play. The three are quite aggressive by nature, especially Bright, who plays the ‘stopper’ role with Magdalena Eriksson playing the ‘cover’ role. All three players average close to 5.5 interceptions per 90 minutes.
The two outliers are Fisk and Hannah Godfrey of West Ham Women and Tottenham Hotspur Women. They both average over 7 interceptions per 90 minutes. This comes down to the way their teams play. Both West Ham and Spurs face more dominant sides thus it means the two players are likely to face many more attacks and shots from the opposition. This could help Team GB by having a player in their ranks who are used to constant pressure.
Average aerial duels
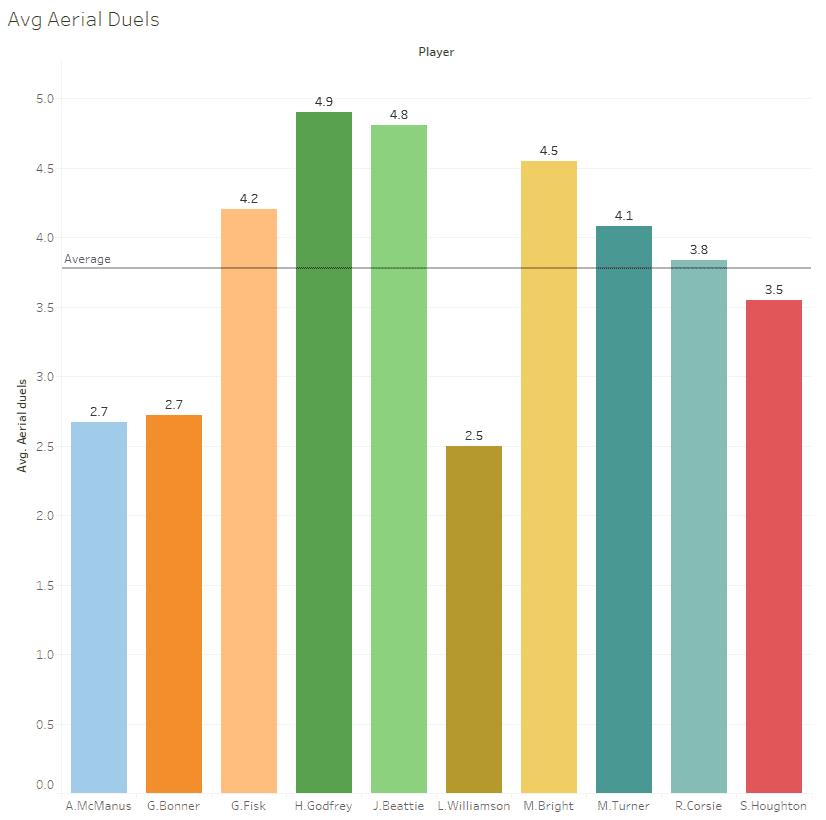
Another important metric to evaluate is the number of aerial duels per 90 minutes. Why is this important? This tells us how good the players are in the air and whether they can compete against physically strong strikers. Many teams will look to play ‘route 1’ football against Team GB, and having defenders who can deal with the aerial threats will be extremely useful. Out of our nine centre-backs, we have five who excel and rank above average. Fisk, Godfrey, Beattie, Corsie, Millie Turner, and Bright are the five players who stand out from the graph above. Fisk averages 4.2, Godfrey averages 4.9, Beattie averages 4.8, Bright 4.5, Turner 4.1, and Corsie 3.8 aerial duels per 90 minutes.
Average defensive duels won & average recoveries
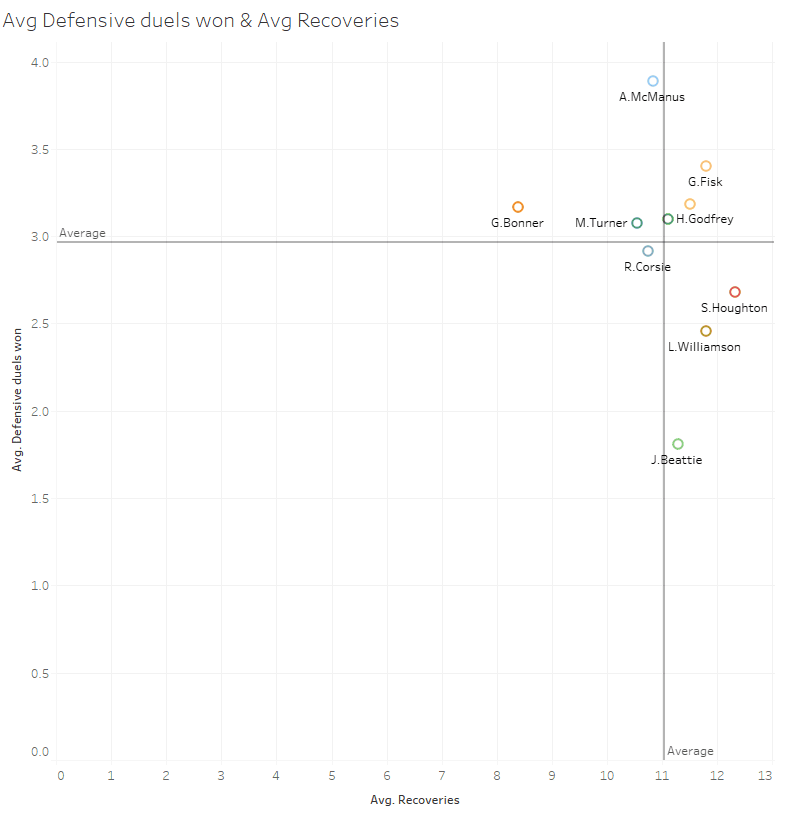
Lastly, we are going to be looking average defensive duels won and recoveries per 90 minutes. These metrics are being used to look at the defensive solidarity these defenders bring to the team. How well they perform in pure defensive statistics is a measure how much they engage in defending and keeping the opposition at bay. What is most prevalent is the players are plotted closer together. Though we are looking at the top right quadrant once again, the difference in figures is quite close.
For example, Abbie McManus averages 3.8 defensive duels won and 10.8 recoveries per 90 minutes. The average number of recoveries is 11.1 so the difference is negligible. Other players such as Turner and Corsie are in and around the average line. Fisk averages 3.4 defensive duels won and 11.8 recoveries per 90 minutes. Bright averages 3.1 defensive duels won and 11.5 recoveries per 90 minutes. Godfrey is on the edge but we’ll include her in this quadrant. The Spurs defender averages 3.1 defensive duels won and 11.1 recoveries per 90 minutes.
Who makes the squad?
Now that we’ve analysed all the different metrics to find the three best central defenders, we have the results which might be surprising, with the two players that were in the top two of multiple metrics being Godfrey and Fisk. The final defender spot is a tie between Bright and Beattie. The choice will come down to Neville’s preference of player and which he prefers. Both Beattie and Bright are aggressive centre-backs who both play for top teams in the FAWSL – Chelsea Women and Arsenal Women. But perhaps there is another way to find out which defender should be part of the squad. To complete the data analysis I will compare the current crop of players with a centre-back from the Women’s World Cup team of the tournament. I have chosen Abby Dahlkemper because the United States Women’s National Team won the World Cup, making her truly world-class – not to mention her win in the 2019 NWSL with North Carolina Courage.
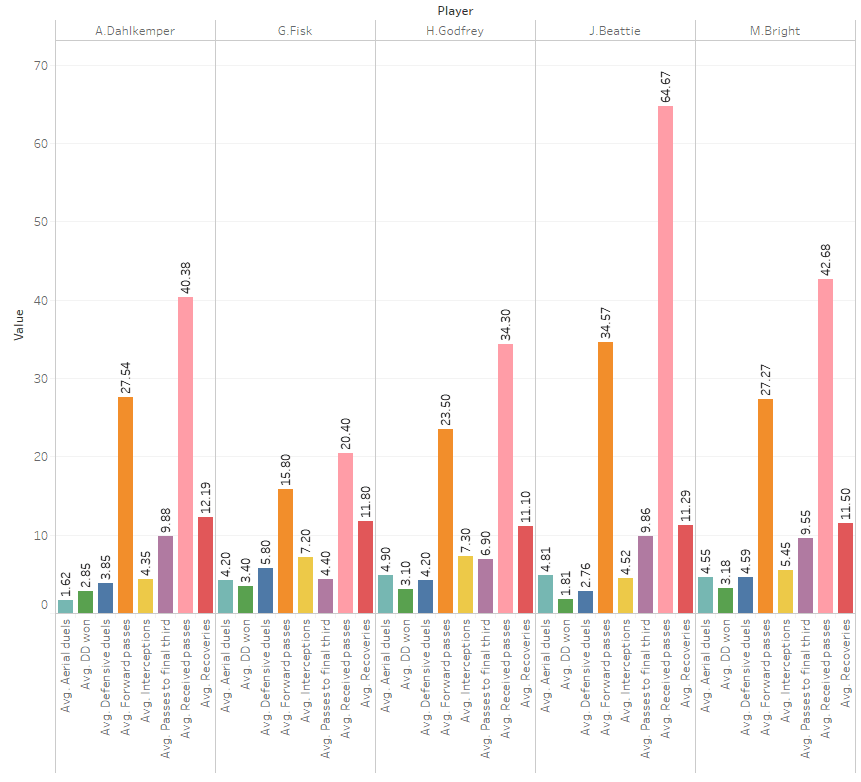
I’ve drawn up a quick comparison between Dahlkemper and the listed centre-backs, and what’s interesting to see is the metrics between them. Dahlkemper is quite clearly an adept ball-playing central defender and excels there but lacks the physical prowess. While it’s not the American’s strength, it is good to see how the other players stack up against her.
Both Bright and Beattie outshine Dahlkemper with their physical attributes. Beattie beats Dahlkemper on the ball too whereas Bright just edges the American defender. However, between the two British defenders, Bright is the slightly better physical defender. Based on the data it seems as though Neville would take Bright over Beattie for her mixture of physical and ball-playing attributes. However, the style of play at Arsenal closely matches the philosophy Neville envisions his team. It, in all honesty, could come down to form and preference.
What should be noted, however, are the players are being compared across different leagues (FAWSL & NWSL) and the styles of play are different, as are their personal skillsets. As a result, we’ve found different defenders who possess the skills needed and provide an alternative for every situation.


Comments