This data analysis will help us to understand why West Ham are having a great season thus far, sitting in fifth place in the Premier League table, above the likes of Tottenham, Liverpool and Arsenal.
To be able to determine why David Moyes’ team is enjoying a successful campaign we will compare West Ham to the other Premier League teams through data. West Ham’s players will be compared to the rest of the Premier League players as well. Player comparisons will only include players with a minimum of 600 minutes played this season, with all data coming from Wyscout.
Formations used and expected goals model
West Ham started the season playing in a 5-4-1 formation and in 11 matches they managed to collect 17 points with five wins and two draws. The image below shows their most-used lineup in those 11 matches.
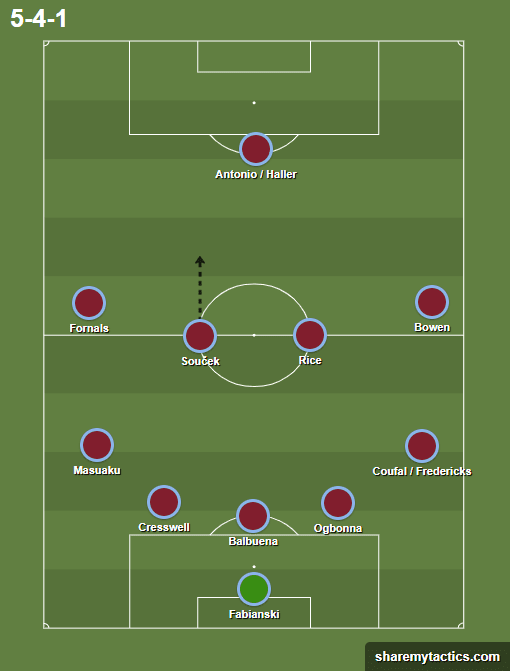
This is the third season in a row for Łukasz Fabiański as the first-choice goalkeeper for the Hammers, while the trio in front of him was usually Fabián Balbuena, Angelo Ogbonna and Aaron Cresswell. Cresswell managed to show some impressive performances in an unfamiliar position on the left of a back three, and he has played a similar role to that of Cesar Azpilicueta in Antonio Conte’s tactics during Chelsea’s title-winning 2016/17 season. Moyes also wanted to use Arthur Masuaku who was in good form at left wing-back, and on the other side Ryan Fredericks started a few matches, but after an injury, Vladimir Coufal, who arrived from Slavia Prague in the summer, took his spot and never let it go. Two indispensable players in this team are Tomas Soucek and Declan Rice who have both played every minute so far in this Premier League campaign. Pablo Fornals and Jarrod Bowen were the wingers behind Michail Antonio and Sebastian Haller.
The turning point for West Ham’s season came when they were forced to change their shape to a 4-2-3-1 due to a serious knee injury to Masuaku. West Ham also brought Jesse Lingard in on loan from Manchester United in the January window, when Robert Snodgrass and Sebastien Haller left the London Stadium.
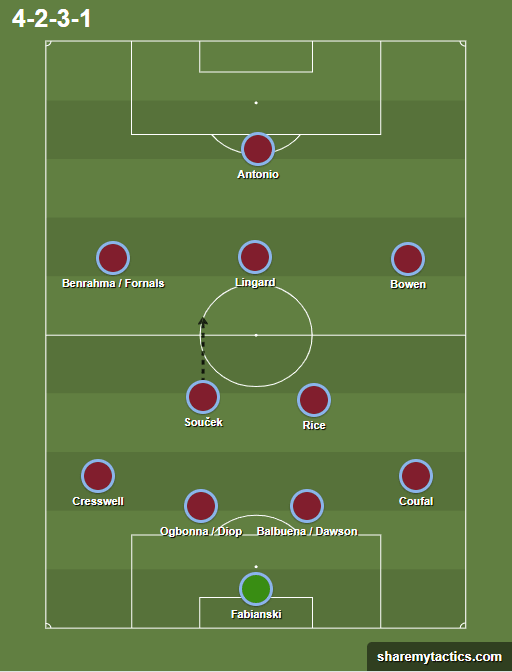
With this change, we saw Cresswell getting back to his natural position at left-back. Craig Dawson, who is loan from Watford at West Ham, had not played a single minute before the match against Southampton on 29th December, but since then, he has become a key part of the side, having played every minute. Soucek and Rice kept their position, but in this formation, they had, at first Saïd Benrahma, and now Lingard in front of them as a number 10. When Lingard arrived, Benrahma was used more on the left wing along with Fornals, while Bowen kept the right-wing position. Antonio is the only centre-forward in the team after Haller’s departure, but he is having one of the most efficient seasons of his career and he would have scored even more goals if he had not been hit by injury this season. Since changing formations West Ham have won 32 points with nine wins and five draws in 18 matches.
In the next chart, we will see their defensive and offensive performance as shown by their actual goals scored and conceded versus expected goals.
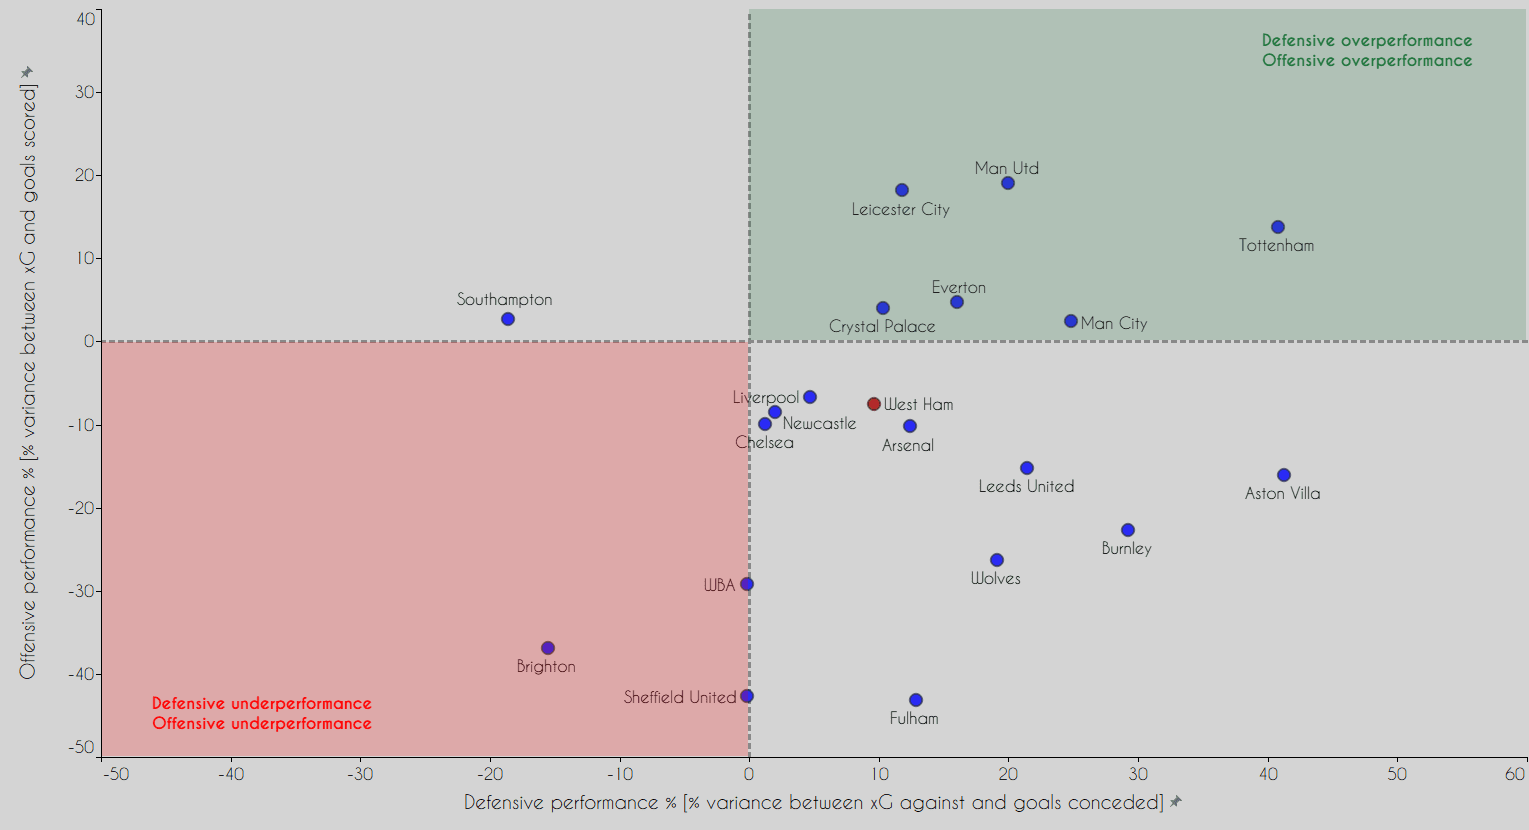
We can see that West Ham are only around 10% better in terms of defensive performance when looking at expected goals, which is not much since only two teams are performing worse than expected in the defensive phase of the game. They are underperforming in attack, however, and they have scored 7.5% fewer goals than expected. However, it is interesting that Arsenal, Chelsea and Liverpool are all in the same cluster of the chart as West Ham, as well as Newcastle United. West Ham only need to improve their goalscoring performance to be classed as one of the teams which are overperforming both their offensive and defensive expected goal metrics. Tottenham are the biggest overperformer so far this season if we take into account both attacking and defensive performance. Let’s see how they look only based on the expected goals model.
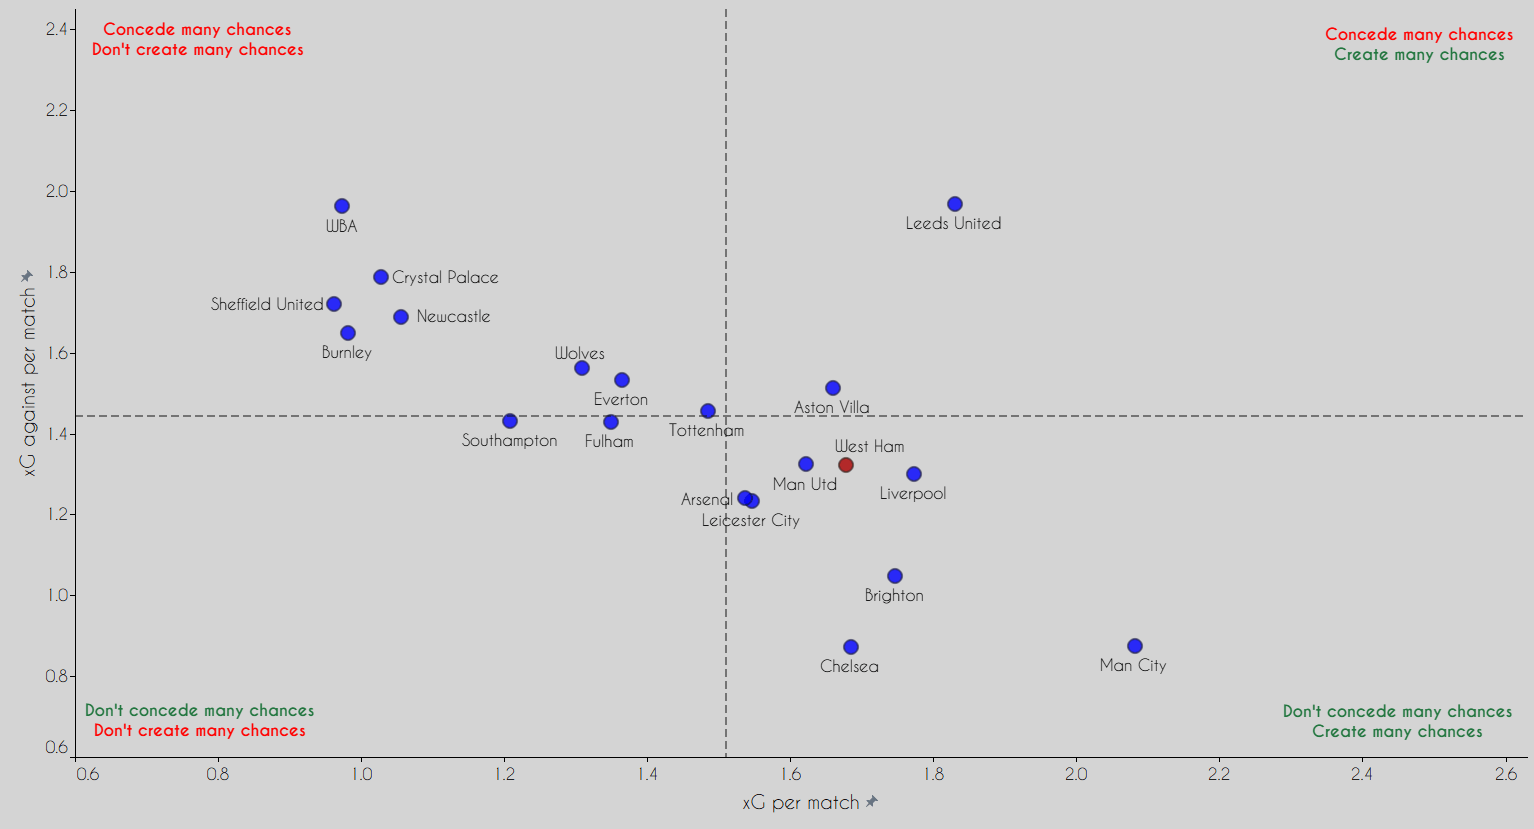
The graph above represents how West Ham are good in terms of expected goals for and against. They have generated 1.68 xG per match on average this season, which is more than Manchester United, Arsenal, Leicester and Tottenham and only bettered by five teams. They are also averaging 1.32 xGA per match which is the 7th best in the league. Thus, it is perhaps not so surprising to see West Ham so far up the table, since they are one of the better sides in the league based on the expected goal metrics.
In possession
In this section, we will try to evaluate various statistics for West Ham as a team, as well as for individual players. Team data will show us playing style and tendencies in possession while individual data will show the players’ impact on team performance.
This next chart uses lateral passes per 100 passes and forward passes per 100 passes, which will tell us if the team is patient when in possession or if they are more direct. The size of the marker in the graph below represents average possession % this season.
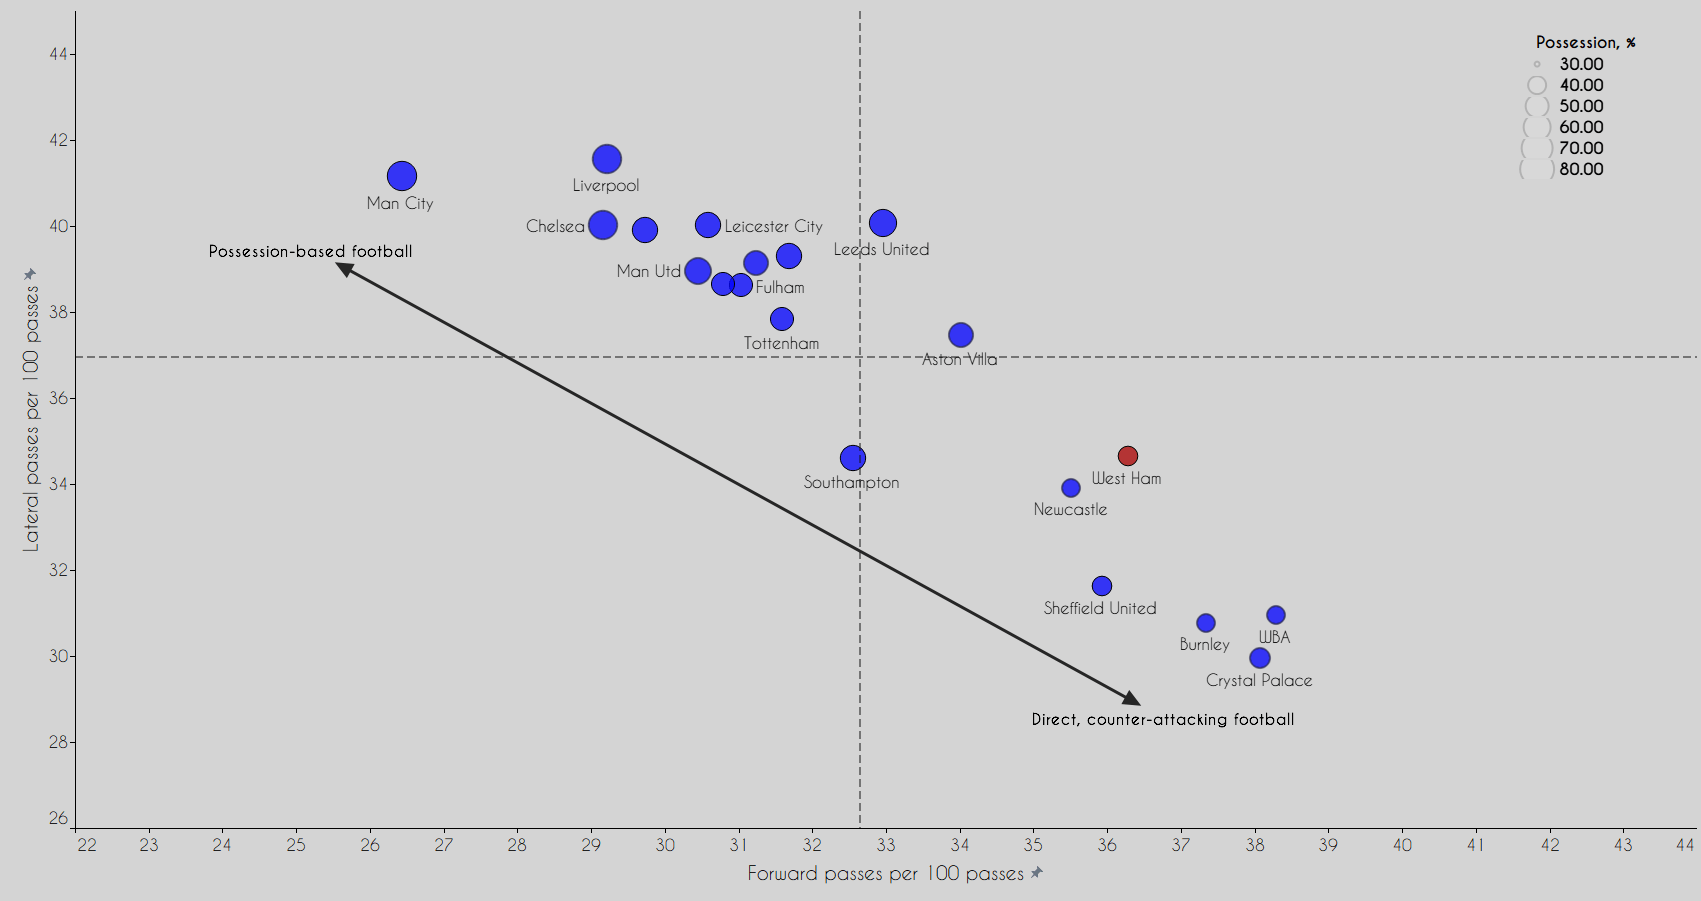
The graph above shows that West Ham are one of the teams that are more direct – the Hammers have averaged 41% possession this season and they have the fourth-highest forward passes per 100 in the league. West Ham’s efficiency in this regard can also be seen by the fact that the other teams around them in this chart are all below 10th place.
The next chart will show us shots per match and average shooting distance for teams in the Premier League this season.
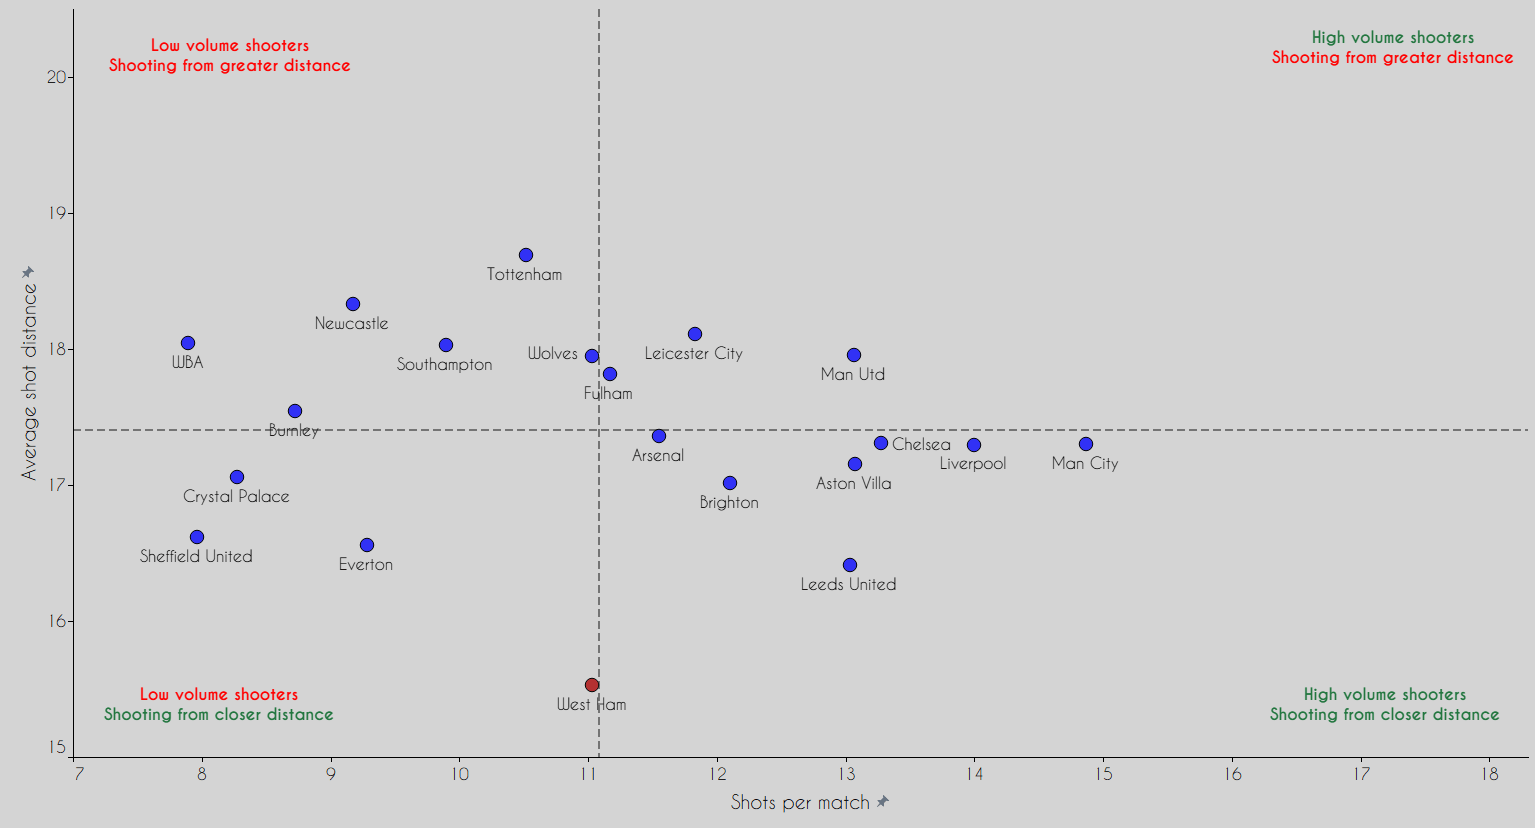
West Ham are shooting from 15.5 metres on average while attempting 11 shots per match. Their shooting distance is impressive, as they are the only team whose average shot distance is less than 16 metres, which is one of the reasons for their highly efficient direct football, as they are taking shots from more dangerous positions. Comparing them with Tottenham on this graph we can see why Tottenham are the biggest overperformer in attack, while West Ham are deservedly in fifth place on the table.
Moyes’ gameplan is proving to be very efficient this season and in the next few graphs, we will see how his players have impacted the team’s performances. The next graph displays the progressive ability of defenders and midfielders in the league, with red markers denoting the West Ham players.
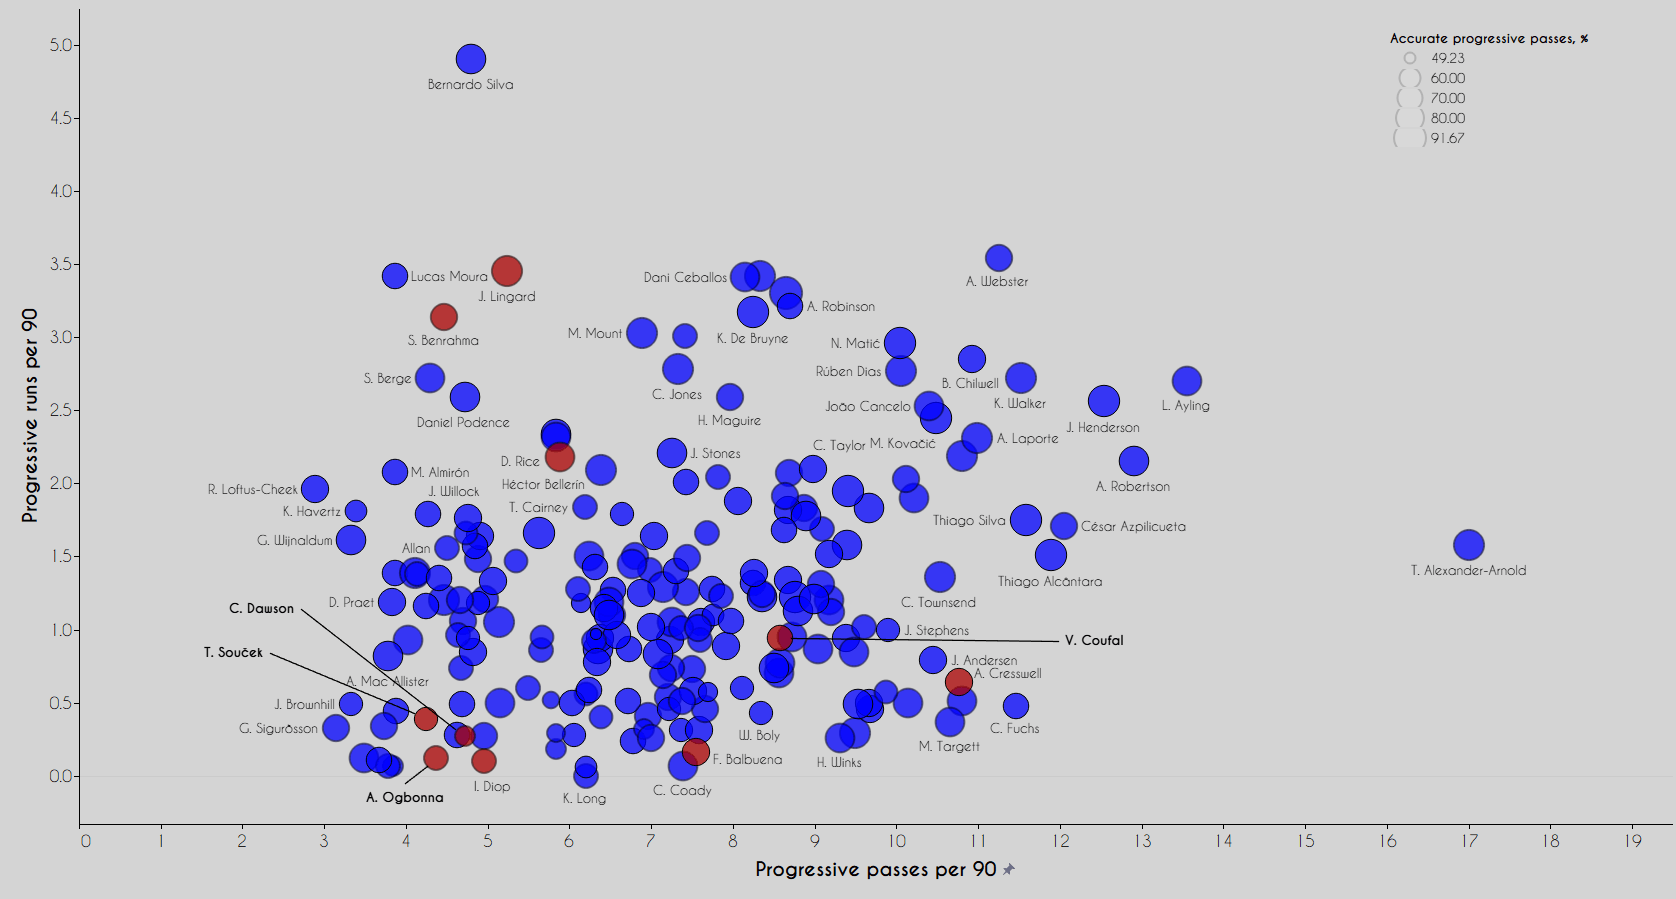
We can see that Benrahma and Lingard are among the best players in terms of progressive runs per 90. West Ham’s direct style leaves a lot of space to run into during offensive transitions and these two players possess both quick feet and excellent ball control to be able to carry the ball for long distances at their feet. Declan Rice is also impressive in terms of this metric, and given that he has mostly responsible for recycling possession, it is interesting to see that he can make progressive actions when needed. The full-backs, Coufal and Cresswell, are mostly responsible for progression through passing and they attempt the highest amount of progressive passes in the team.
The centre-backs are not involved in progression except Balbuena who tends to make progressive passes, with 7.5 attempts per 90. Soucek is not involved in progressive actions at all and he acts more as receiver of those passes. Soucek’s role has more of an impact off the ball, where his smart movement creates space for himself as well as his teammates.
The next graph will show us the creativity from midfielders and forwards through shot assists per 90 and deep completions per 90, while the size of the markers represents expected assists per 90.
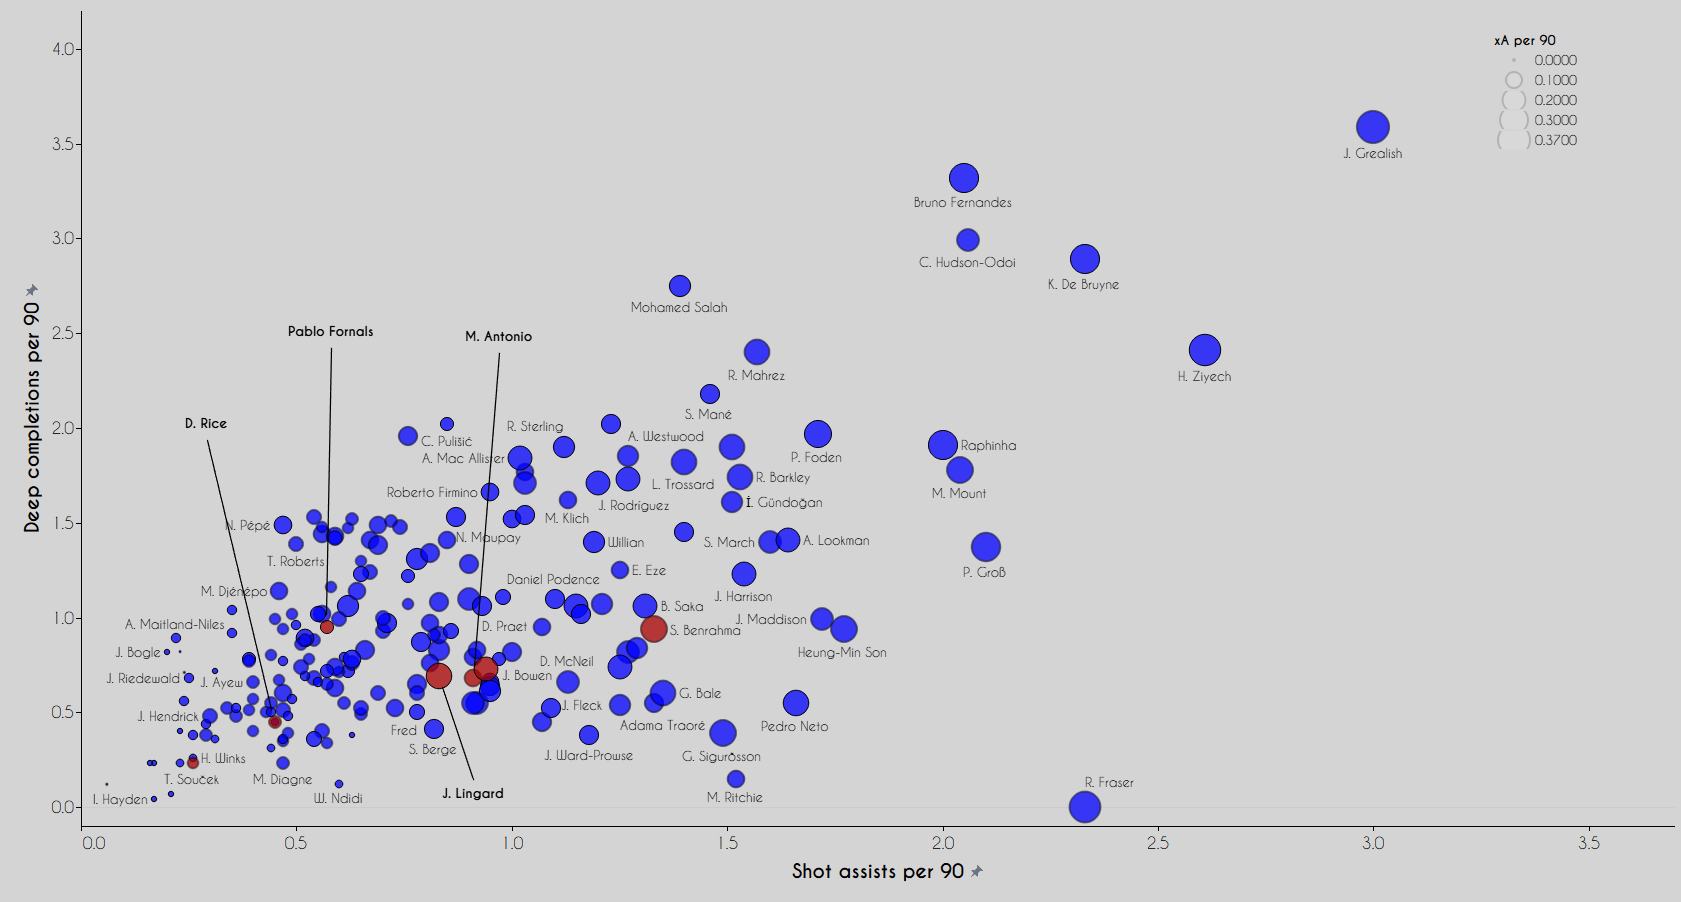
It is clear that West Ham do not have a top creator who stands out compared to others in the league, but all their offensive-minded players have contributed here. Benrahma is the player to be highlighted as their most creative player with 0.25 xA per 90. Bowen, Lingard and Antonio are close on this graph and all of them average around one shot assist per 90, while Fornals is the player who is underperforming in terms of creativity given his quality.
We can assume that West Ham’s fast-paced football prevents them from having one player who stands out in terms of creativity. However, all their offensive options can create which makes them unpredictable in the attacking phase and makes it harder for their opponents. It is also worth noting that Cresswell is a good creator for them with 0.21 xA per 90. He is a dead ball specialist and his crosses are a good source of chances.
The last graph in this section looks at shots per 90 and touches in the box per 90. The size of the marker represents expected goals per 90.
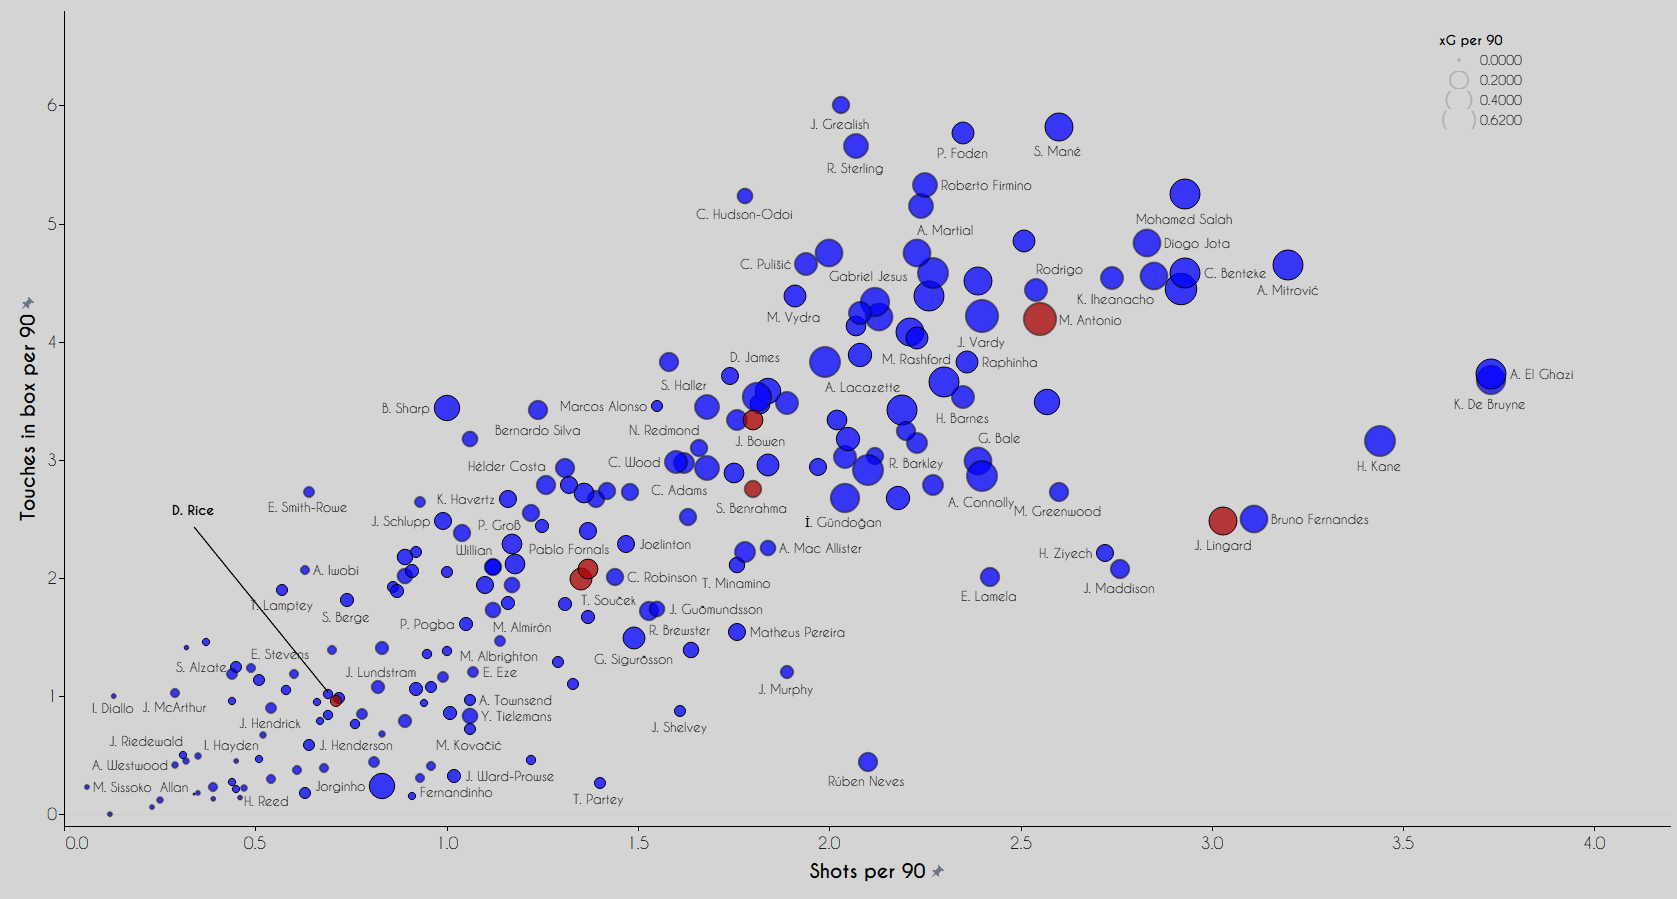
Antonio’s stats show how he has developed through the years from a winger to an efficient centre-forward who is most comfortable in the penalty area. Based on his 4.2 touches in the box per 90 and 2.55 shots per 90 it is not surprising that he is only behind Jamie Vardy for xG this season, averaging 0.61 xG per 90 compared to Vardy’s 0.62 per 90. As we said in the first section, Antonio would have probably had more than his current seven goal tally this season if he had managed to stay injury-free. Lingard has been unleashed since his move to West Ham with five goals and three assists in seven appearances, and he averages 3.03 shots per 90 and 2.48 touches in the box per 90.
However, the club’s best goalscorer is the central midfielder Soucek. He is making the most of his movement with late runs into the penalty area and he is also a threat from set-pieces because of his height. Soucek has scored nine goals in 29 appearances and it is just a matter of time till he reaches double figures this season, which would be a stunning achievement. Benrahma is still waiting for his first goal in the Premier League while Bowen has six in this campaign, with both of them shooting more and having more touches in the box per 90 than Soucek. As expected Rice doesn’t have a big impact in this area.
Out of possession
After going through data on how the team looks in possession, now we will see their tendencies and ability when out of possession. In the first graph we will take a look at their pressing tendencies.
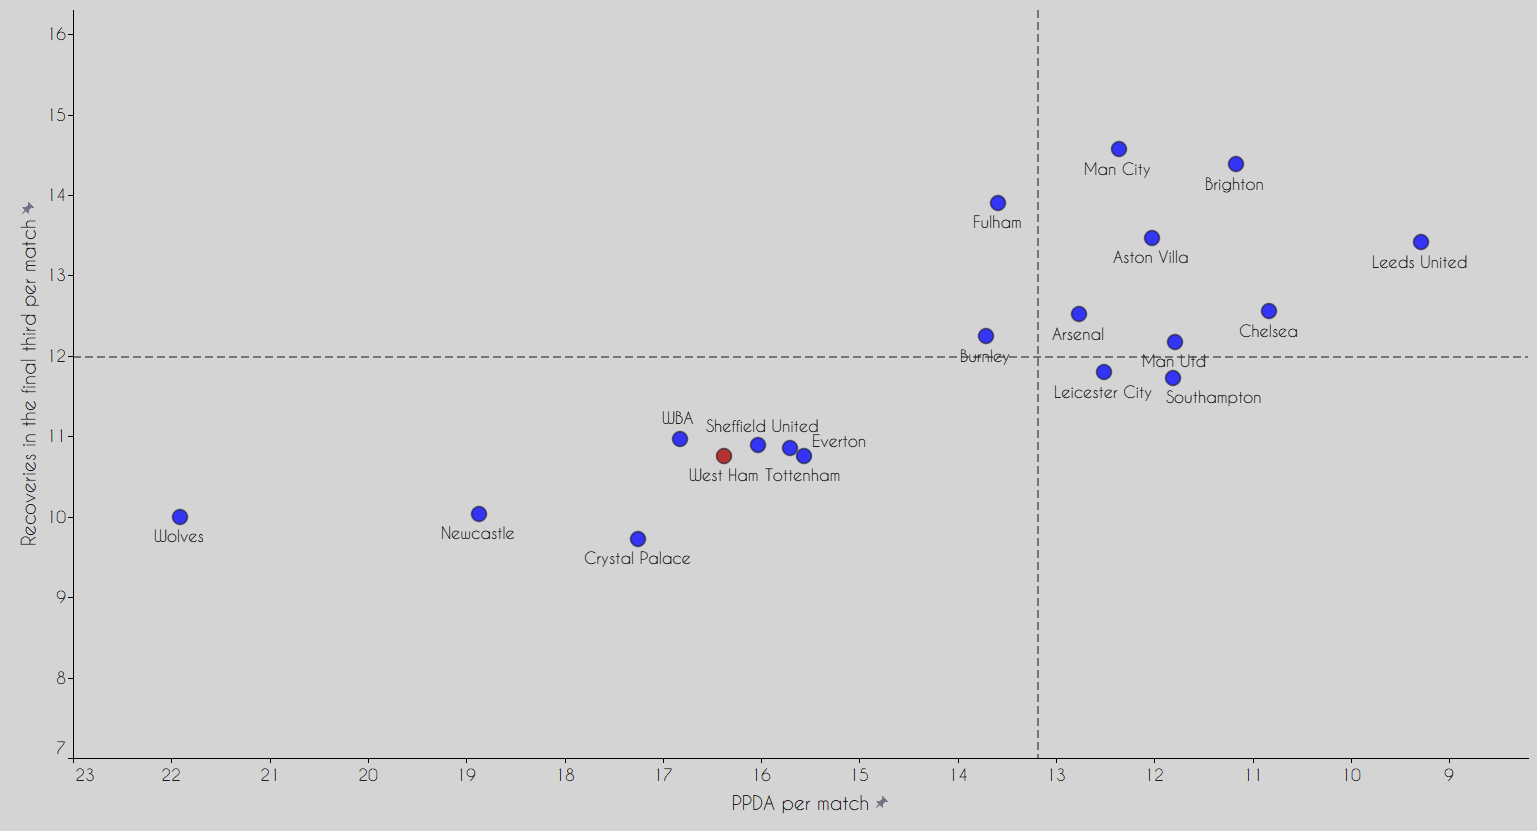
The graph shows how West Ham do not press often and that they are more comfortable with structured defending in their own half of the pitch. Only four teams have a higher PPDA than them while they are the 5th worst for recoveries in the final third per match. This is yet another illustration of West Ham’s defensive style, which has been extremely effective for them as seen by the previous charts.
In the next graph, we will take look at the performance of defenders in the league this season, through the success rates for aerial duels and defensive duels.
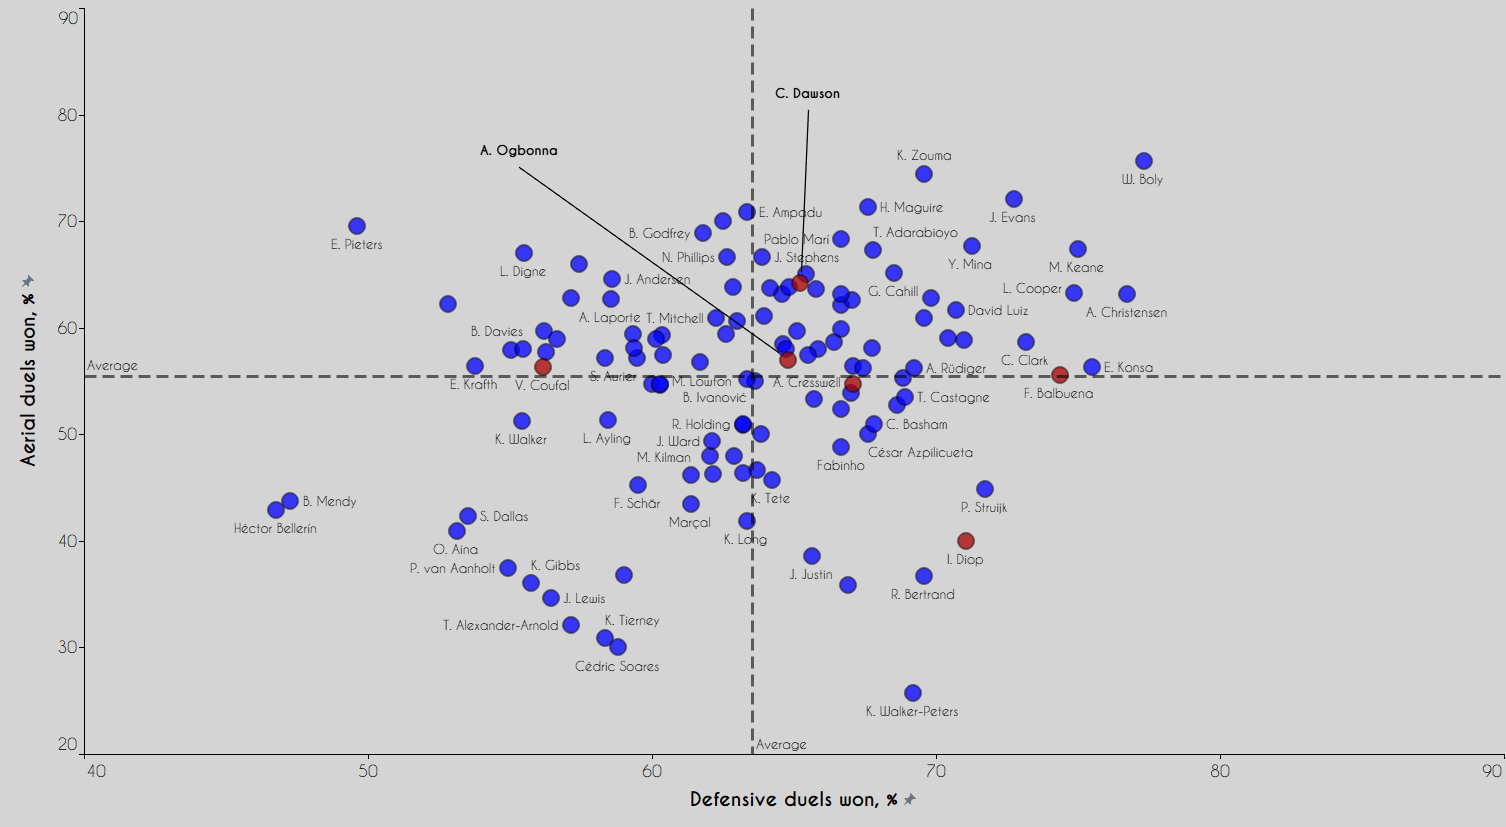
At first glance, we can see that the West Ham defenders are generally good at winning their defensive duels, and only Coufal is below the league average for percentage of successful defensive duels. Balbuena is among the top players for this, winning 74% of his defensive duels, while Diop has also shown that he is very good at defensive duels. However, he is the only West Ham defender who is winning less than 50% of his aerial duels which is surprising given his height.. Diop has not been attempting too many defensive duels this season, which may point towards West Ham using his defensive partner, usually Balbuena or Dawson, as the primary ball-winner in the air, and thus this low success rate should not be too concerning. Dawson, in particular, has brought extra quality to West Ham’s defence for the second half of the season – he has won 65.2% of his defensive duels and 64.2% of his aerial duels, making him an excellent addition to the Hammers’ backline. We can conclude that the West Ham defenders are a very successful group when it comes to duels.
For the last part of this section, we will take a look at Fabianski’s stats this season compared to the other keepers in the Premier League. The Poland international has had a few impressive performances every season, but he has become a lot more consistent over the last couple of campaigns, keeping West Ham in matches and often winning them crucial points.

Fabianski has nine clean sheets in 27 appearances, with only five keepers having more than him, while he has the same number of clean sheets as David de Gea, Nick Pope and Illan Meslier. He is around the average compared to the other keepers when it comes to goals conceded and he is averaging 1.14 goals conceded per 90. The same can be said about his xG against, where he is averaging 1.1 per 90 which means he has conceded roughly the same number of goals as would have been expected given the quality of chances created. Prevented goals per 90 basically subtracts goals conceded from expected goals and shows this. Only four keepers are performing worse than Fabianski based on this metric, which is slightly concerning. He has a 70.3% save rate which ranks him in 12th place out of 21 keepers in the data set. Fabianski can improve his performances, but based on the data he is performing at a similar level to the previous two seasons.
Conclusion
At the start of the season, most observers would have predicted that West Ham would be in the bottom half of the table, and perhaps even in a relegation battle. This shows the scale of improvement that David Moyes has managed to bring out of this West Ham side, and brings back memories of his successful spell at Everton around a decade ago.
Based on the data we have seen in this analysis, it looks like the Hammers have executed their game plan almost to perfection and their position on the table is well-deserved. It will be interesting to see if they can keep this up over the final stretch of the season, but it is looking increasingly likely that the Hammers will be in European competition in some form next season.



Comments