It has been a long time since the Serie A was so competitive and tense. Juventus have won the title for nine seasons in a row and most of those times, they won it by a large margin. Napoli, Roma and Inter were the teams that have come close to dethroning Juventus in the last nine seasons, however they all ended up short on that account. This season, however, reminds us of the period at the beginning of this century when there were quite a few teams that could win the title. Some of the top teams are looking to exploit Juventus’ unexpectedly bad campaign thus far and push for the title. We are witnessing an AC Milan renaissance with the veteran Zlatan Ibrahimović as the key figure of their successful season so far, while the likes of Roma and Inter Milan also have credible shouts to be in the title race.
Through this data analysis we will take a look at the numbers of the Serie A clubs so far and compare them across different statistics. This analysis will show us which teams could have an advantage over their table rivals based on the data. From the top seven teams only Inter will not participate in the knockout phase of European competitions which could be an advantage for them in this season’s tight schedule.
Performance and expected goals model
The first graph we will analyze consists of created metrics called defensive and offensive performance. Both metrics are in percentage value and they represent the team variance between xG and goals.
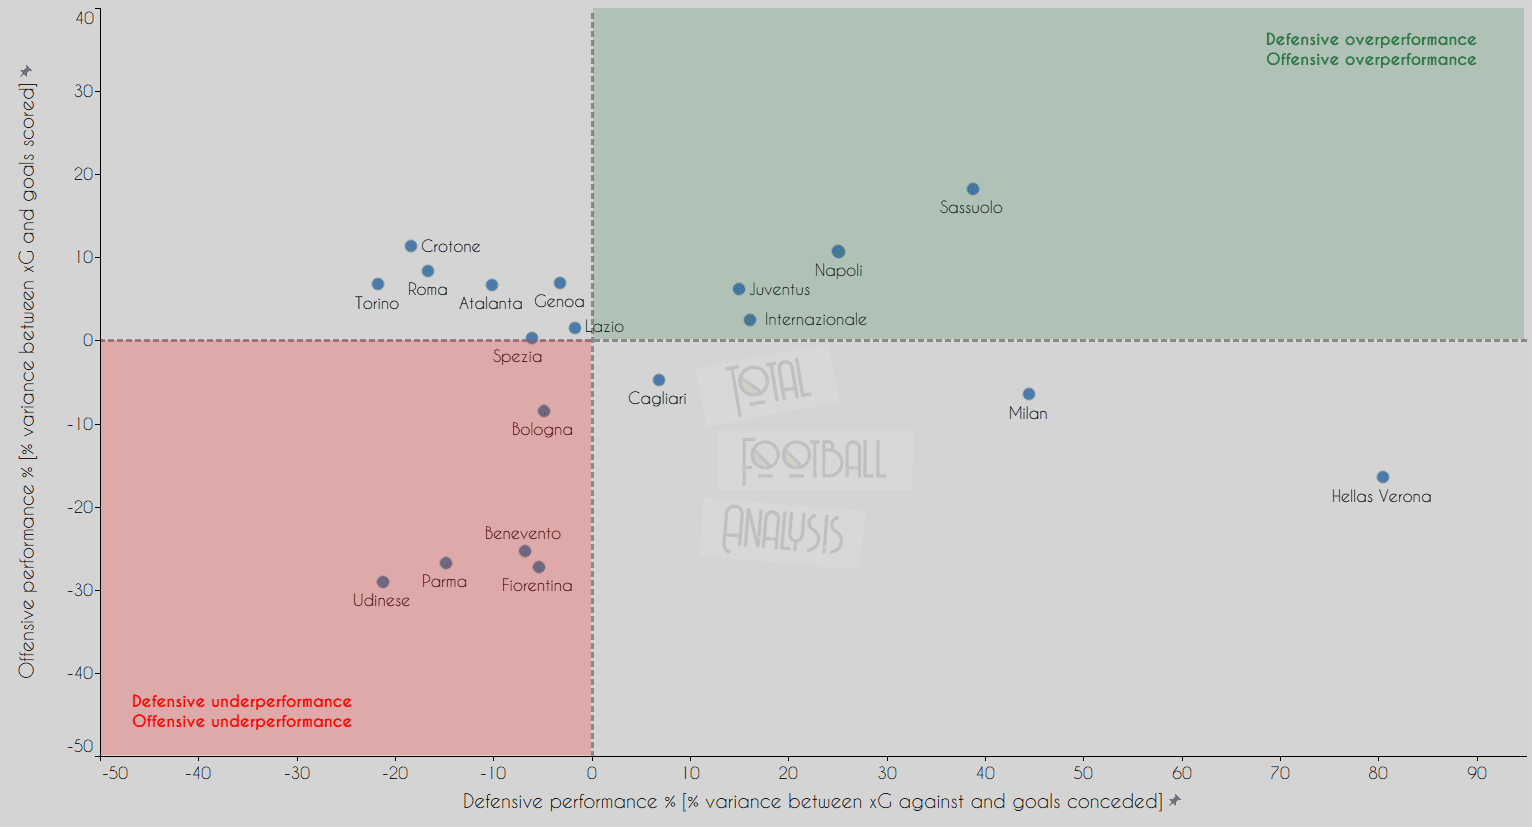
There are four teams that are overperforming for both expected goal values on this graph: Sassuolo, Napoli, Juventus and Inter. We can see that Sassuolo are overperforming defensively by around 40% with only Milan and Hellas Verona in front of them. However, both Milan and Hellas Verona are underperforming offensively while Sassuolo are the biggest offensive overperformer with around 20% better outcomes than expected. Juventus, Napoli and Inter are close on the graph, and also on the league table. It is a little worrying for Juventus that they are overperforming in both metrics but they sit in 4th place meaning they haven’t played at the level everyone expects them to be at. Hellas Verona are the biggest defensive overperformer and big praise goes to Marco Silvestri for this. Silvestri has managed to keep 5 clean sheets and concede 18 goals in 19 matches making Verona the team that has conceded the least number of goals in the league. Udinese have not shown too many poor performances this season, however they are the biggest underperformers and could probably be in the top half of the table if they had a better conversion rate. Fiorentina are a team that has made a negative surprise on this graph given the number of well-known players they have in their squad.
The next graph will show us xG values to see the quality of the team based on the quality of chances created and allowed.
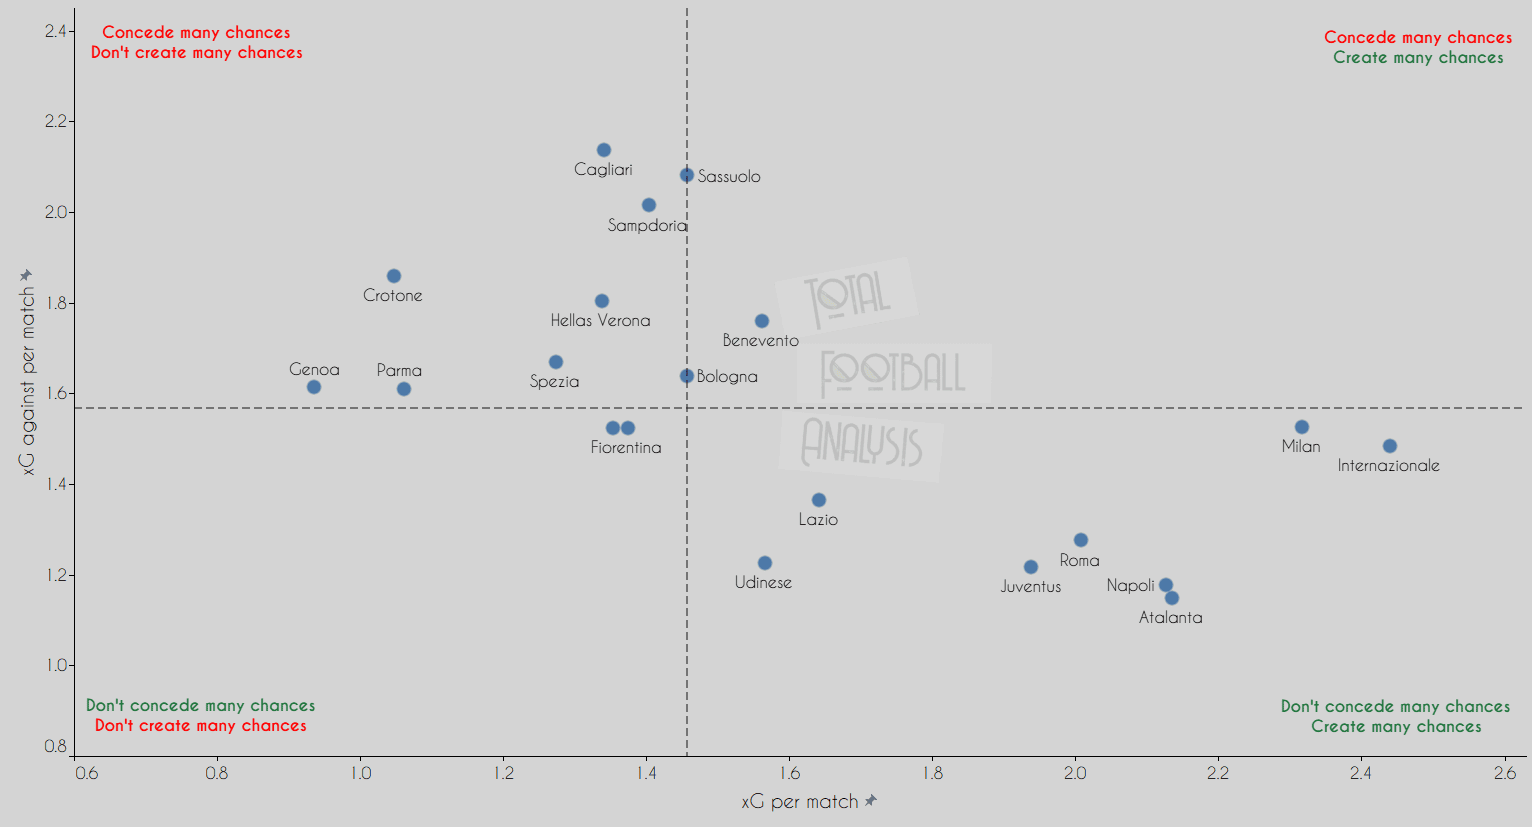
Based on this graph we can see why Sassuolo and Hellas Verona are such big defensive overperformers, since both teams are in the top left quarter which means they concede a lot of chances and don’t create many chances. The top seven teams are accompanied by Udinese in the part of the graph with teams that create many chances and don’t concede many chances. Atalanta, for the second season in a row, are allowing the lowest amount of xG against per 90. Most people wouldn’t mention them as the team that has the best defence, but their high pressure keeps opponents far from their goal for most of the match. The two Milanese clubs are the only two clubs with more than 2.3 xG per match, but they are conceding more xG against per match than the other top teams. Genoa, Parma and Crotone are creating small amounts of chances which has led to their low position on the table. Newly promoted Benevento are looking way better than Crotone in their comeback season in Serie A. Benevento have created way more quality chances and are allowing slightly fewer quality chances than Crotone which is the reason why they are in a safe position in the middle of the table. Cagliari have conceded the most xG against per match and they are the worst team in the league when it comes to conceded goals (37).
Attacking
In this section, we will take a detailed look into teams’ shooting and passing tendencies, while also analysing how dangerous they are from set-pieces. First we will take a look at how often teams shoot and what is their average shooting distance.
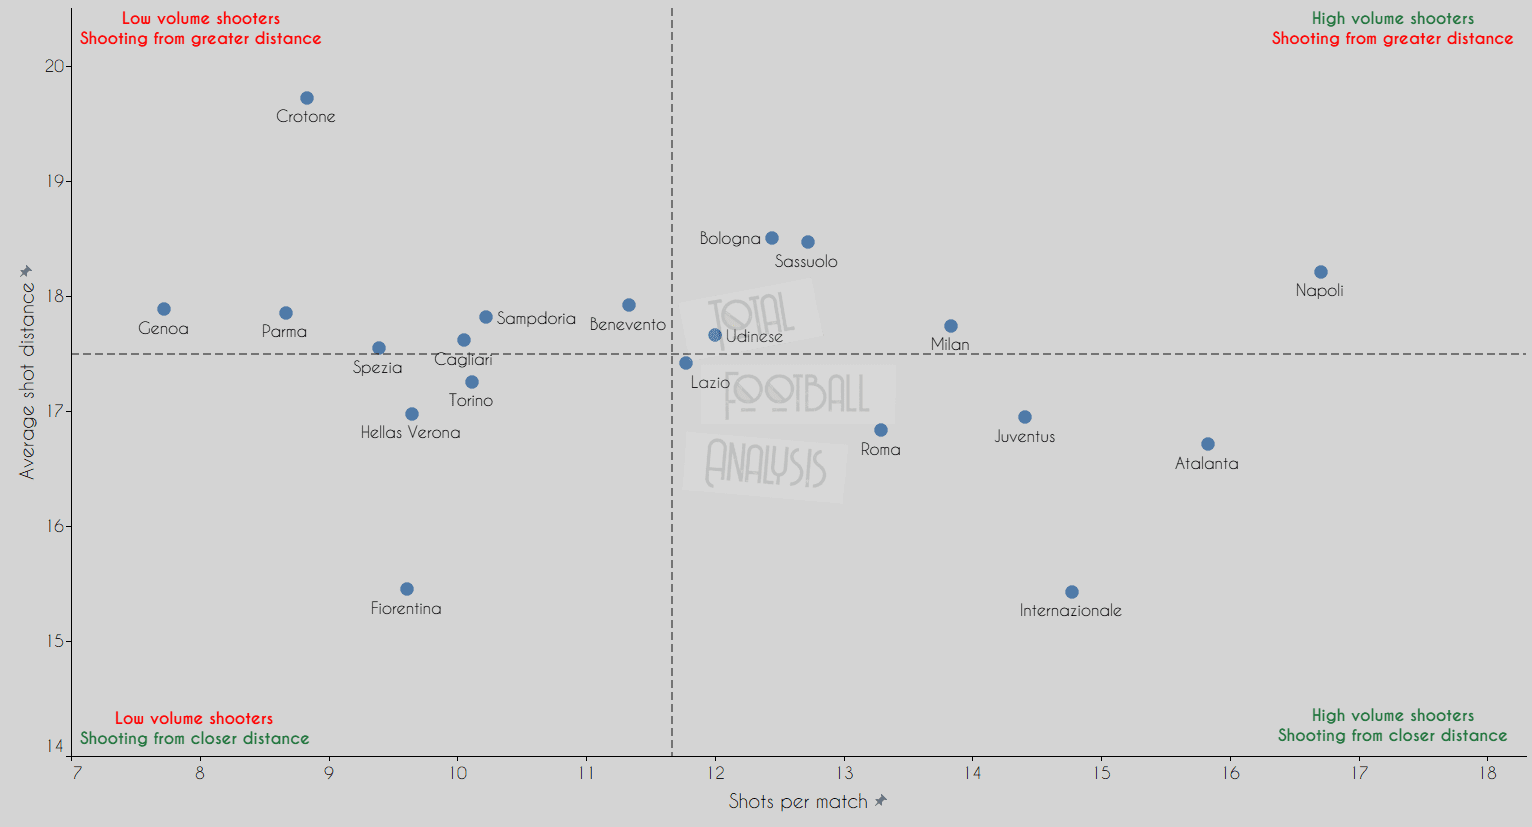
Napoli are shooting the most in the league, but they shoot from further distances. This is understandable when you have quality inside forwards who tend to shoot from outside the penalty area when they cut inside on their stronger foot. Inter, Atalanta, Juventus and Roma shoot more than 13 times per match and tend to shoot from closer distances to goal. However only Inter from the mentioned teams shoot from a much closer distance and it is part of their philosophy to deliver the ball into the penalty area for their deadly duo Romelu Lukaku and Lautaro Martinez. Fiorentina shoot from closer distances as well, but they are low volume shooters and they should tend to shoot more often. Crotone are the only team in the league which shoot from more than 19 metres on average which is a clear indicator of their lack of patience during attacks and tendency to shoot whenever possible.
On the next graph we will evaluate the passing tendencies of Serie A teams. It will show us which teams are more direct and which teams tend to play more positional football. The size of the circle represents the average possession in %.
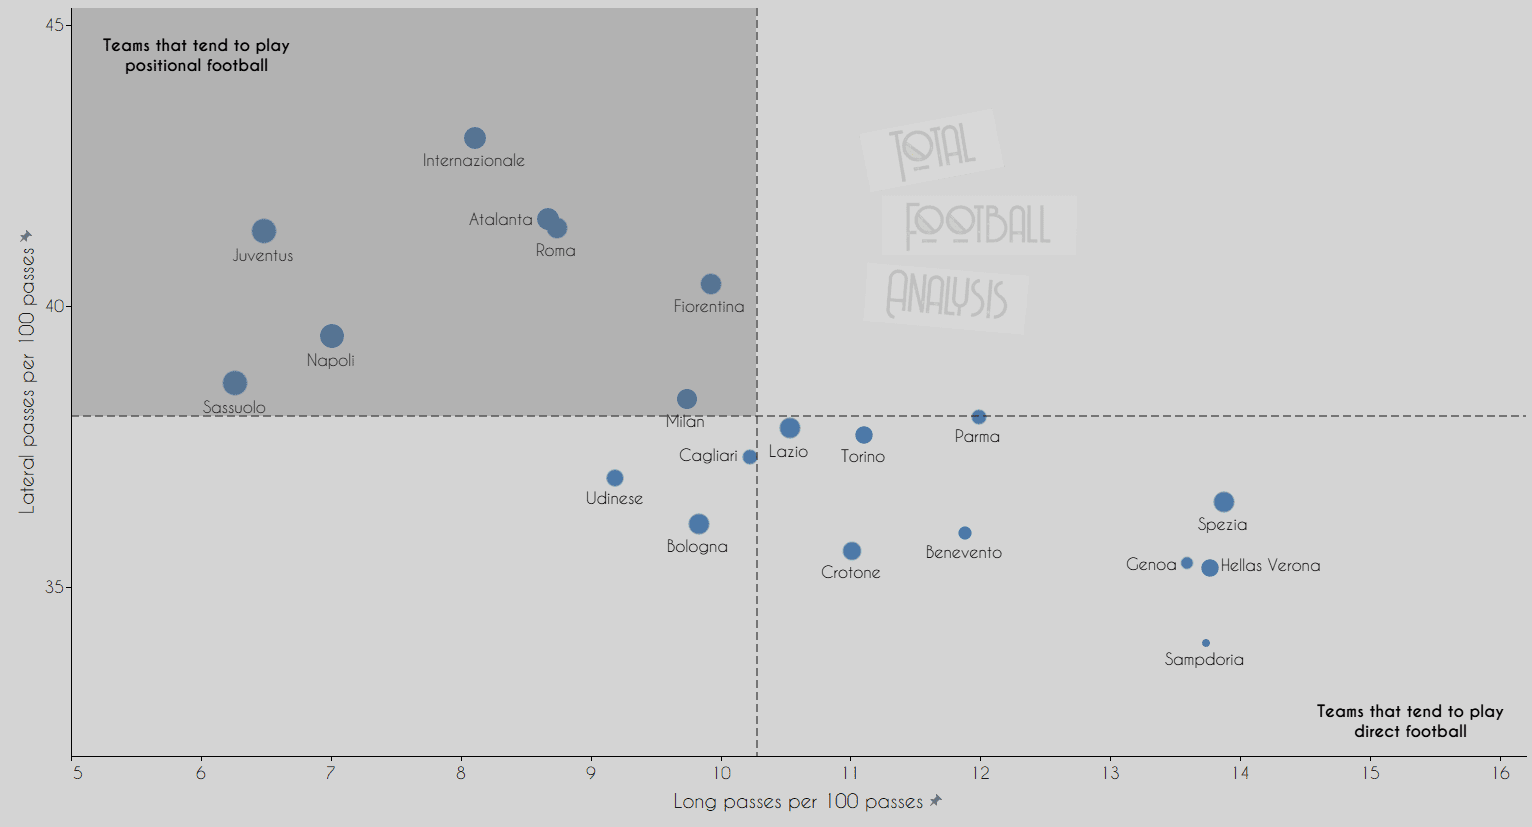
We can see that Sampdoria are the most counter-attacking team in the league with the lowest average possession while tending to attempt a lot of long passes and avoiding lateral passes if possible. Claudio Ranieri’s tactics were successful for Leicester and he has tried to replicate that with the Sampdoria squad as well, even playing in a similar formation. Hellas Verona, Genoa and Spezia are the other teams that tend to play more direct football. Juventus play the most positional football in Italy, patiently building attacks and avoiding playing too many long balls. Sassuolo play the lowest amount of long passes per 100 passes and they seem like an unusual team given all the graphs we evaluated so far. They are the biggest overperformers in the league, however their playing style doesn’t indicate that their primary objective is to prevent opponents from scoring before making direct fast-paced attacks. Instead Roberto De Zerbi demands patient build-up which has proved successful for Sassuolo this season.
The last graph in this section will show us how dangerous teams are from set-pieces in Serie A.
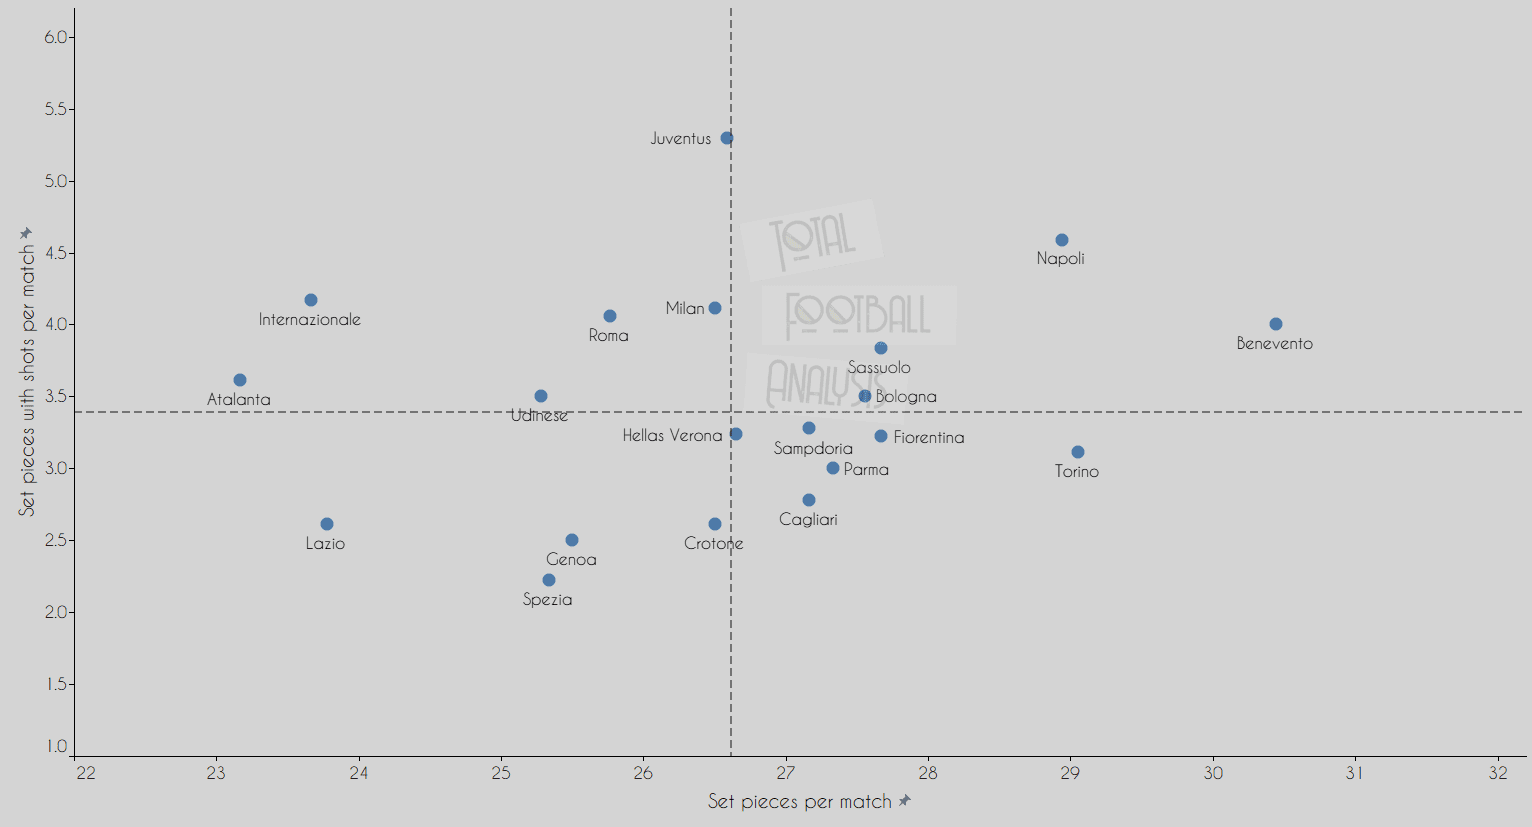
Juventus are the team which shoots the most after set-pieces. They are the only team that are shooting more than five times per match, on average, following set-piece situations. Napoli and Benevento have a lot of set-pieces and they manage to shoot often following them. Atalanta and Inter have the least number of set-pieces per match but they manage to attempt an above-average number of shots after set-pieces. Only Benevento have scored more goals from set-pieces than Inter with 10 goals compared to Inter’s 8 goals from set-pieces. Genoa are the only team that hasn’t scored from a set-piece situation so far which is concerning for them because set-piece goals could give them a boost in their fight to avoid relegation.
In all the graphs over this section, we can see that Atalanta, Inter, Milan and Juventus are very hard to separate on these metrics, and therefore decide which of these teams is playing better than the other. It is interesting to see such similar numbers from the top teams which sets up the second half of the season for a close title race.
Defending
In this last section, we will take a look at teams’ success in duels and also their tendency to press higher and active attempts to regain possession. The graph below shows how successful teams are at defensive duels and aerial duels.
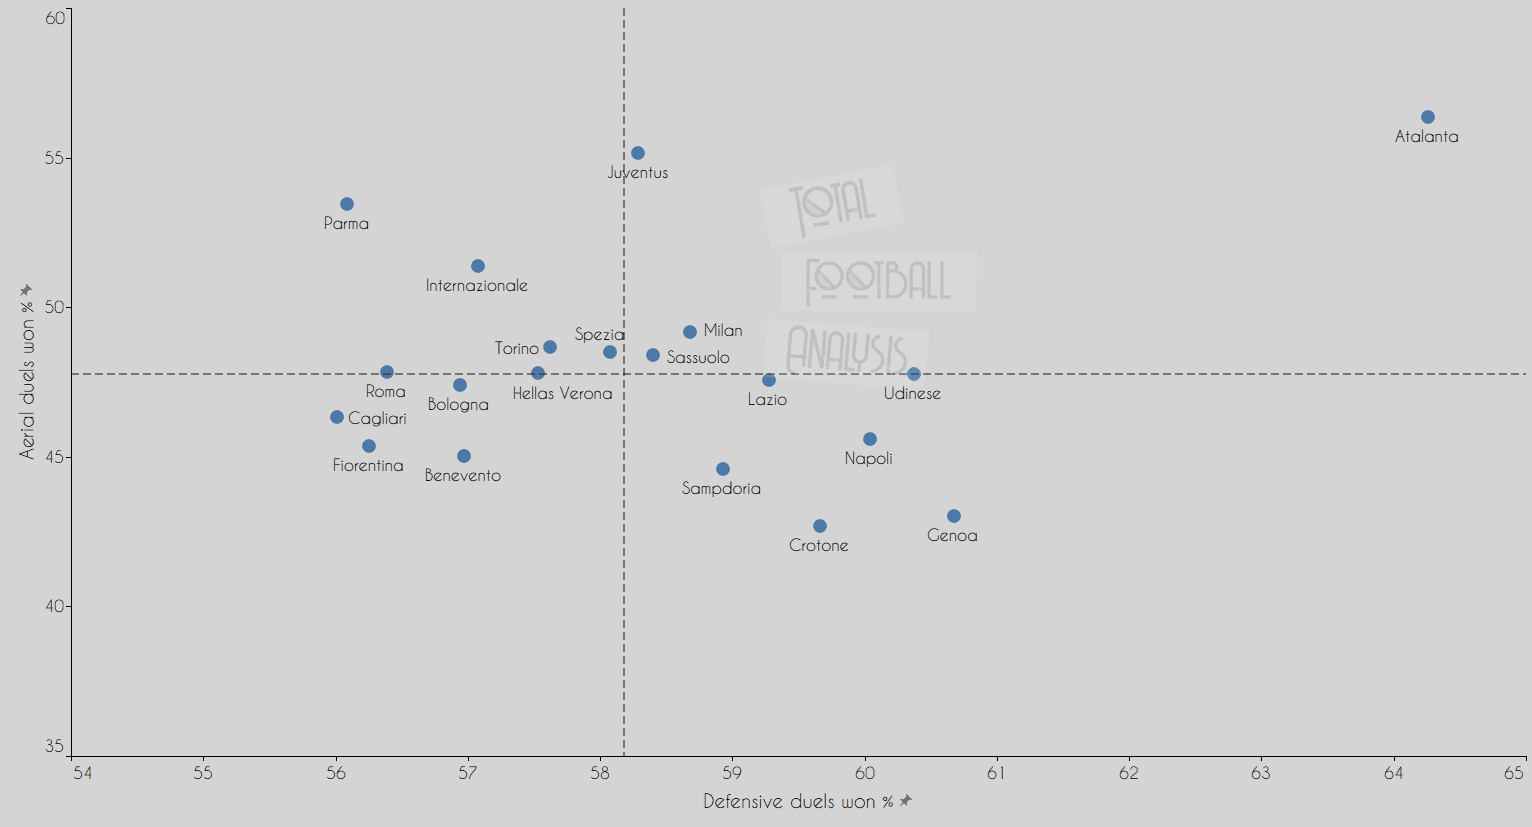
The best defence in the league based on expected goals models shows why they have shown such quality in their defending. Atalanta are winning more than 3% more defensive duels than the next team on this chart, Genoa. They are the best for aerial duels success rate as well. We can see that Juventus, Milan and Sassuolo are the other teams who are above average in both metrics. Inter are below average for defensive duels success rate, but they are strong at aerial duels which is to be expected given the aerial ability of their players, especially the centre-backs. Crotone and Genoa win the lowest amount of aerial duels; this lack of aerial quality should worry Genoa and it is surely a reason why they still haven’t scored from set-pieces.
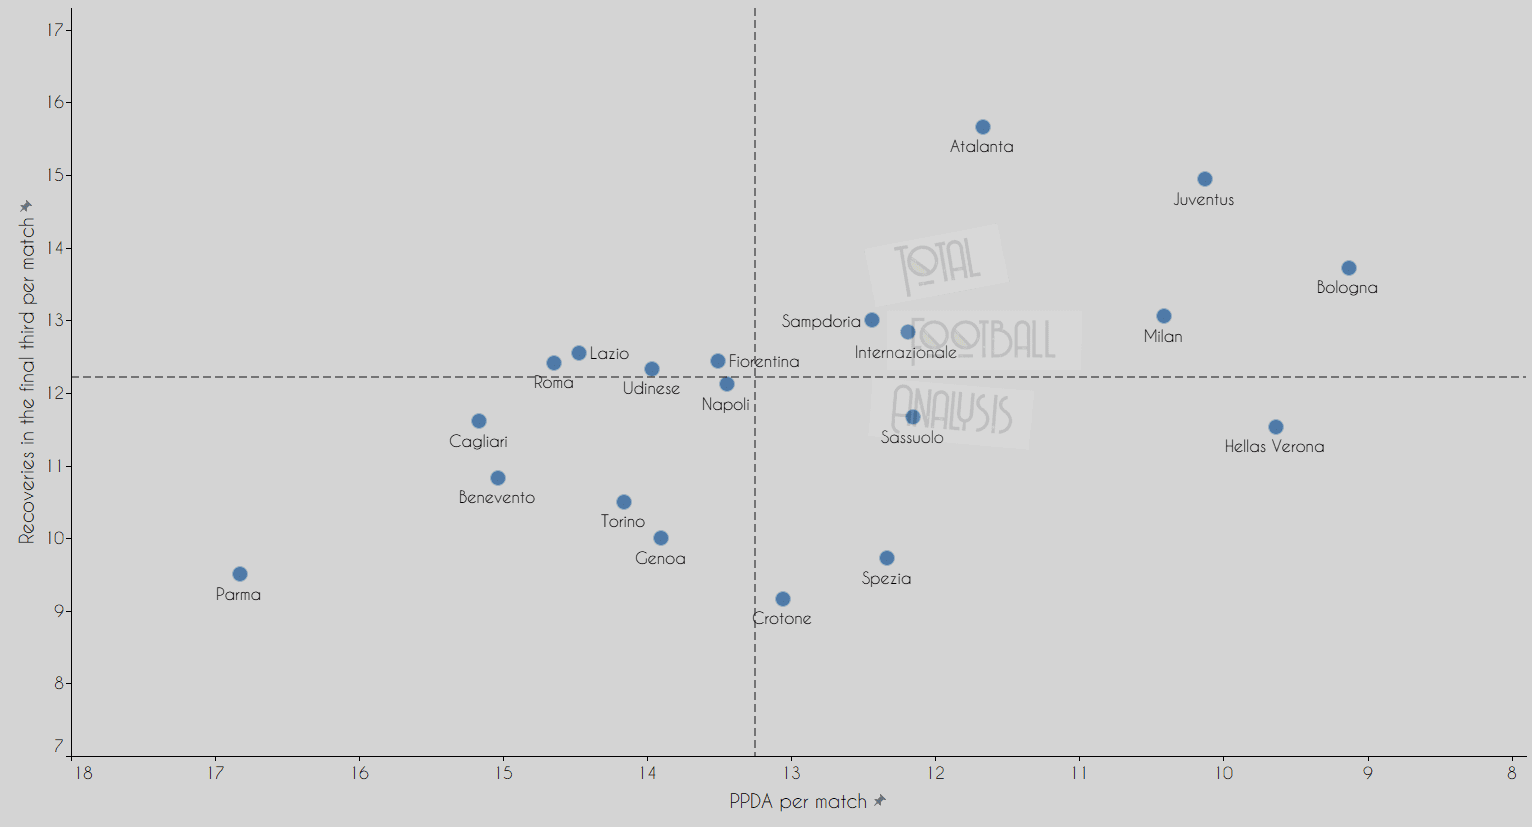
In this graph we can see teams’ PPDA per match (passes allowed per defensive action) and recoveries in the final third per match. We haven’t mentioned Bologna in this analysis yet, but they are trying to press the most in the league and they are pretty successful given the amount of recoveries high up the pitch. They are followed by Hellas Verona, Juventus and Milan. Juventus and Milan are also successful in their pressing actions, but Atalanta are the most successful team in terms of high pressing. Parma have separated themselves from the rest as the team that defends deep in their own half with a tendency to defend more passively.
Based on the defensive statistics we can conclude that Atalanta’s quality stands out compared to the other teams.
Conclusion
Through this analysis, we evaluated various metrics that indicate how the Serie A teams perform compared to each other. Based on performances so far, we are facing an unpredictable race for the title given the number of serious contenders. It will be interesting to see whether Pirlo will find the winning formula for Juventus’ bid for their 10th title in a row, or if one of his ex-clubs breaks this winning streak. Atalanta’s defensive numbers show that they cannot be ignored as a contender, because they also can outscore anyone on their day. Every Serie A fan should be excited for the second half of the season.




Comments