Clumsy control, blooded head bandages and Puma Kings. Back in the day, this was the starter pack required to be a successful centre-back in the Premier League. Other than for Phil Jones, this has significantly changed in recent years, as the game has developed and dynamic possession-based tactics have evolved the role of the centre-back. These developments have seen centre-backs progress into an integral part of all phases of a football match; heroic tackles have turned into threaded passes and subtle shirt pulling into one-twos with the goalkeeper.
With these changes, measuring the ability of a centre-back has become multi-layered and complex, as defending is now merely a small part of the job description. Analysts must focus on attacking input as well as the defensive aspect. Such a broad range of skill requirements means some defenders excel in one area, but falter in another. This makes it imperative for any side to not only understand where a defender’s strengths and weaknesses lie but how that statistical makeup of their style fits into a team’s philosophy.
In this analysis, we provide a data analysis of the best centre-backs in the Championship in a bid to identify those ready to make the step into Premier League football.
Starting with the basics
Regardless of the tactical revolution, the starting point for this investigation is with a defender’s (supposed) bread and butter: Defending. This is, after all, a fundamental requirement of any side’s central defenders, irrespective of their ability to attack.
To set the parameters, this data analysis looks at 41 Championship centre-backs. Not every central defender in the league has been included, just those with either a reputation, price-tag, promise or quirk. I have also excluded some centre-backs from the bottom sides, as their statistics would only skew averages. Each of the defenders have played over 900 minutes of Championship football this season and only domestic league matches have been included.
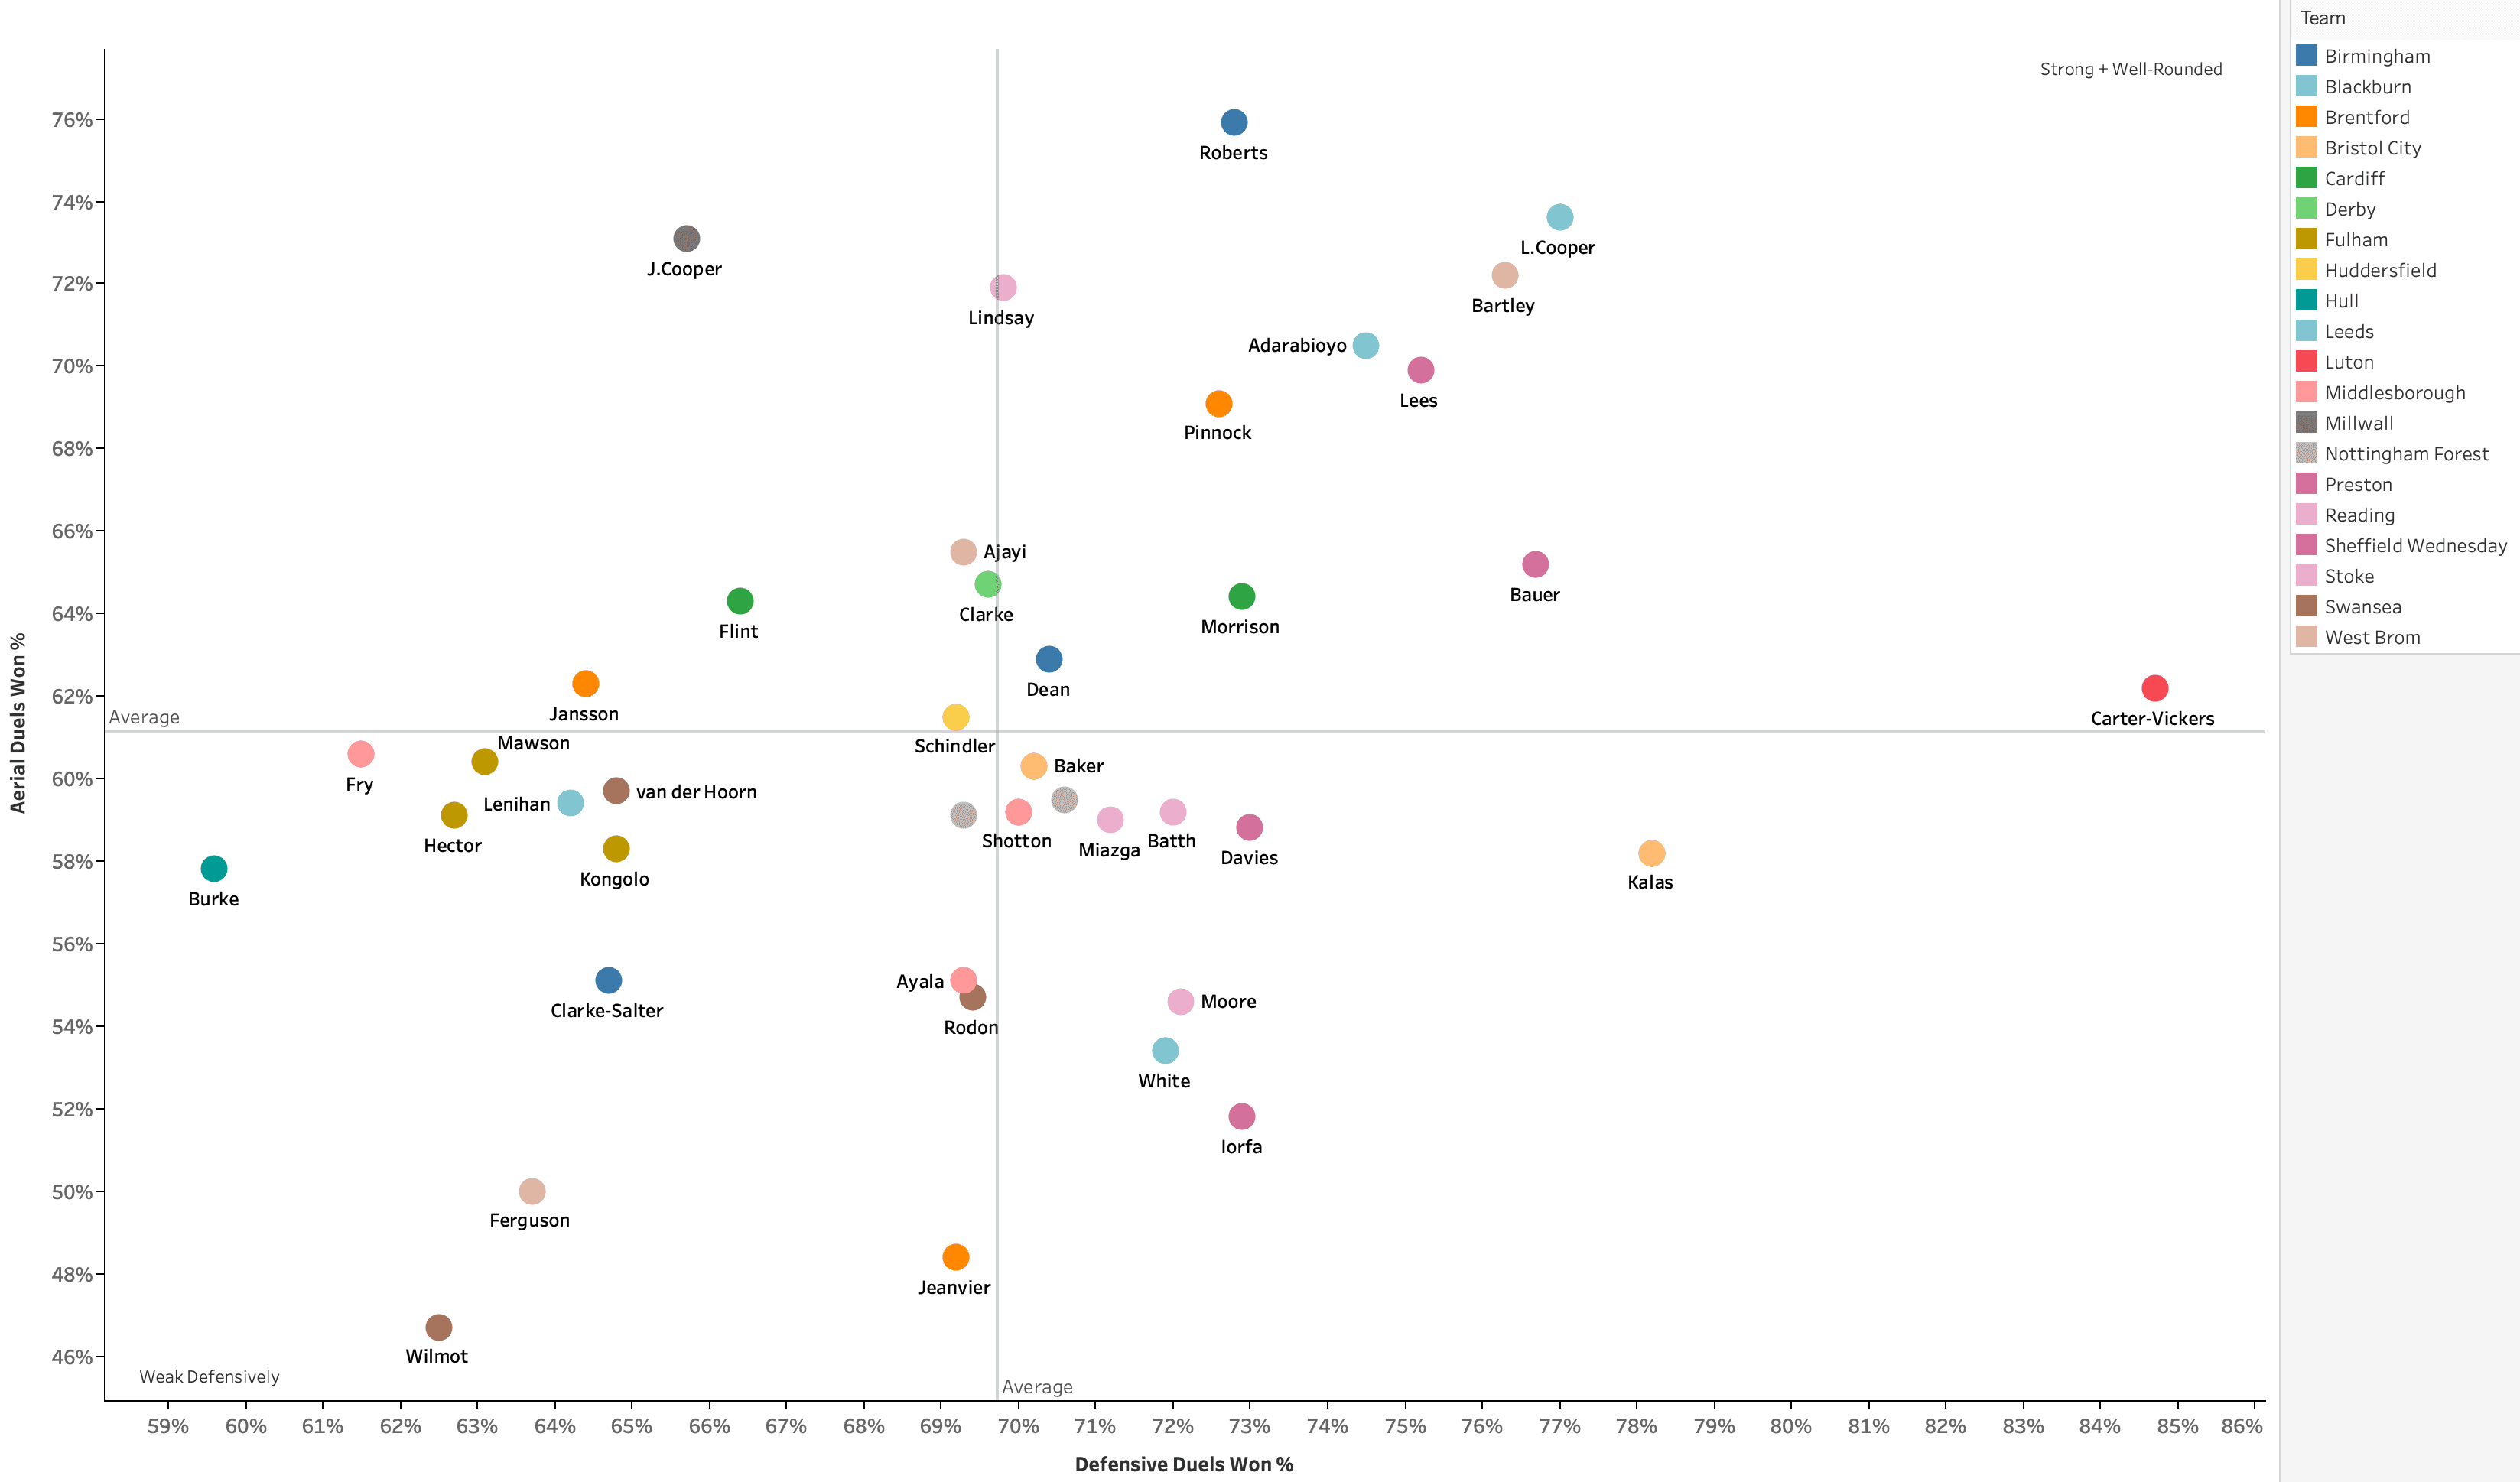
The test above cross-references each player’s ground duel success rate against their aerial duel success rate. The colour of each marker is dictated by the team they play for – with the key included on the right-hand side. Whilst neither metric directly correlates to a team’s ability to prevent shots from being conceded, the percentages do provide a good indication of how frequently a player is winning their individual duels.
The immediate standout is Cameron Carter-Vickers of Luton Town, who is currently on loan from Tottenham. The 23-year old has won 85% of his defensive duels this season, far beyond any of his rivals, with Tomáš Kalas the closest at 78%. Luton currently sit 23rd in the division and with 71 goals conceded, are the worst defensively. This contraction between statistics and league position can partly be explained by Carter-Vickers not featuring in every game for The Hatters and also that duel percentage is not directly correlated to Luton’s defensive ability as a team – just because Carter-Vickers is a rock, the other defenders may be quicksand. That being said, from an individual performance perspective, Carter-Vickers is showing promising signs of being a robust defender.
Another player who stands out as well-rounded is Liam Cooper of Leeds. The Scotsman wins 74% of his battles in the air and 77% of them on the ground. This high level of performance in both metrics puts him above both averages set by his peers and also portrays the picture of a player with few weaknesses from a defensive perspective.
A final observation from the data is looking away from well-roundedness to players with a clear imbalance. From the graph, Jake Cooper clearly fits that description. The 6”3 Millwall centre-back is unsurprisingly strong in the air, winning 73% of his aerial duels. This puts him far above the average of 61% and third in comparison to the other 40 players. Despite his large success in the air, Cooper shows a weakness in the ground duels, winning just 66%, below the average of 70%. Whilst not being the worst in this category, the disparity between the two metrics shows areas the Englishman needs to improve if he wants to take his game to another level.
So now we’ve looked at how each centre-back has performed from a defensive viewpoint with Cooper leading the way, it’s time to see how they shape up with the ball at their feet.
The modern defender
Before diving deeper into the statistics, it’s important to understand the philosophy each defender is playing within. A defender playing in a side focussed around counter-attacking may get overlooked as their passing statistics are superseded by players involved in a more possession focussed system. Therefore, the opportunity to pass is just as relevant to the success rate of it and ignoring the fact that some players are constrained within a system could result in scouting oversight.
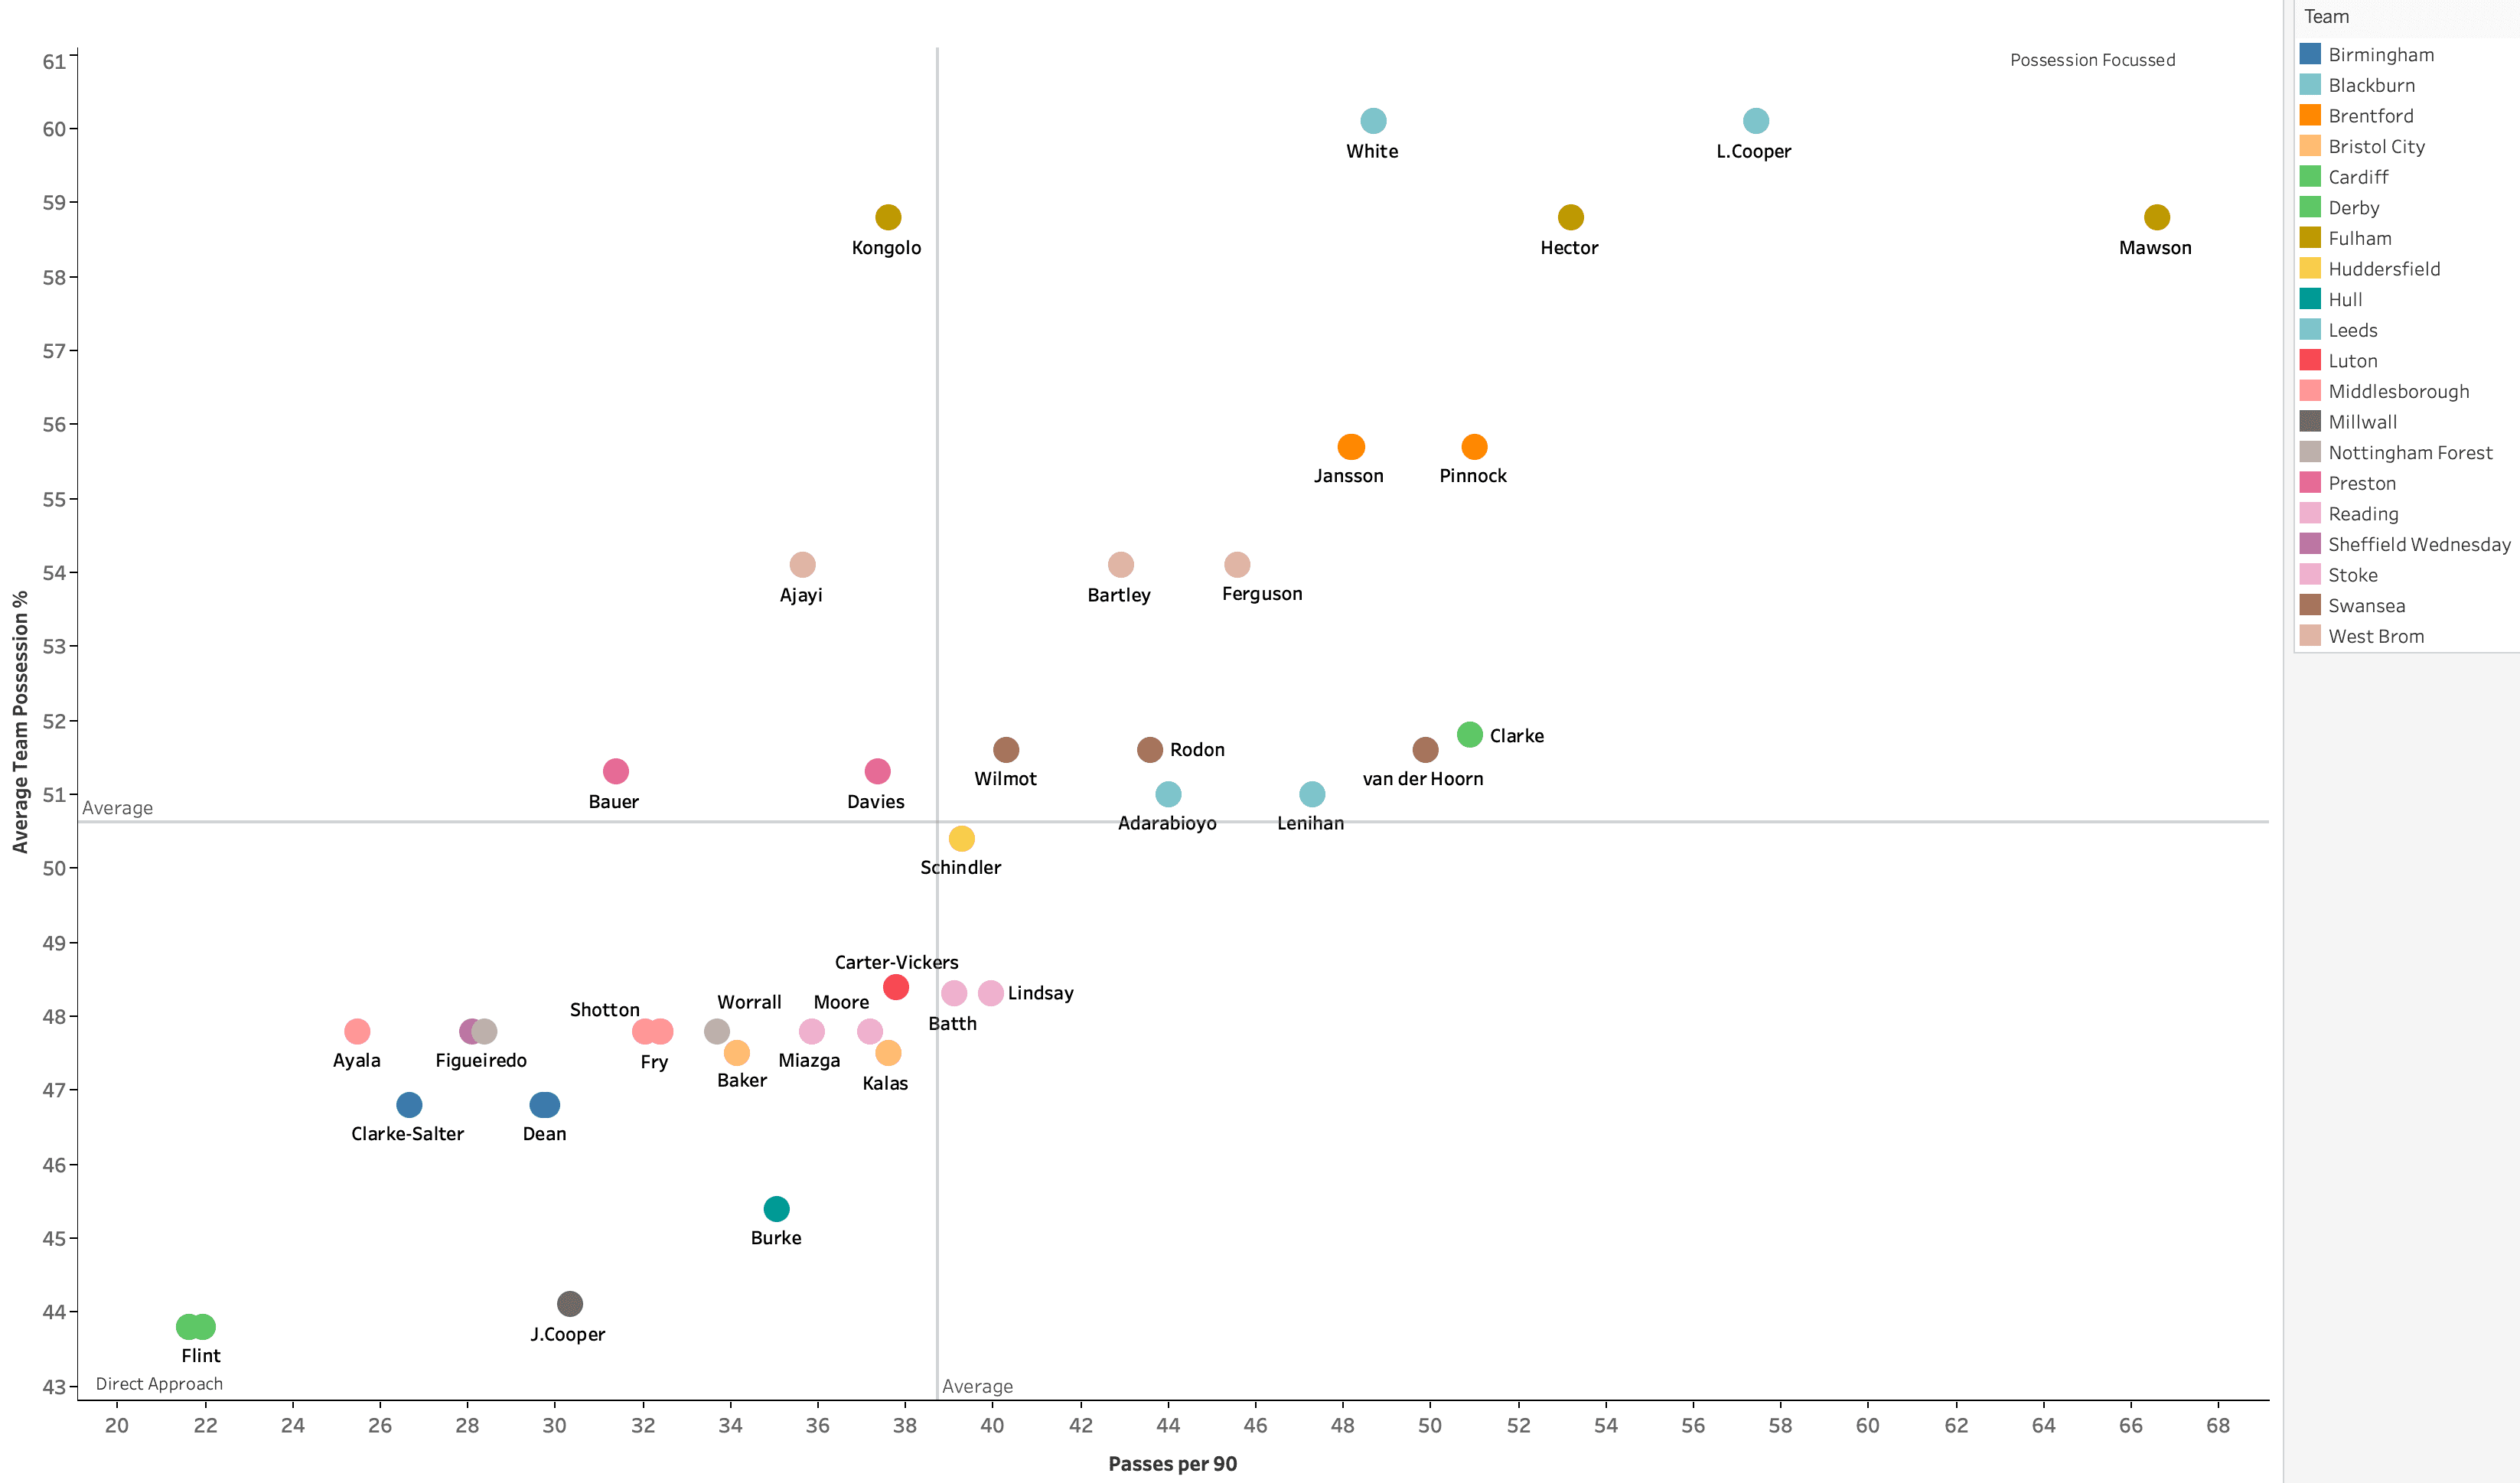
The graph above clearly demonstrates each team’s playing style. It cross-references each team’s average possession against the number of passes made by each centre-back on average per 90 minutes.
The graph produces interesting results as it separates each set of centre backs into their team colours. Unsurprisingly possession hungry sides such as Fulham, Brentford and Leeds centre-backs make up most of the top right quadrant, with their defenders heavily involved in possession cycles. An interesting quirk is the stark difference in averages between Terrance Kongolo and his defensive partners. The Dutch defender averages 16 fewer passes than Micheal Hector and nearly 30 less per 90 than Alfie Mawson; this indicates a propensity to rely on Kongolo’s partner as the ball-playing centre-back, avoiding the Dutchman in possession spells. I investigated further in the graph below.
At the opposite end are the centre-backs from teams defending from a low-block, preferring a direct approach over long spells of possession. This includes Aden Flint and Sean Morrison of Cardiff City, who each average just 21.93 and 21.63 passes per 90, which is nearly half the average. But that’s not to say these players are worse than their peers, the graph is to show whether these centre-backs are having the opportunity to pass, giving context to the tactical philosophy they are governed by. Whether these passes are played successfully or not is identified below.
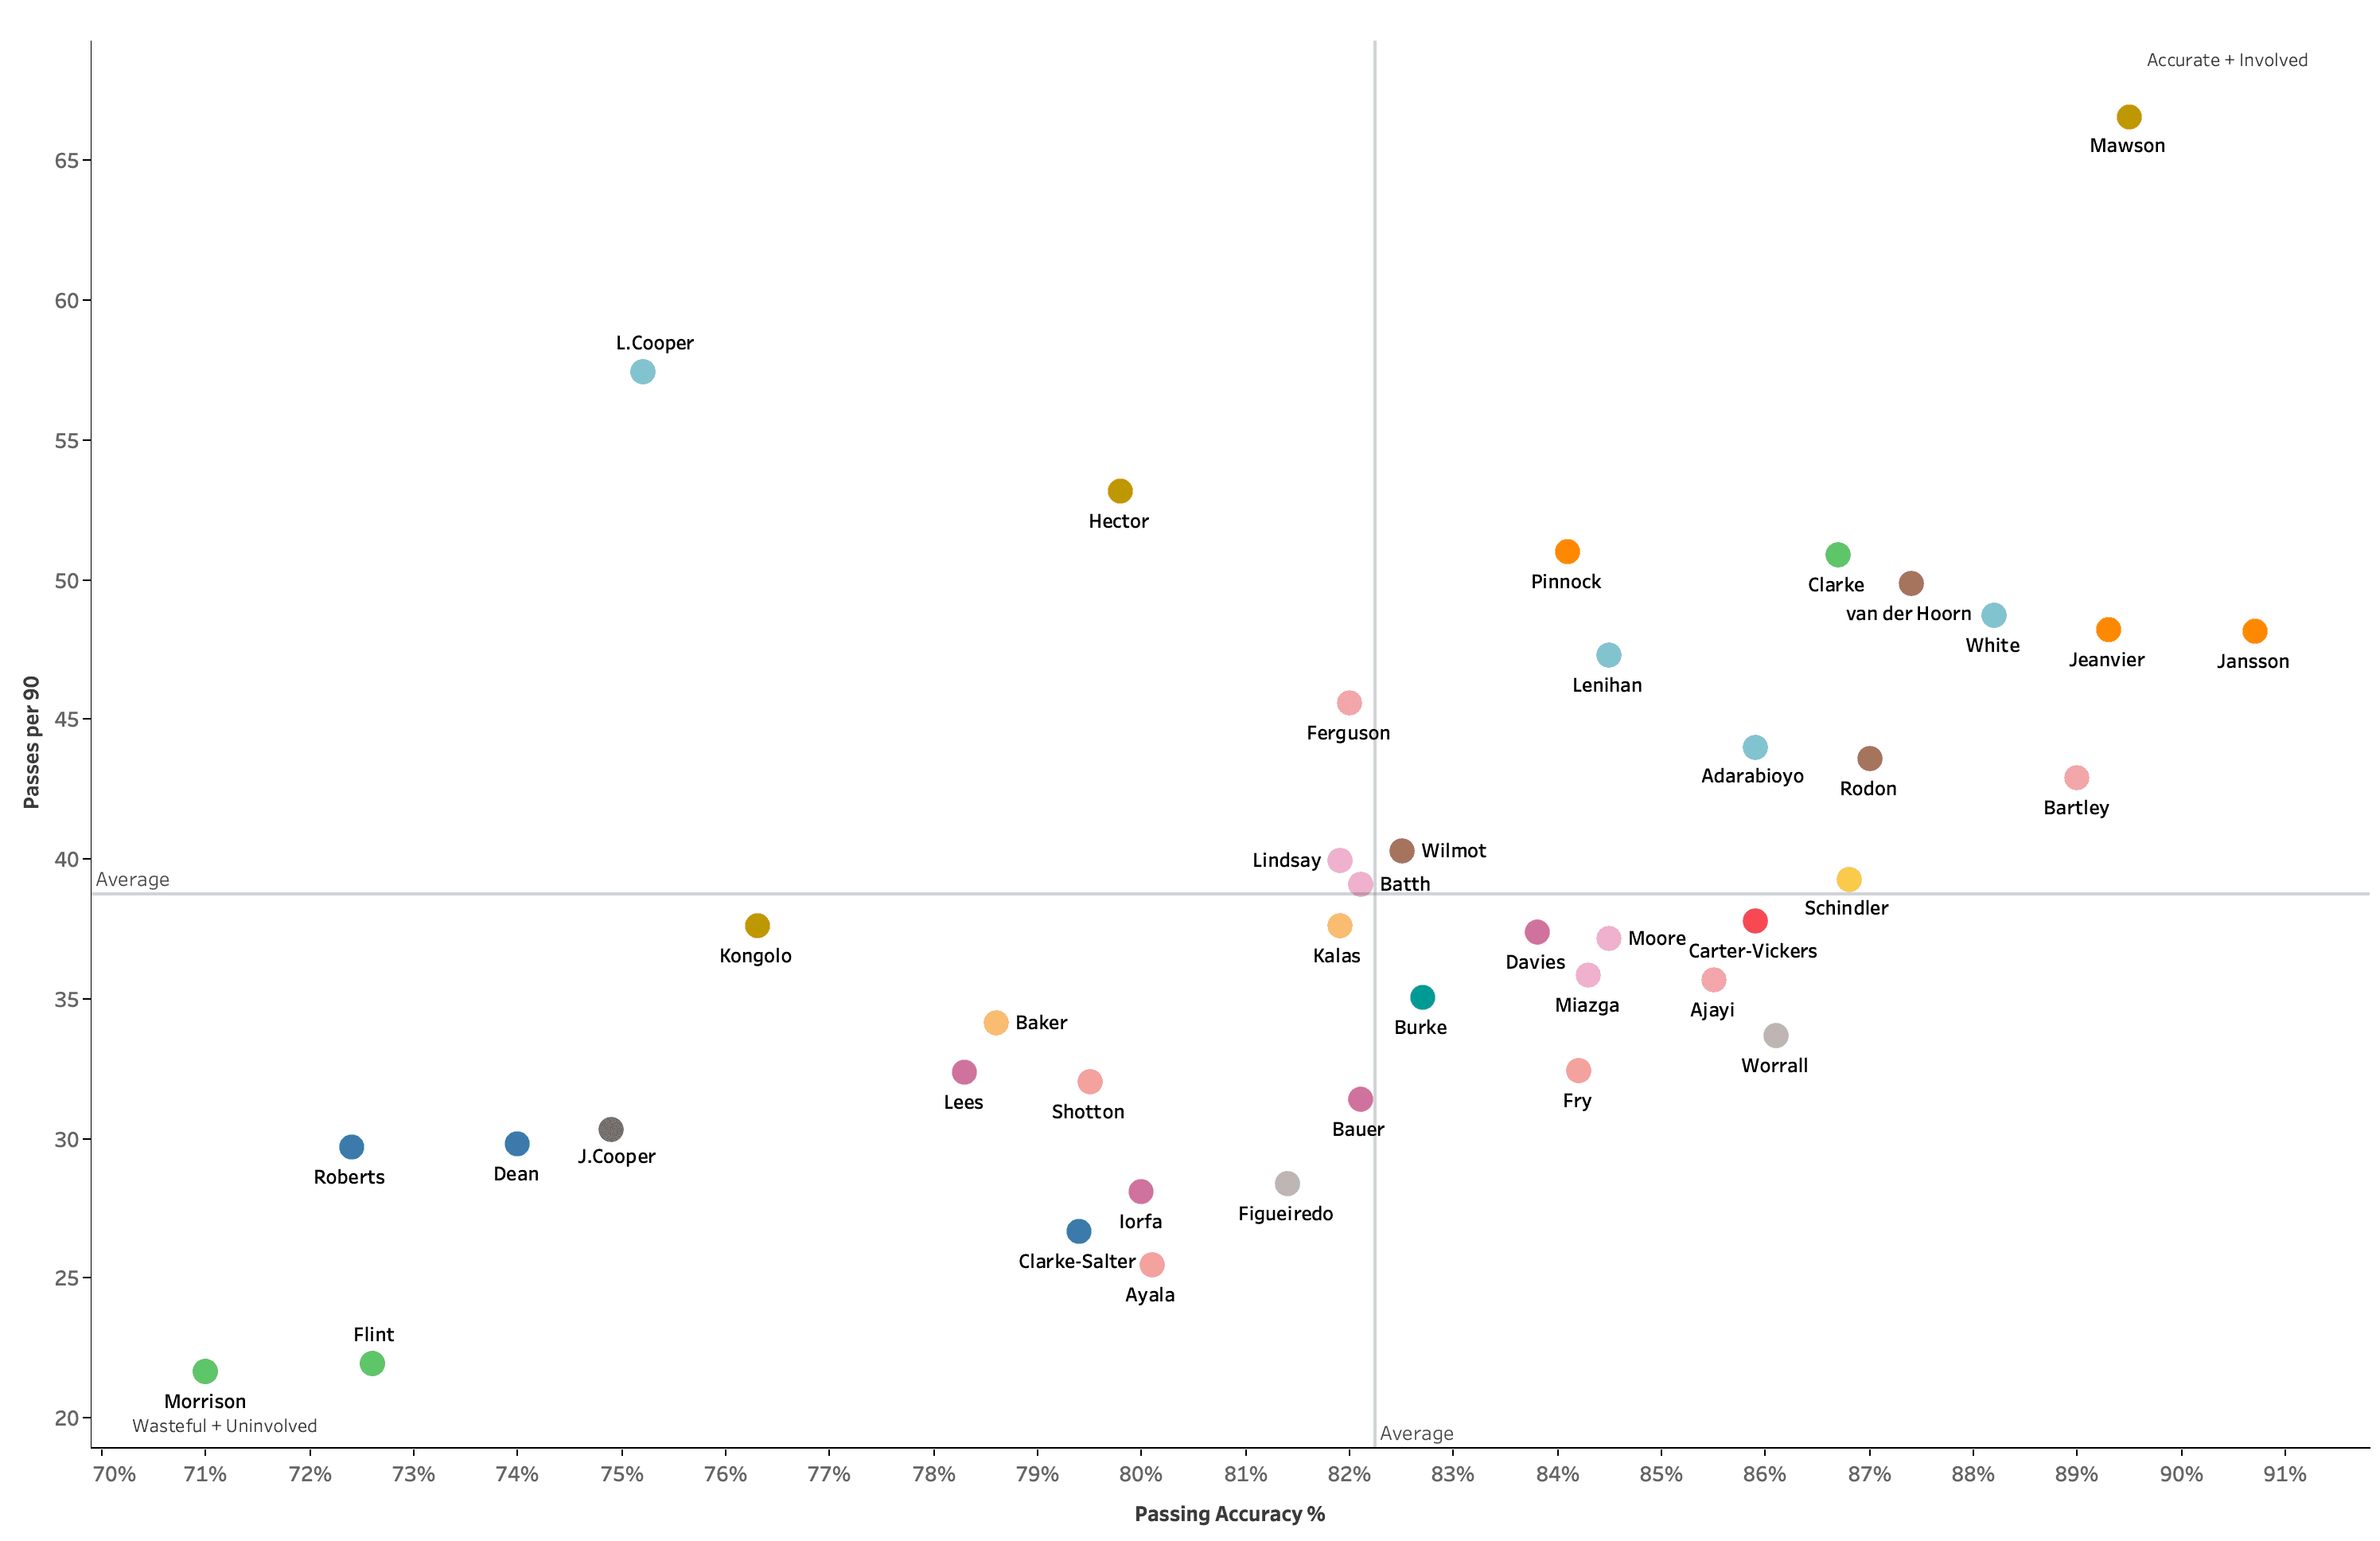
Following up on the investigation with Kongolo, the graph makes for interesting reading. The Dutchman’s statistics separate him from his defensive partners, in a negative way. Whilst Mawson and Hector remain towards the upper tier of the chart, Kongolo’s passing accuracy has slipped below the average to 76%, just 5% better than the Cardiff boys opting for longer low-percentage passes. This explains Fulham’s tactical approach to cut down the number of passes played by Kongolo as he has a tendency to be wasteful in possession, which is not in line with the style looking to be achieved at Craven Cottage. It does, however, present a pressing trigger opportunity for opponents, as with pressure on the ball we can see Kongolo has potential to give possession away.
Mawson continues to stand out. Even with his high pass frequency, he maintains an unrivalled passing accuracy of 90% compared to the number of passes he plays. This percentage is impressive, but might not tell the whole story: if every pass is played safely back to the goalkeeper then Mawson might not be as impressive as first thought.
Pontus Jansson of Brentford is worth a mention, with an accuracy of 91%, higher than any other player. But again, the riskiness of these passes is not projected from the graph. As a result, I dug deeper to see if these players really are posting Premier League standard statistics.
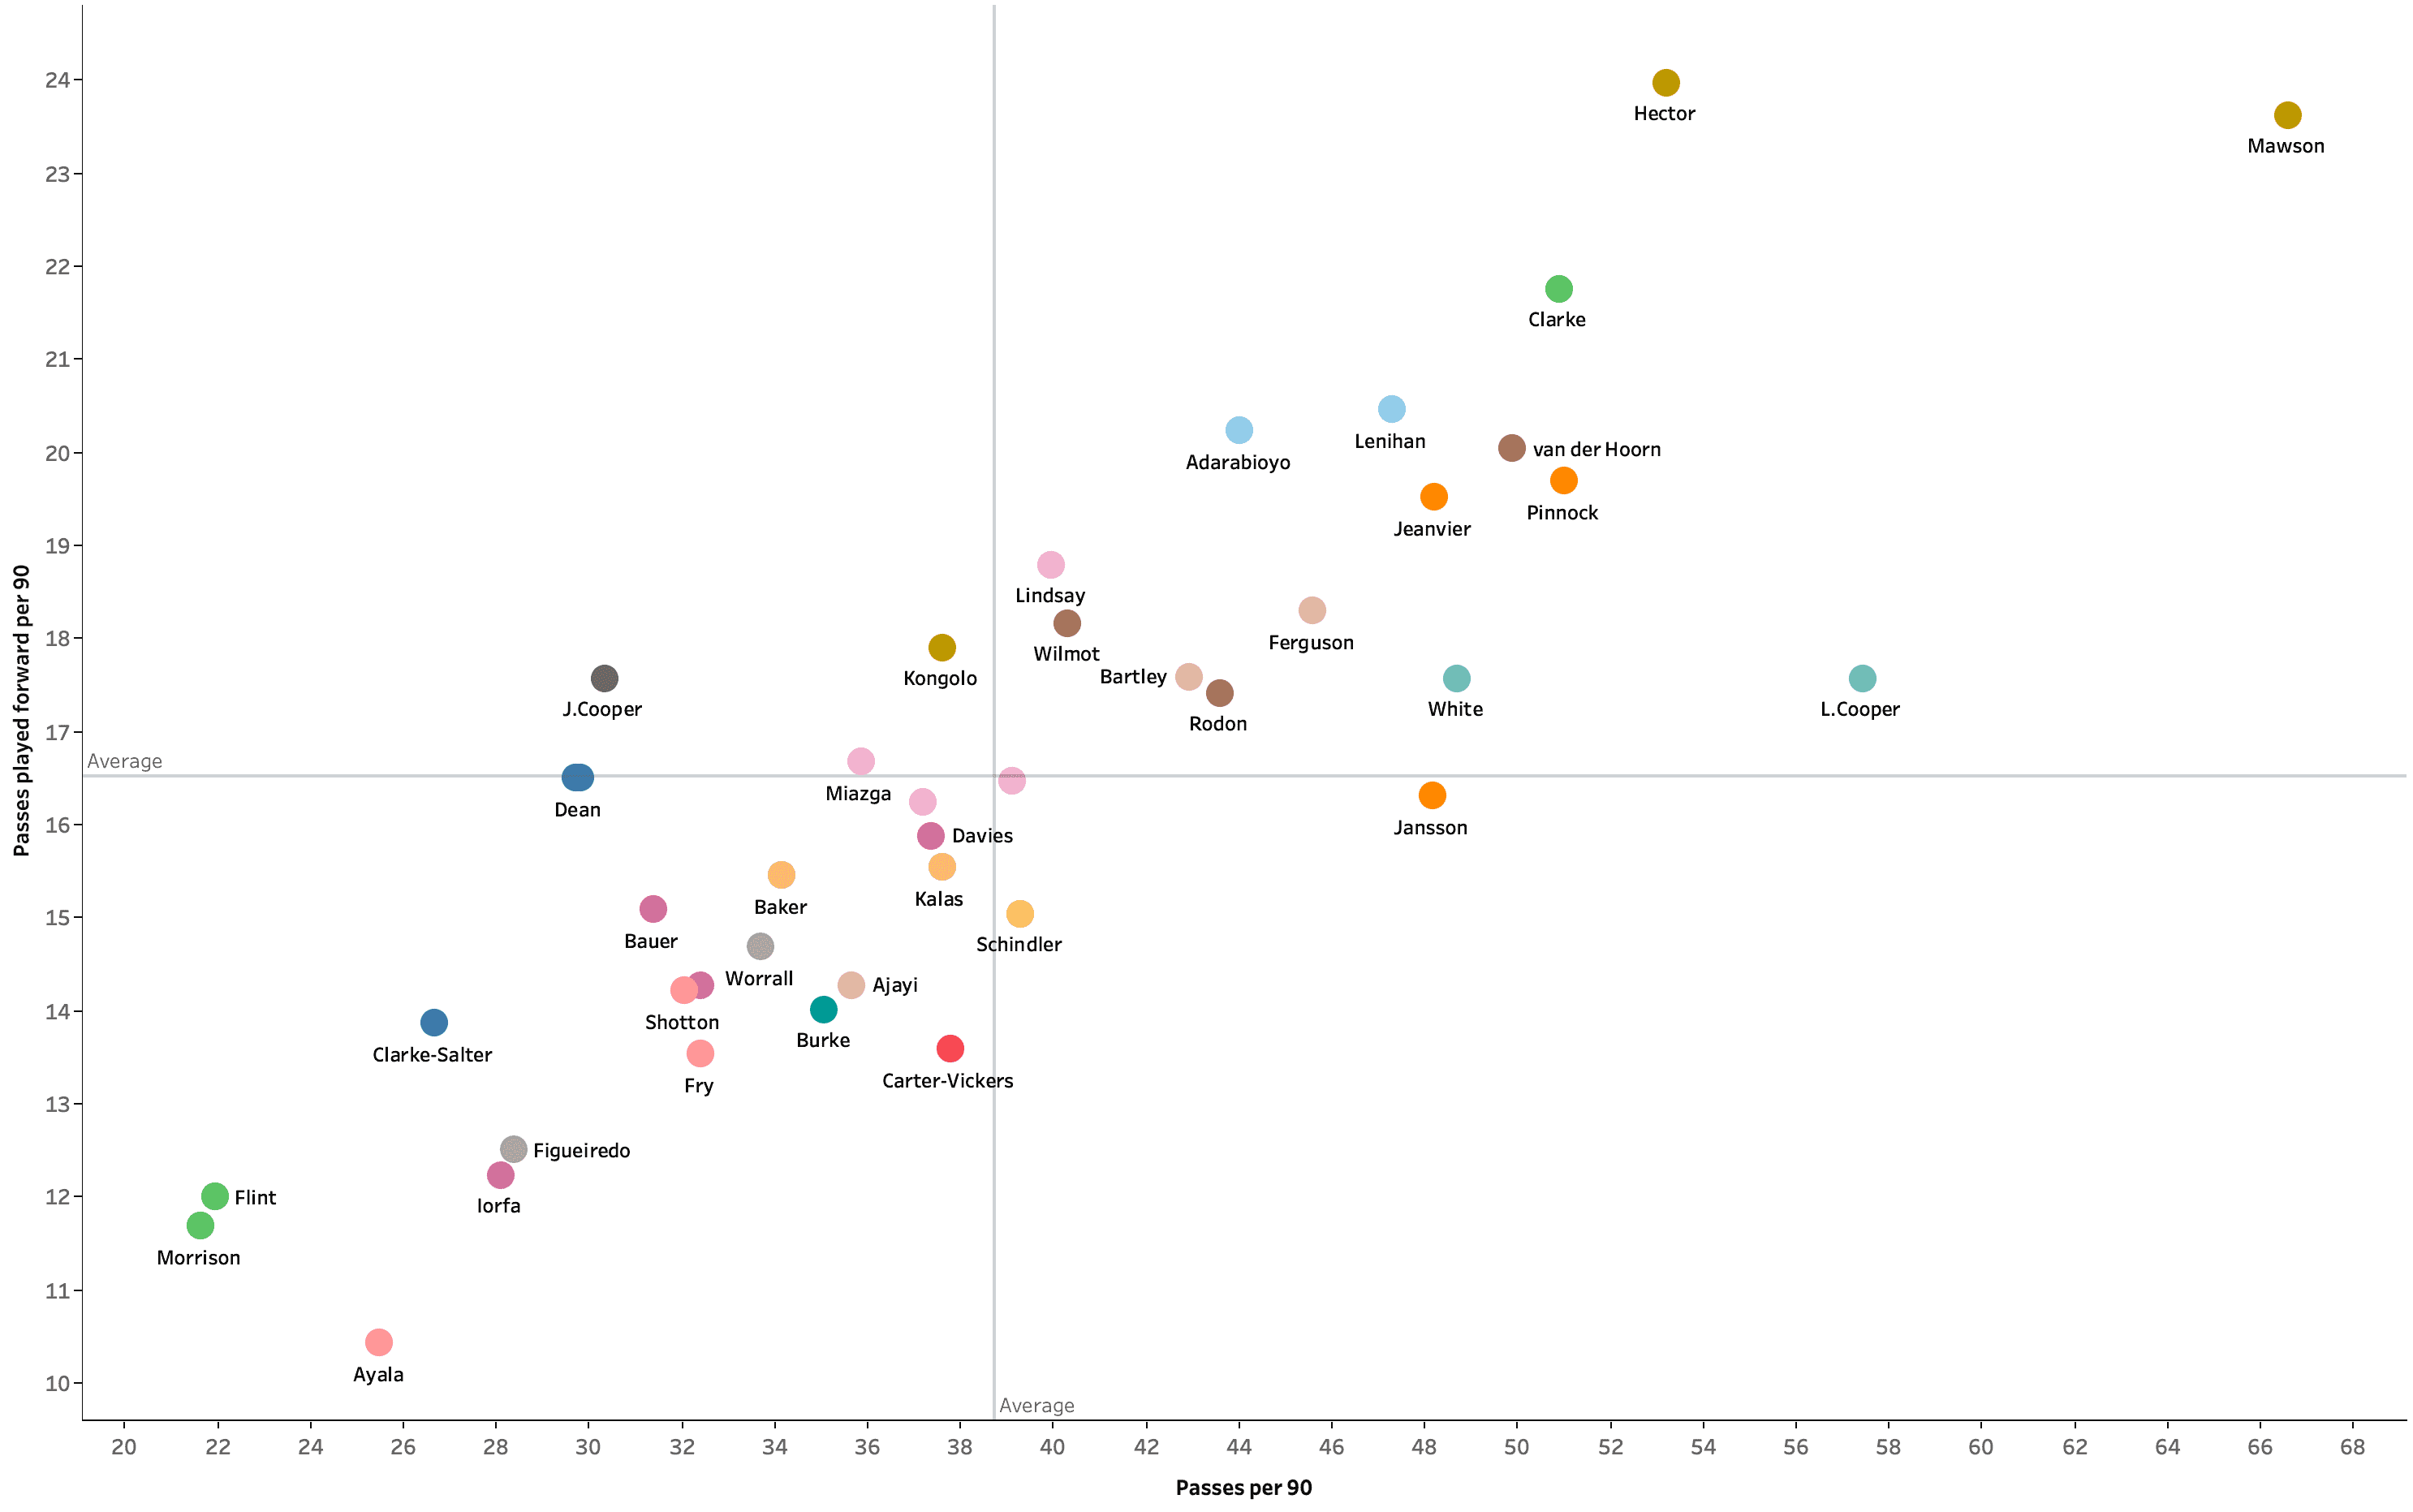
The graph above cross-references each centre-backs passes per 90 against their forward passes per 90. This has been tested to separate the defenders with high accuracy percentages into those who play forward progressively, and those who take the safe option. This cuts through the blanket percentage and demonstrates an in-game context, which we can use to see who really stands out.
The first victim of the graph is Jansson. We saw him posting the highest accuracy percentage in the last test, but he falls short in terms of progressive play. The Swede has fallen below the average of passes played forward, down to 16.31, which isn’t necessarily a bad thing; it just indicates a safety element to Jansson’s passing game. What the graph doesn’t show is the accuracy of the forward passes (below), so it may just be that the Brentford defender is slightly more selective with his passes into the dangerous and highly contested middle zone.
The standout centre-backs in this chart is the Blackburn pairing of Darragh Lenihan and Tosin Adarabioyo who average 20.46 and 20.24 forward passes per 90 respectively. Finding context in this statistic is key, as Blackburn only average 51% possession per match, which is not indicative of a possession focussed side, but also not of a direct long ball side either. Therefore, to have such a high percentage of passes played forward rouses a few questions. This, of course, could be long punts forward, so we need to measure the success rate of these passes forward. This is done below.
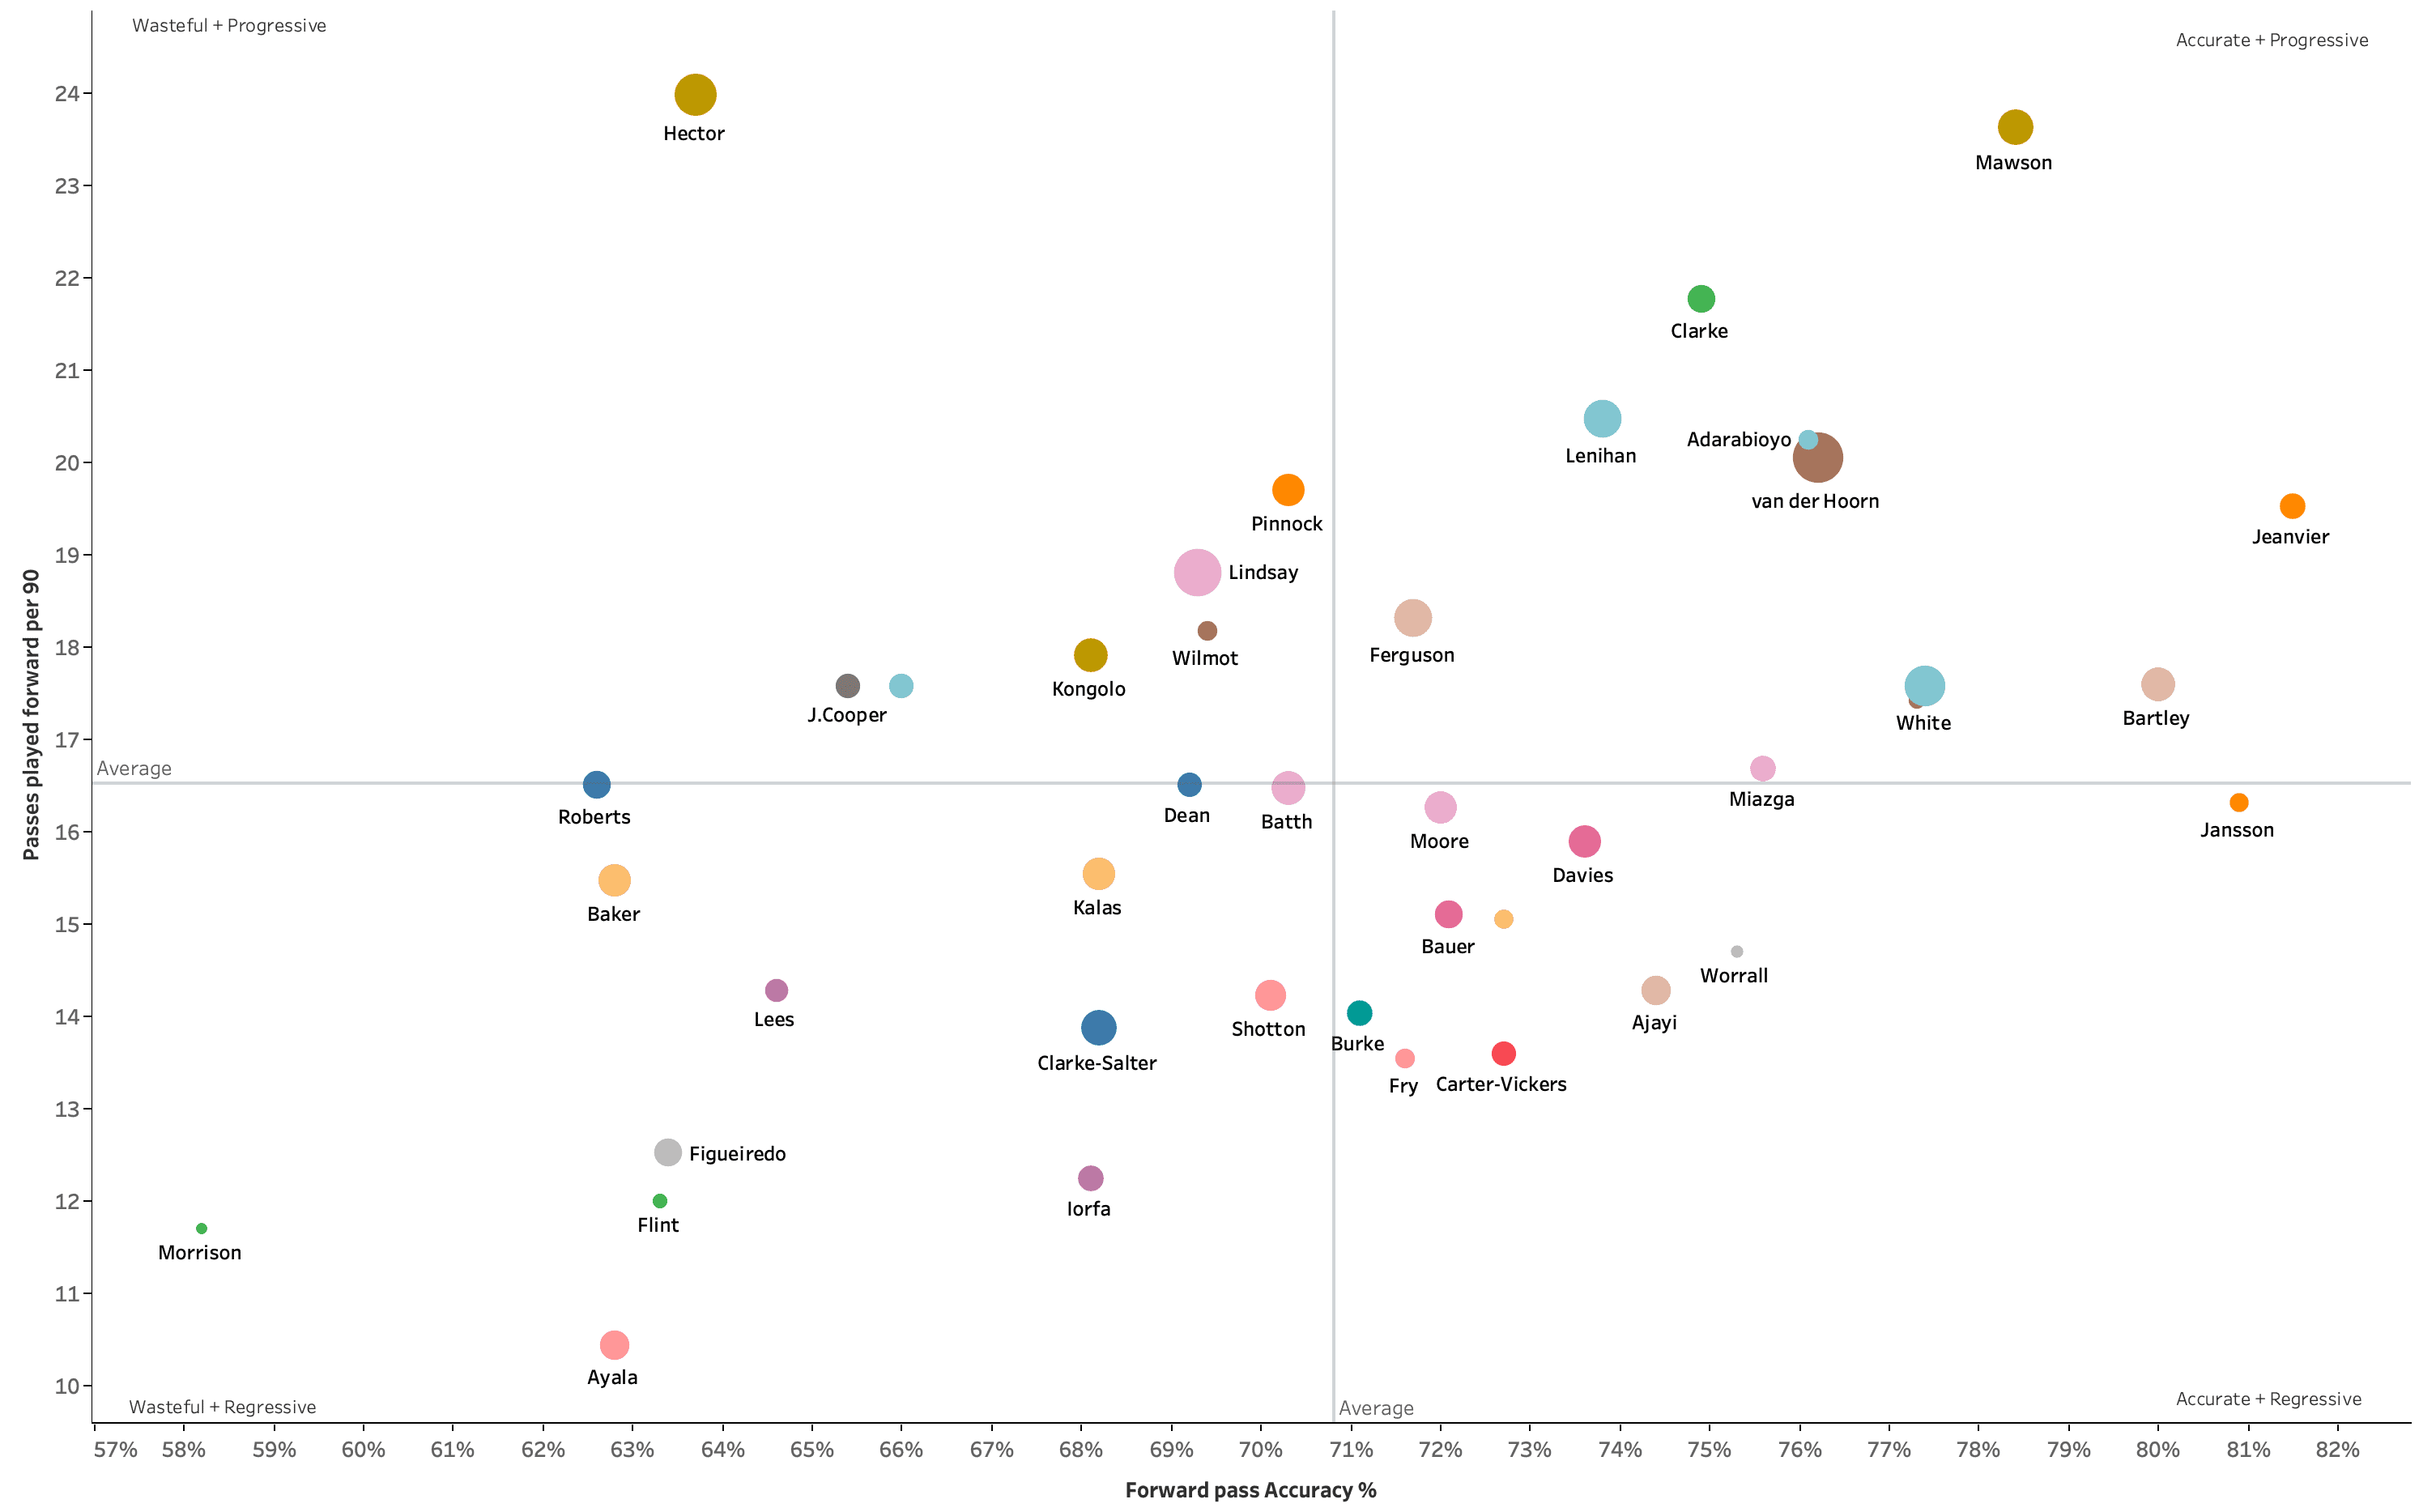
The next graph cross-references each centre-backs number of passes played forward with the accuracy percentage of these passes. As an added indication of penetration, the size of each marker shows the average number of through passes per 90. This graph has been created to test the accuracy of the passes forward, as quality is mandatory and preferred over quantity in the Premier League.
Our assumptions about Jansson were correct, his accuracy of 81% puts him second only behind his partner of Julian Jeanvier (82%). Rather than a weakness, it appears the slightly lower than average frequency of forward passes instead alludes to a selectivity and tactical awareness to make the right choice of pass by opting for perfect timing over hurriedness to move the ball forwards.
One leader of our tests, Hector, clearly falls short in this aspect. The Englishman’s forward pass accuracy has dropped below the average to 64%, demonstrating a riskiness to his passing that often leads to turnovers in possession. This riskiness, however, has paid dividends with him averaging 0.58 through passes per 90. Again, it all comes down to context and what a prospective side is looking for. This test has separated the nuances in the styles of the defenders, particularly when it comes to playing forwards.
One under the radar player, who is the most penetrative passer in the test is Mike van der Hoorn. The Dutchman’s passing statistics are strong the whole way through, however, in this test he clearly excels, averaging 0.85 through balls per 90, which for a centre-back is outstanding. Referring back through the previous tests, van der Hoorn has never been below the passing averages set, however, the Swansea centre-back’s weaknesses become apparent in chart one.
With a defensive duel and aerial duel success rate of 65% and 60% respectively, van der Hoorn is not as reliable as many of his peers when it comes to the actual defending. This may not be a problem for some sides looking for the outside centre-back in a back three, where passing is encouraged and supported by defensive cover. Something to consider particularly when he’s posting such strong passing numbers.
Trust
So now we’ve looked at the defensive and passing aspects of the centre-backs, the front runners are clear. Mawson and Jansson lead the way, with Cooper, van der Hoorn and Hector posting great numbers in some aspects, but having flaws identified in others. Remember this doesn’t necessarily rule them out depending on the philosophy in which they play. It does, however, limit them to certain tactical systems.
The final test is one of the most important, and one that if players are not strong, their careers will not last long in the Premier League. This test is reliability.
The positional master Xabi Alonso once said ‘if I have to make a slide tackle, I have already made a mistake’. Following the Spaniard’s wisdom, rather than use slide tackles as a measure of a defenders ability, as most analysts do, I am using slide tackles as an indication of being out of position. Therefore, the higher frequency of slide tackles shows how many times the defender has been forced to make a last-ditch tackle due to positioning errors. I have cross-referenced this metric with the number of losses of possession in the defensive third to create a graph showing how reliable a defender is, both in and out of possession. Let’s take a look.
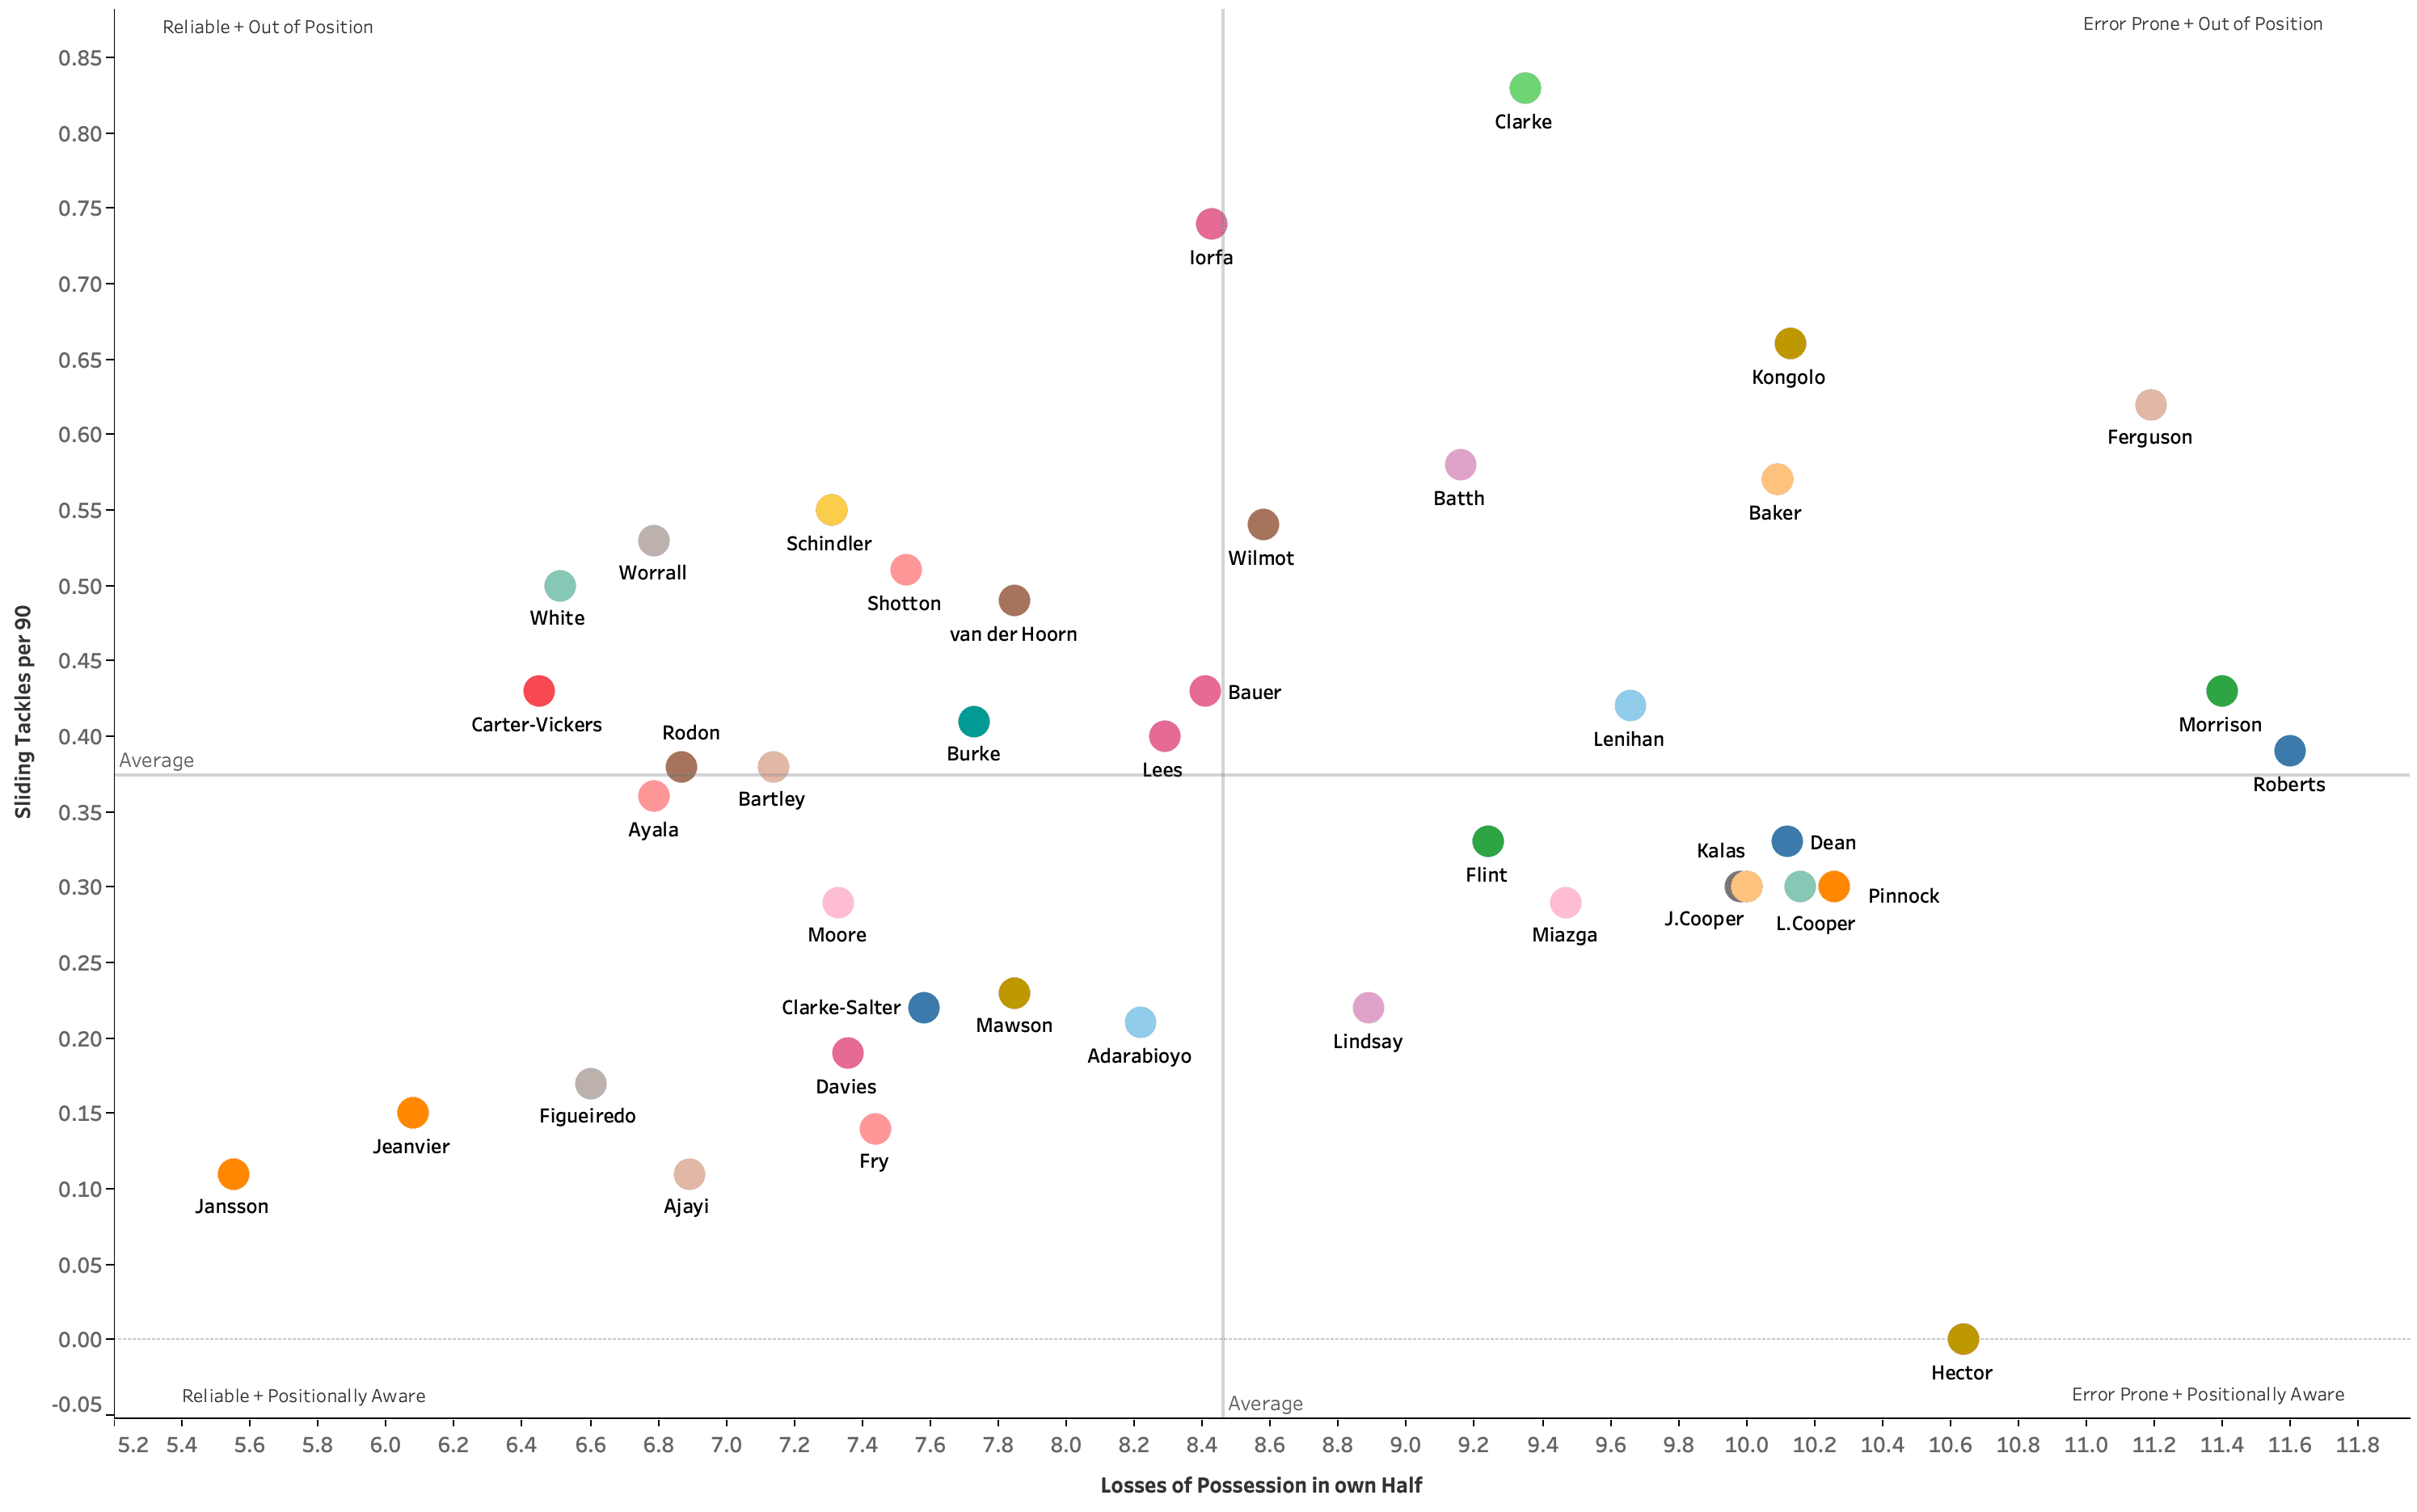
This time the front runners sit in the bottom left as these are negative metrics, so the fewer the better. Jansson leads the way with just 0.11 slide tackles per 90 and just 5.55 losses per 90. This level of reliability is paramount to being a successful defender in the Premier League – one of the most competitive leagues in the world where gifting possession to the opposition and being caught out of position is simply unacceptable.
Mawson’s numbers aren’t as strong but still above the averages set by his peers. With an average of 7.85 losses of possession in his own half per 90, however, this is a statistic that must be improved by the 26-year old who will likely be punished by a higher standard of opponent in the league above.
So have we got a winner?
Well, yes and no. Jansson has certainly survived the tests and consistently posted good numbers defensively and with the ball at his feet. There are however other talented players in the league who may be better suited to one team’s style of play and actually be a better fit than just picking the player with the strongest numbers.
Beyond that, we must also remember that the statistics tell a story but not the whole one. Behind the numbers, there is a human being driven by emotion and other intangibles that percentages and metrics will never uncover. The trick is understanding the context of the numbers and finding a balance between statistics and real life, as in isolation neither are perfect, but used symbiotically, modern scouting can thrive.




Comments