The first touch is perfect. Time starts to move in slow motion as the ball sits up in a stately manner, waiting to be hit. A sea of onrushing defenders with desperation etched across their faces begin their futile charge to block the impending shot. The crowd are on their feet, a chorus of ‘shoot’ bellows throughout the stadium in anticipation. The moment is set.
These are the moments we fantasize about. The moments we attempt to reenact in playgrounds to parks to the muddy Sunday leagues. But what if instead of adhering to the moment and watching a volley from range swerve into the top corner, another touch is taken, and possession is kept. Boring? Yes. Statistically the correct decision? Well, sadly for the romantic in me, also yes.
In this tactical analysis, we look at how the rise in football data analysis is changing the game we know and love. We’ll dive into the mathematical theory of how xG is leading to better on-field decision making which is driving better results and ultimately leading to the death of the long shot.
The Basics
Expected goals or as it’s more commonly referred, xG is a simple yet powerful metric whose popularity has grown steadily over the last five years. Companies such as Opta and Wyscout have furiously analysed tens of thousands of matches, meticulously dissecting every shot at goal. Multiple factors for each shot are taken into account, including whether it was on a player’s weak foot, the number of defenders in the vicinity and the range/angle of the shot taken. This is all used to generate a single figure which displays an accurate percentage for each individual shot taken: Expected Goals.
This percentage displays the chance that each shot in its own individual situation has on finding the back of the net. So for example, a penalty has around 0.76 xG, which equates to a 76% chance of success. On the other hand, a shot from a player’s weaker foot, on an angle, with a defender in the way can have an xG value of below 0.05, which translates to just a 5% chance.
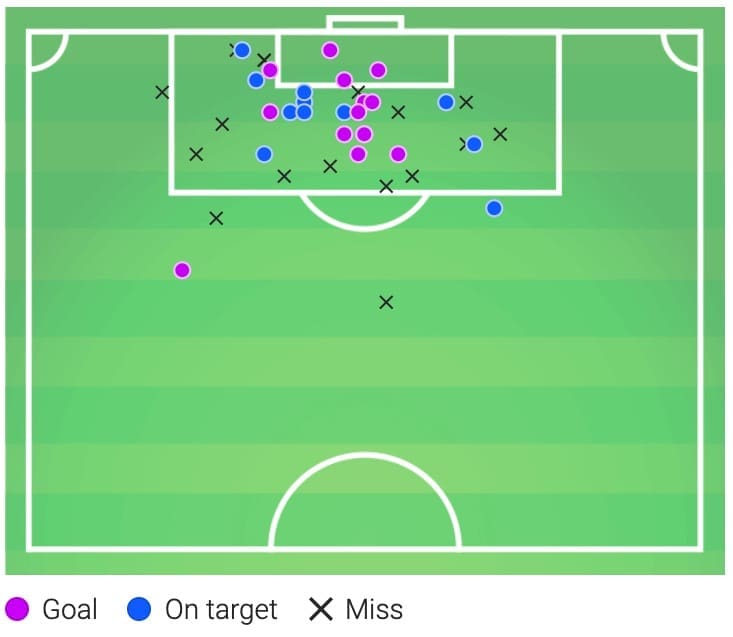
Above is an xG map of Jamie Vardy’s shots, taken from the current 2019/20 Premier League season. We can see the pink dots are the shots where Vardy managed to score. These – as you’d expect – are closer to the goal, as logically, the percentage chance of scoring gets higher the closer to the goal you shoot. It’s no surprise then that the number of pink dots cluster closer and more centrally to the goal, as this is statistically the best place to score from.

Above shows one of Vardy’s goals that he scored against Arsenal. The shot which led to the goal carried an xG of 0.35. Considering the factors mentioned above, it’s clear to see why the shot carried a high xG rating. Firstly, it’s central and inside the penalty, both positives for a striker looking to slot one home. Secondly, the ball is being hit on Vardy’s stronger foot, under little pressure from the Arsenal defender – sorry Gunners fans. Notice that the keeper is struggling to get back across to cover the far post, making the success chance higher for the England international.
Conversely from the xG map above, notice the one dot outside of the area, which Vardy scored against Bournemouth, this attempt carried a percentage chance of just 8% or 0.08 xG.
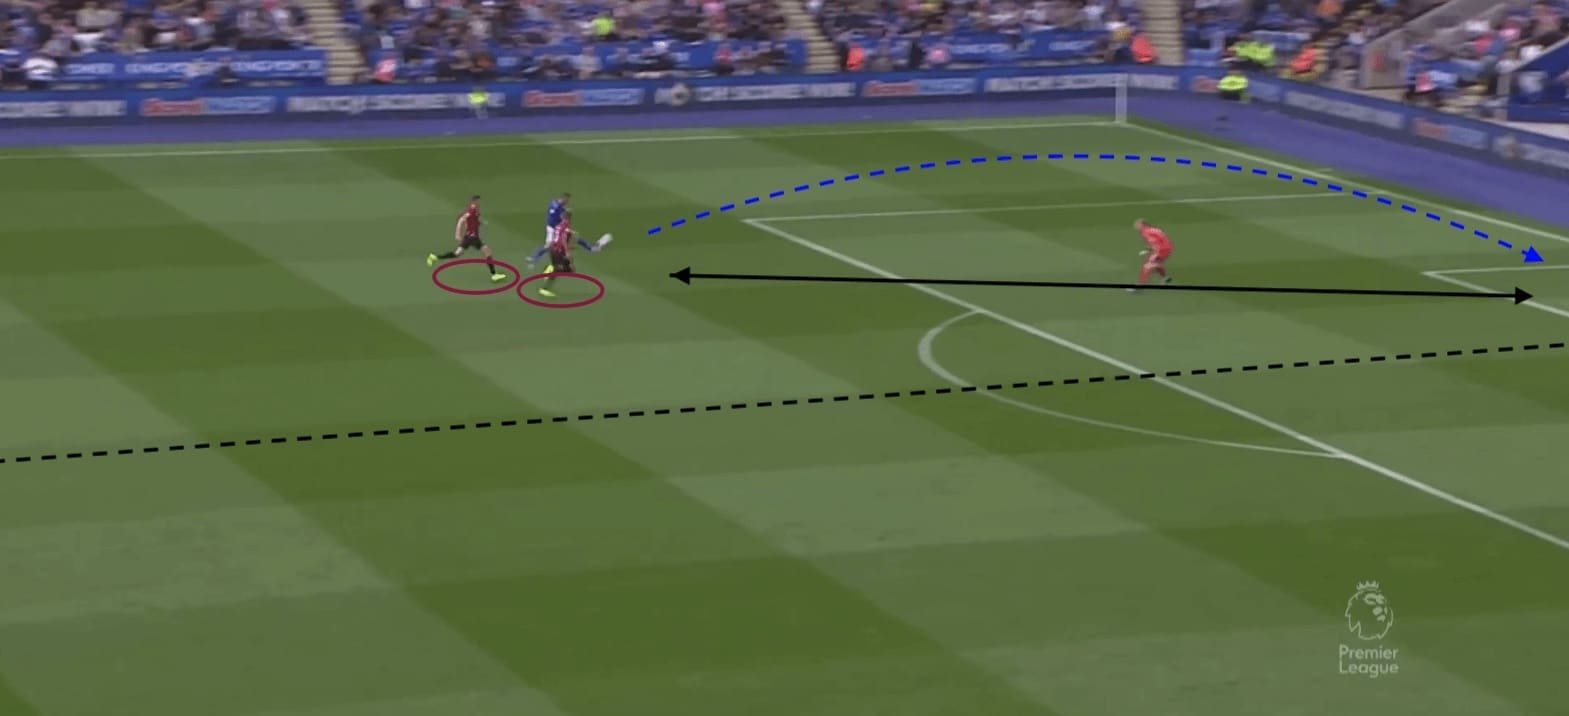
This is a completely different scenario. Vardy has taken this shot from much further out, with two defenders putting him under pressure. The ball is also bouncing which will affect the percentage chance of scoring. We can also see how Vardy is not taking the attempt from a central position, being further out to the left on the angle, again affecting the xG of the shot.
Vardy puts both chances in the net but as we now understand, the chance of success for each shot was considerably different.
So why’s this important?
Expected goals are a revolutionary metric as they give a true reflection of who ‘deserved’ to win a game of football more accurately than any other statistic. Where the more easily digestible stats such as possession are frequently used to reflect proceedings, expected goals offers a clear picture of the quality of chances created by each side. This qualitative feedback the xG figure provides makes it much easier to understand the true performance of a team.
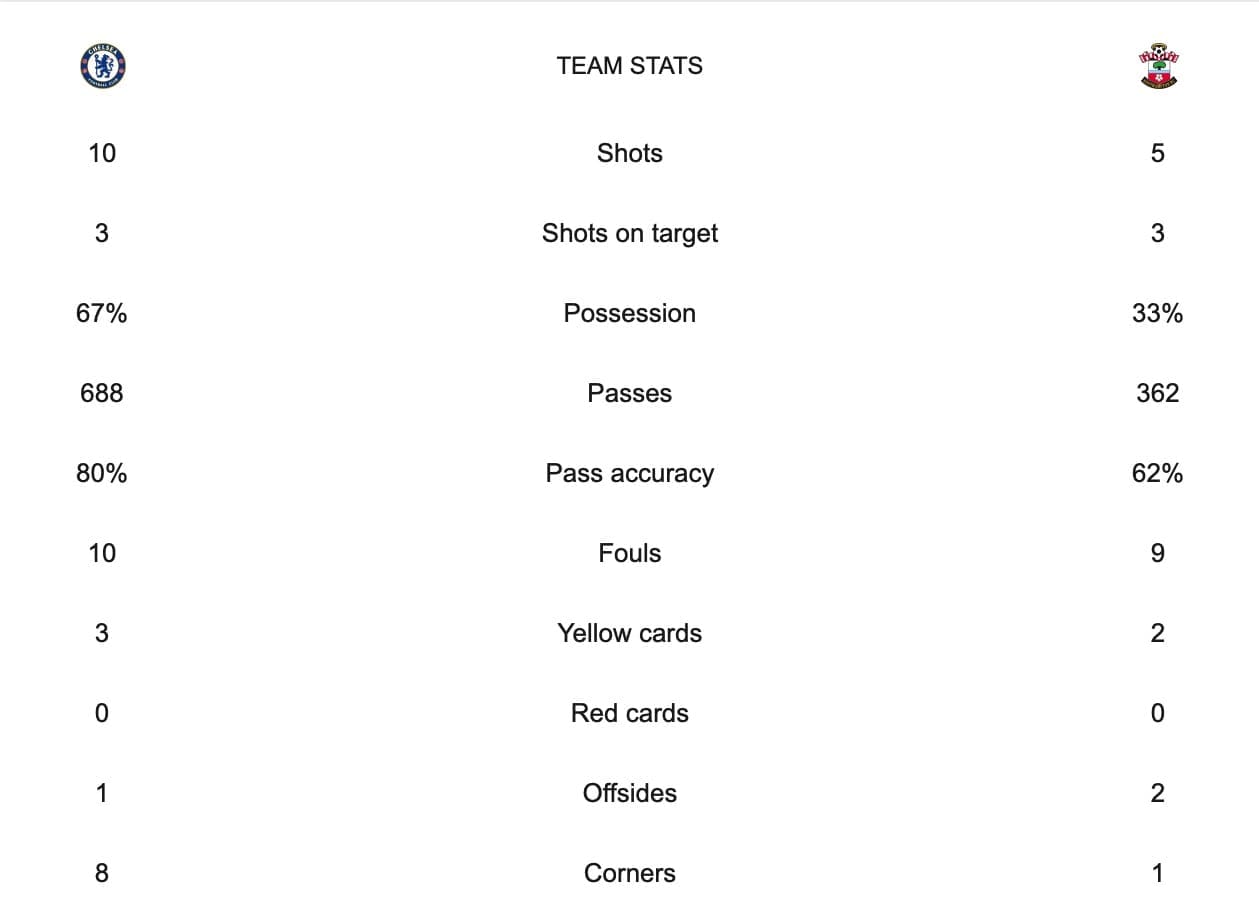
Above are the stats taken from a game in the Premier League this season. Based on these stats – which are the most commonly produced by broadcasters – you would expect that Chelsea would have won this game. More possession, more shots, better pass accuracy, this is a game Chelsea deserved to win, right? Well, not exactly.
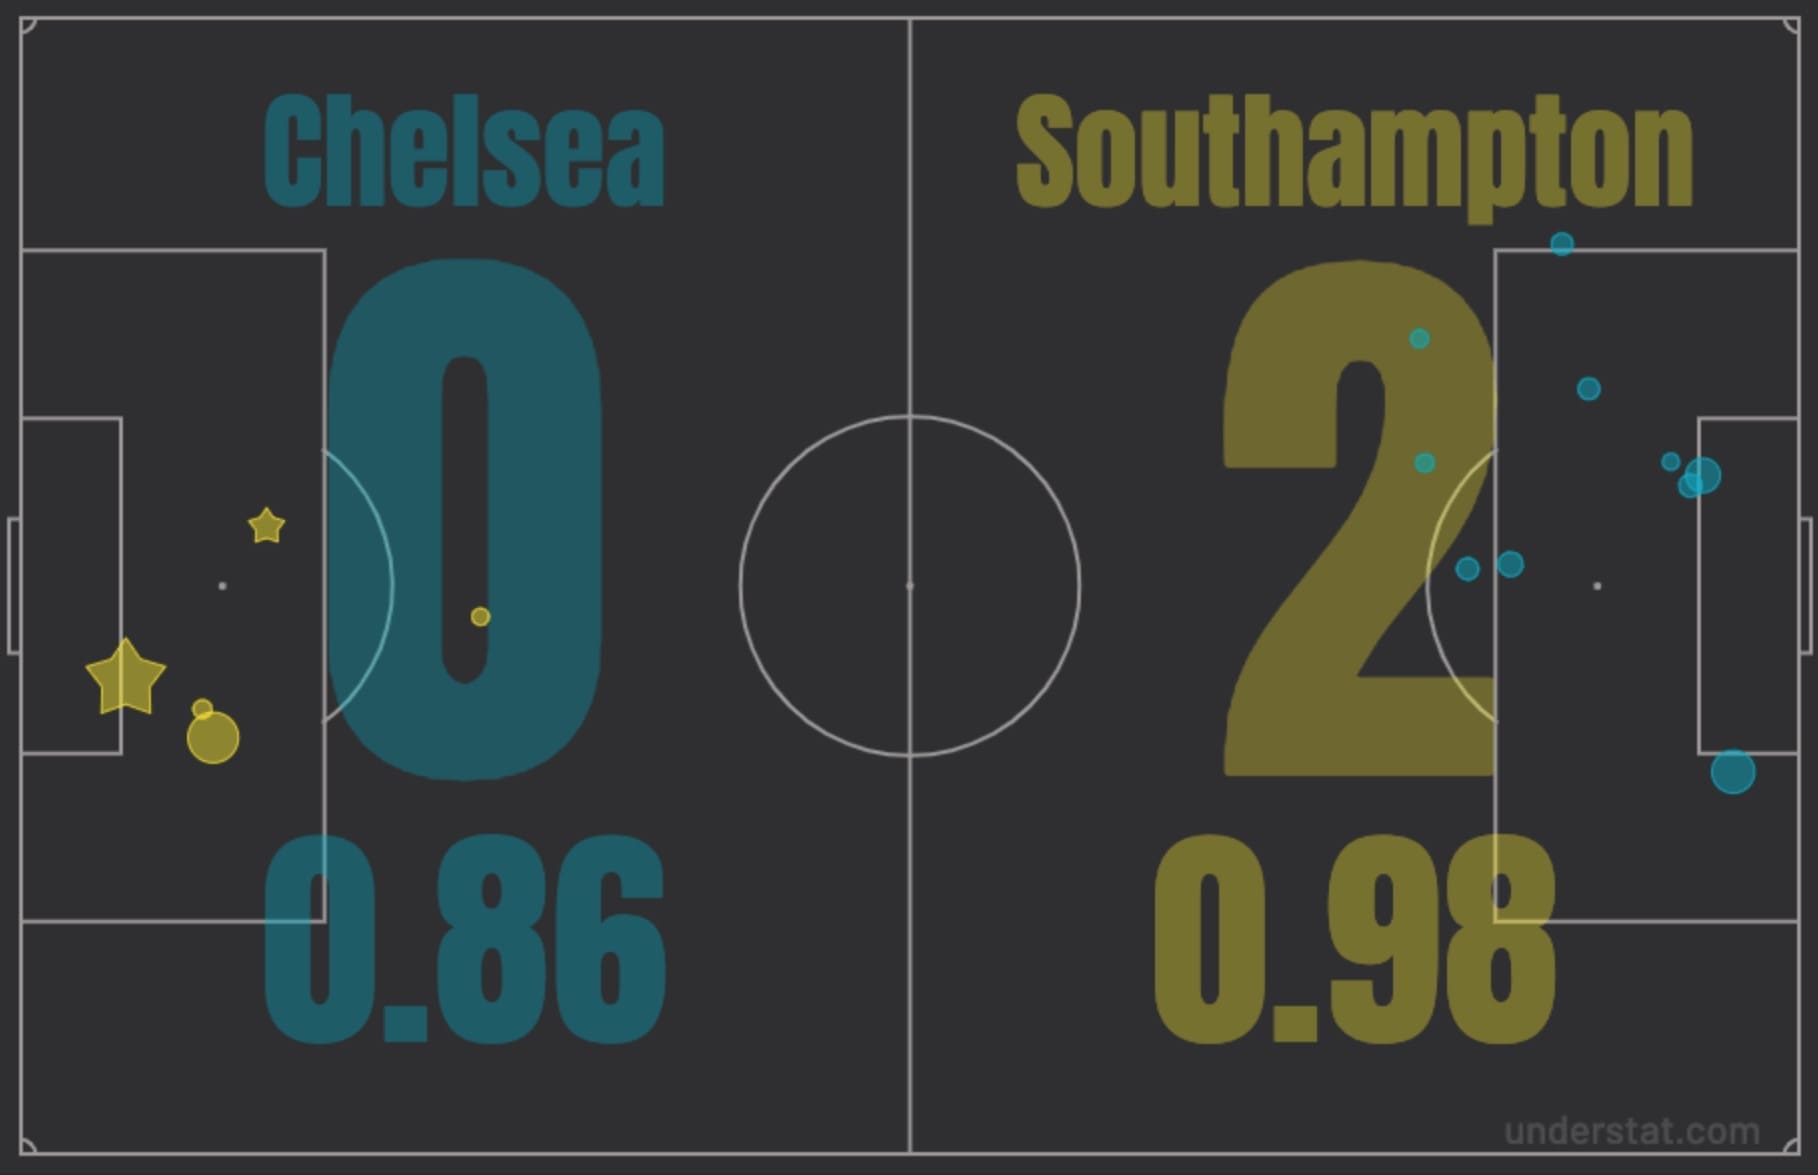
The Saints ended up taking a 2-0 victory on the day, a result which wasn’t undeserved. As you can see above from the xG measurements, despite Chelsea dominating in the descriptive statistics, they actually didn’t create many quality chances. A lot of their shots came from long distances which as mentioned, carry a lower xG and as a result, their best chance achieved an xG of just 0.27.
The expected goals metric cuts through the surface descriptions which mislead fans and pundits into thinking a particular team deserved to win. In actual fact, Southampton created higher quality chances and left Stamford Bridge with a well-deserved three points.
The long-shot conundrum
So, I know as intelligent readers you’re thinking so what if both sides achieve the same xG in a match, does it mean they were identically as good, and therefore should be expected to draw if the game were to be replayed an infinite amount of times? It’s a great question, and this is the crux of the article. It’s better for a team to create 1.0 xG in a match from just two high-quality shots (each worth 0.5 xG) than it is for a team to create 1.0 xG from five shots each worth 0.2 xG. The reason for this can be explained through mathematics.
The first stage of understanding why this happens to be is to understand standard deviation. This sounds more complicated than it is. Standard deviation essentially means skew. How far from the average a statistical point is likely to be. Take the example below.
A footballer runs five laps of the pitch and his times are as follows:
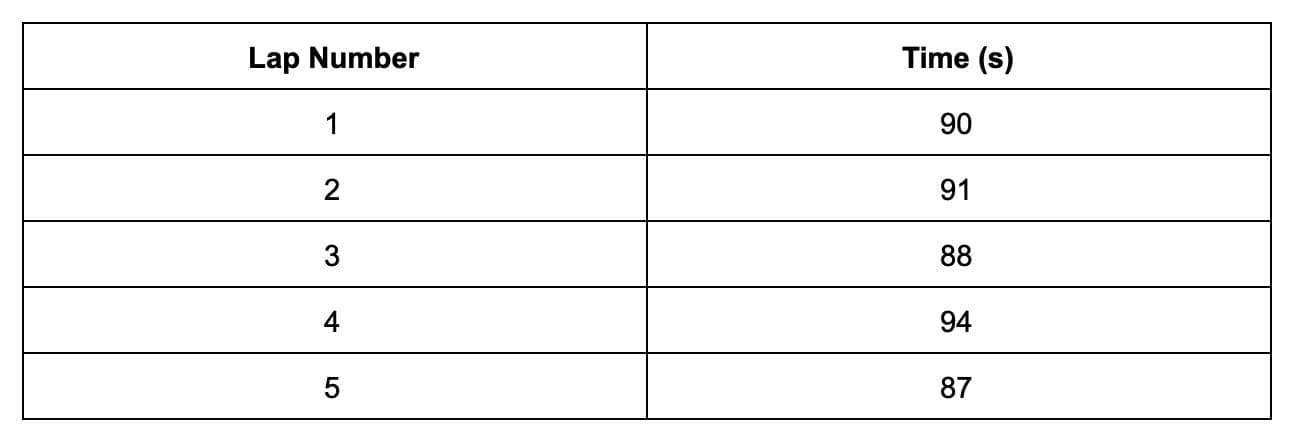
The first step is to find the mean (average) lap time of the footballer, as follows:
90 + 91 + 88 + 94 + 87 = 450 seconds
450 seconds / 5 laps = 90 seconds
Therefore, the footballer has an average lap time of 90 seconds, based on the five recorded times. To find the standard deviation we must then find how far off each individual lap time is from the mean. This must then be squared to remove negative numbers from the equation. Continuing from above, this is as follows.
Mean = 90 Seconds
(90-90)² = 0² = 0
(91-90)² = 1² = 1
(88-90)² = -2² = 4
(94-90)² = 4² = 16
(87-90)² = -3² = 9
The next stage is to find the average of these calculated figures, which then must be square-rooted to give the final standard deviation figure.
0 + 1 + 4 + 16 + 9 = 30
30 / 5 = 6
√6 = 2.45
After rounding, the standard deviation of this footballer’s lap times is ±2.45 seconds. This shows how far from the average of 90 seconds, each lap is likely to drift. The higher the standard deviation, the higher a lap time is likely to spread from the average, demonstrating lower consistency in performance.
Don’t buy a raffle ticket
Now we’ve got our heads around the meaning of standard deviation and how it displays the range of variance expected from a set of figures, we can now apply this to our football example.
As mentioned, Team Tap-ins and Team Belters have both achieved an xG of 1.0. This, however, was achieved through differing tactics. Team Tap-ins only wanted to shoot from within the six-yard box. This is much harder to do, so they only managed to do it twice. As they are such good goal-scoring opportunities, both of Team Tap-in’s shots had an xG value of 0.5.
Team Belters, on the other hand, were keen followers of the mantra ‘if you don’t buy a ticket, you’ll never win the raffle’. As such, they opted to shoot from further out, and therefore managed a few more shots – five in total. However, as their chances were of lower quality, they achieved just 0.2 xG each. This is summarised below.
Team Tap-in: 0.5 + 0.5 = 1 xG
Team Belter: 0.2 + 0.2 + 0.2 + 0.2 + 0.2 = 1 xG
As we know, each xG relates to a percentage, so each shot taken by both sides carries a percentage chance (however small) of finding the net. As a result, the final score between the Tap-ins and the Belters can range anywhere from 0-0 to 2-5 and any result in between.
Obviously, the chance of Team Tap-in scoring both their chances is much higher (25%) than the likelihood of Team Belter scoring all five of theirs (0.032%). Regardless of the likelihood, there is still a probability of such an event occurring, and this is where the variance plays a vital role.
By finding the standard deviation of the two data-sets, using the methods discussed in the previous section, we get ±0.5 standard deviation for Team Tap-In and ±0.66 for Team Belters.
As you’d expect, the team shooting from further out will experience more variance due to each of their shots holding a smaller xG rating. Knowing this we can plug the numbers into a calculator to run the game scenario an infinite amount of times. Doing this will give a fair representation of how the probabilities interact and give a chance for variance to affect proceedings.
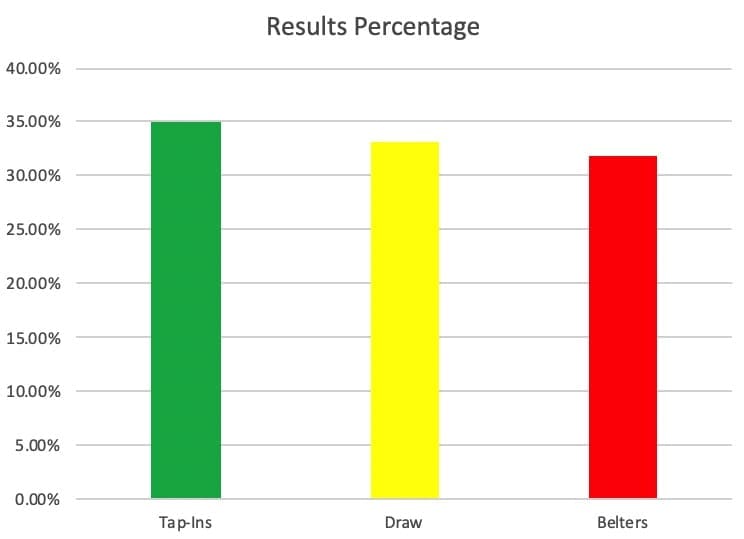
Above we can see the results. As expected, they are not equal, despite both teams achieving the same expected goals figure by the end of the match (1xG). Because of the larger variance, Team Belters actually only win 31.92% of the matches, compared to team Tap-Ins who win 35% of the games, the remaining games (33.08%) are drawn. The ability to create better opportunities, i.e. from a closer distance with a higher chance of success pays dividends in the long-run.
This example has used 0.2 xG for ease, but consider then the larger effect variance would play on a team taking shots with an xG of say 0.08, as we saw with Vardy’s long-range strike above. It may be just a coincidence that Man City’s average shot distance is now at 16.60 metres in 2019/20, steadily reducing from 18.80 metres achieved in 2015/16. But, a full 2.20 metres closer on average for each shot being taken by the Sky Blues demonstrates a tendency to produce fewer but higher quality chances over trying their luck from range.
So what have we learned?
Hopefully, this article has explained the role of expected goals and its importance to unlocking a deeper understanding of football. Media platforms can churn out a lot of numbers and statistics which will bamboozle the average punter, however in the scheme of things, these figures are merely background noise. Expected goals is revolutionary in the way it blocks out the noise and informs anyone who is ready to look, exactly how a team performed in their search to score goals.
Progressing from that, we’ve analysed how this data can be manipulated to affect on-field tactics. Teams may begin to move away from the blockbuster long-rangers we all adore and instead choose to keep possession in the hope of creating a better – more statistically likely – goal-scoring opportunity. In doing so we may see a change of how free-kicks are taken, how the final few minutes of a game are played and what a player does when the ball sits up perfectly on the half volley from 30-yards.
Though I don’t think we will see the long shot disappear from football completely, I see more and more teams choosing to accept the information expected goals is telling them. The numbers don’t lie, and if managers continue to ignore them, we’ve seen they will be throwing away vital points over the course of a season.




Comments