While data analysis has become more mainstream in football, in truth the use of statistics has been around far longer in other sports like cricket and baseball. Due to the nature of football being low scoring has meant the final result of a match does not always provide a fair representation of performance. This makes it harder to show the value that the correlations in the analysis of data were predicting.
The development and inclusion of data have rapidly expanded but difficulties to model the game remain especially in the context of defence, and while statistics are not perfect, they can aid with comprehension of the game and provide additional context to the analysis. The debate continues as to the effectiveness of their use and application.
Defensive context
What makes assessing defensive stats hard is that unlike offensive actions there is not a consensus that more is always better, at least not to the same extent. In the context of offensive statistics creating and taking opportunities around the oppositions goal is largely regarded as good. Once that baseline is set it makes it easier to asses when a player is efficient while producing a high output in these metrics.
With defensive metrics it is not as conducive to say that a high number of tackles is always good this means they could have failed to intercept the ball beforehand or had been caught out of position. How much should an individual be praised for a good recovering challenge if they made the mistake to create that situation first, often the statistics do not possess the necessary context to provide an accurate representation of this predicament.
‘True’ Tackle success-rate
One method that has been suggested by an article in the Athletic written by Tom Worville. It looks to add context to the traditional success-rate by factoring in the number of fouls a player makes in his attempt to recover the ball. This looks to incorporate additional information that if neglected would leave the metric favouring defenders who are tougher in the tackle.
For this part of the analysis, the sample used is centre-backs from ‘Europe’s top five leagues’ who have played more than 750 minutes so far this season.

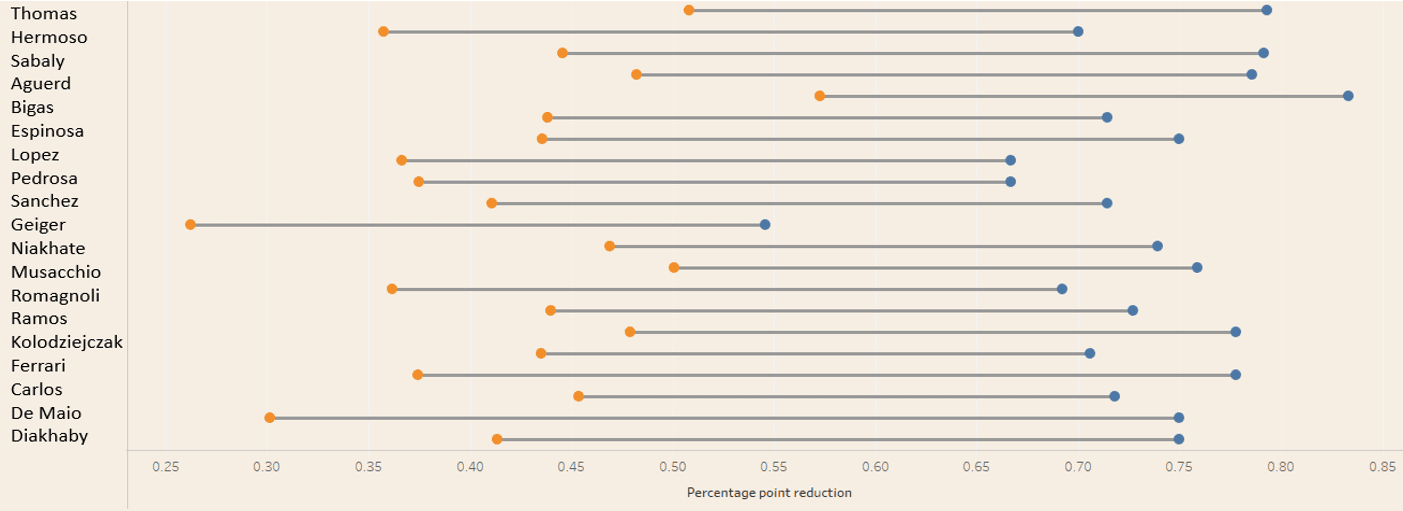
What this metric does is highlight new names that previously were not considered, a great example is William Saliba who is now top of the table on the right, as he only makes 0.17 fouls per 90 and this should have merit when we analyse defenders. On the opposite end, it becomes apparent that the metric reduces the value placed on hard tacklers, this is something that needs to be considered in any analysis, the significance of this amendment is an average change of 10 percentage points.

On the graph above it displays the individuals who have their tackle-rate (blue node) reduced the most by incorporating fouls to calculate true tackle success-rate (yellow node). One of the classic ill-disciplined defenders in football and hence there is no surprise he features in the top twenty most effected by this alteration is Sergio Ramos from Real Madrid, who while is a strong tackler tends to be over-aggressive to the detriment of his team. When analysing defenders it is important to understand that the areas a centre-back typically operates, the fouls they commit will often present the opposition with a dangerous opportunity from a set-piece.
Typically more reserved defenders are less likely to attempt tackles unless they are certain they would win the ball which may lead to inflated success-rates, this style is not objectively good or bad but it may increase the individuals tackle success rate and this context may influence what players are drawn from the data.
Variance in Tackling statistics
Many data providers now track football which has led to a wealth of resources for statistical analysis but what this has caused is a conflict between how actions on the pitch are defined and how this affects what players are highlighted in the data. In the contexts of this article the focus will be defining ‘a tackle being won’.
Whoscored: “A tackle won is deemed to be where the tackler or one of his team-mates regains possession as a result of the challenge, or that the ball goes out of play and is “safe”.”.
FBref: “Tackles in which the tackler’s team won possession of the ball”.
Wyscout: Although why scout doesn’t provide data for tackle success-rates they record defensive duels which are described as “Individual game in defense, when the defender is playing 1 vs. 1 against the attacking player and trying to stop his attacking run or dribbling”.
Although the comparison between the metrics definitions clearly outlines differences in what the provider records, especially with Wyscout which has a much broader range of actions defined under defensive duels. There are still overlapping events that should constitute a correlation between the measures.
For this part of the analysis, the sample used extends to centre-backs, full-backs and central midfielders from ‘Europe’s top five leagues’ who have played more than 750 minutes so far this season.

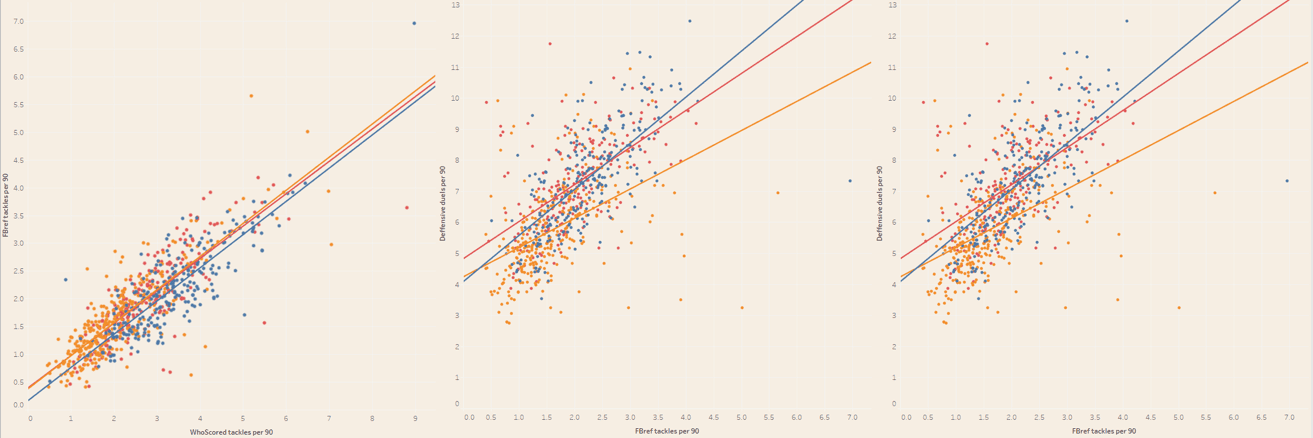
By comparing the correlation in tackles attempted it visually portrays the relationship players have between the different stats and illustrates the extent that the definitions overlap as they show players doing similar amounts of defensive work between the measures.

Mathematically these relationships can be described using a formula called ‘r’ which is a coefficient of correlation, as a benchmark a strong correlation is regarded as around 0.7. this value is very similar to the ones showed in the table above comparing WhoScored with Wyscout. By comparing the definitions this would be expected as the two seem far more related than in comparison to Wyscout’ defensive duels.
Intuitively it would be expected that defenders would have transferable skills that would result in them performing consistently across the three measures, despite the variation in definitions that would result in them performing consistently across the three measures, despite the variation in definitions that would result in some discrepancy in actions recorded under each measure.

Interestingly this is not represented in the above visualisation and while the comparison between WhoScored and FBref tackle-success measures was very proportional and nearly intercepted at zero it now displays a trend line which is directed downwards the opposite of what would be expected.

Mathematically the relationship is also very weak and across all three comparison shows almost no correlation with points dispersed far away from the trend lines shown on the graph. The calculated ‘r’ Values leads to question how suitable the measures are at reflecting a defender’s ability to successfully tackle defenders when the metrics across the three so poorly align.

By collecting all the average values presents the ability to point out the nuances and context in the definitions which may lead to the weak correlation. An example would be why full-backs have far higher success-rates in the WhoScored metric than the average of the three. The nuance is that tackles, where the ball is cleared out of play, are counted, with full-backs operating near the touchline this is an aspect of the definition that would affect them more than most. Although where the FBref metric requires possession to be retained could be a factor why its average is the lowest of the three, theses are the small factors that need to be considered when using data to assess players.
Matching Statistics to visual observations
While this analysis has clearly stated a strong performance in one metric does not necessarily correlate to strong performances in the others. What value these statistics do add is when comparing players in the visual analysis if a selection of players that perform well also consistently do so in one of the metrics additional focus may be added in that regard over the others.
This part of the analysis returns to the original sample to isolate potential external factors that may affect the dispersion illustrated in the graphs below.

By taking players that perform well in observational analysis and comparing that to where they perform well in the data could help build a profile of key stats which could then be used to filter other players who may also perform well in observational analysis.

There is also the potential to aggregate all three measure in an attempt to capture all the actions tracked under all of the definitions all through this may add a bias to measures that are consistently featured within the definitions and inflate certain players performances.
The key principle When analysing players with data is to attempt to find many perspectives and include various metrics to build a profile that accurately depicts what is needed to be found.
Additional considerations
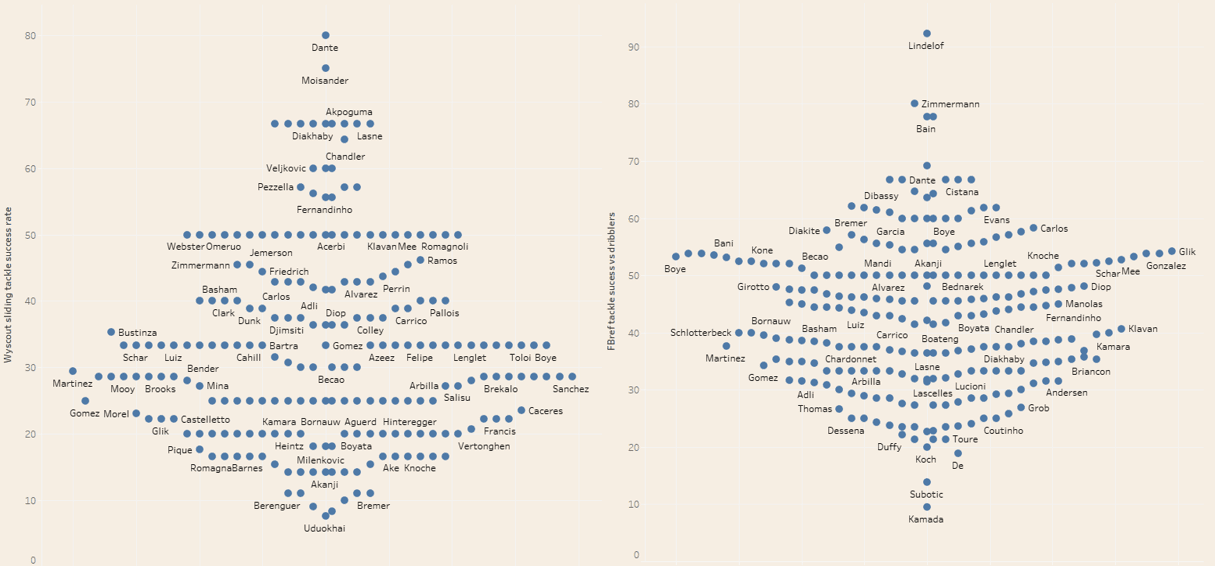
It is worth considering what is included in the definition that these metric tracks and what is out of the scope of their range. Both FBref and Wyscout give additional success metrics which are linked to a player’s ability to recover the ball.

While Wyscout Sliding tackle success-rate tracks events that are usually rarer in modern football it still would add value to any analysis of defensive players as it provides additional insight into a wider skillset the player has. FBref also provides an alternative statistic which tracks a player’s ability to tackle an opposition player dribbling towards them, this is very valuable information especially for a team who might operate with three centre- backs. One element of Victor Lindelöf’s game that has been exceptional this season, is his ability to cover the space behind the wing-back and is hence top of the graph on the right which represents this metric.
The key consideration is that both of these measures are not incorporated into the providers main tackling success-rate metric, which means by comparing players without the addition of these metrics will leave the analysis omitting key attributes that reflect a players ability to tackle.
Contextual considerations
As with all data analysis, there is the need to acknowledge the context it is collected in which includes the fact it can often represent style as much as ability.
In a defensive aspect player whos team tactic is to set up in a low block are likely to show a level of defensive metrics above their ability. A tighter defensive structure limits the space an attacking team must operate and often isolates individuals making them easier to dispossess.
Defensive units are much more interlinked then attacking units and are therefore more likely to skew individuals stats based on the team’s performance then is the case for offensive players, similarly, the system is very inducive of individuals performances low blocks makes it easier for defenders to win the ball as does a system where offensive players trackback makes defenders life easier and help to inflate their stats beyond their abilities
Conclusion
Often in football data is stated as facts and completely objective. But in the current period large amounts of data remains manually collected and includes a decision which is made by a human, hence is potentially exposed to bias and/or error. The statistics referenced in this article are also binary and offer no merit for actions that are substantially better than those who marginally reach the minimum requirement. In a defensive context, this could be a fantastic lunging last man tackle or an easy tackle against a player who does not have full control of the ball, both count as the same.
While there are many limitations to using data to analyse players, when the context and limitations are accounted for it can provide an invaluable resource into profiling, highlighting and shortlisting players by their performance in various metrics and its use will only become more prolific and efficient in the future.


Comments