After a strong start to the season for Manchester City, many people thought that they would once again dominate the Premier League and win the title by a significant margin, but at one moment Liverpool started to catch up with them and now they look like contenders. This data analysis will give us a quick overview of how teams in the Premier League perform through statistics.
Expected goals model & performance
The first graph will show us xG values to see the quality of the team based on the quality of chances created and allowed. It looks as you assume it would look.
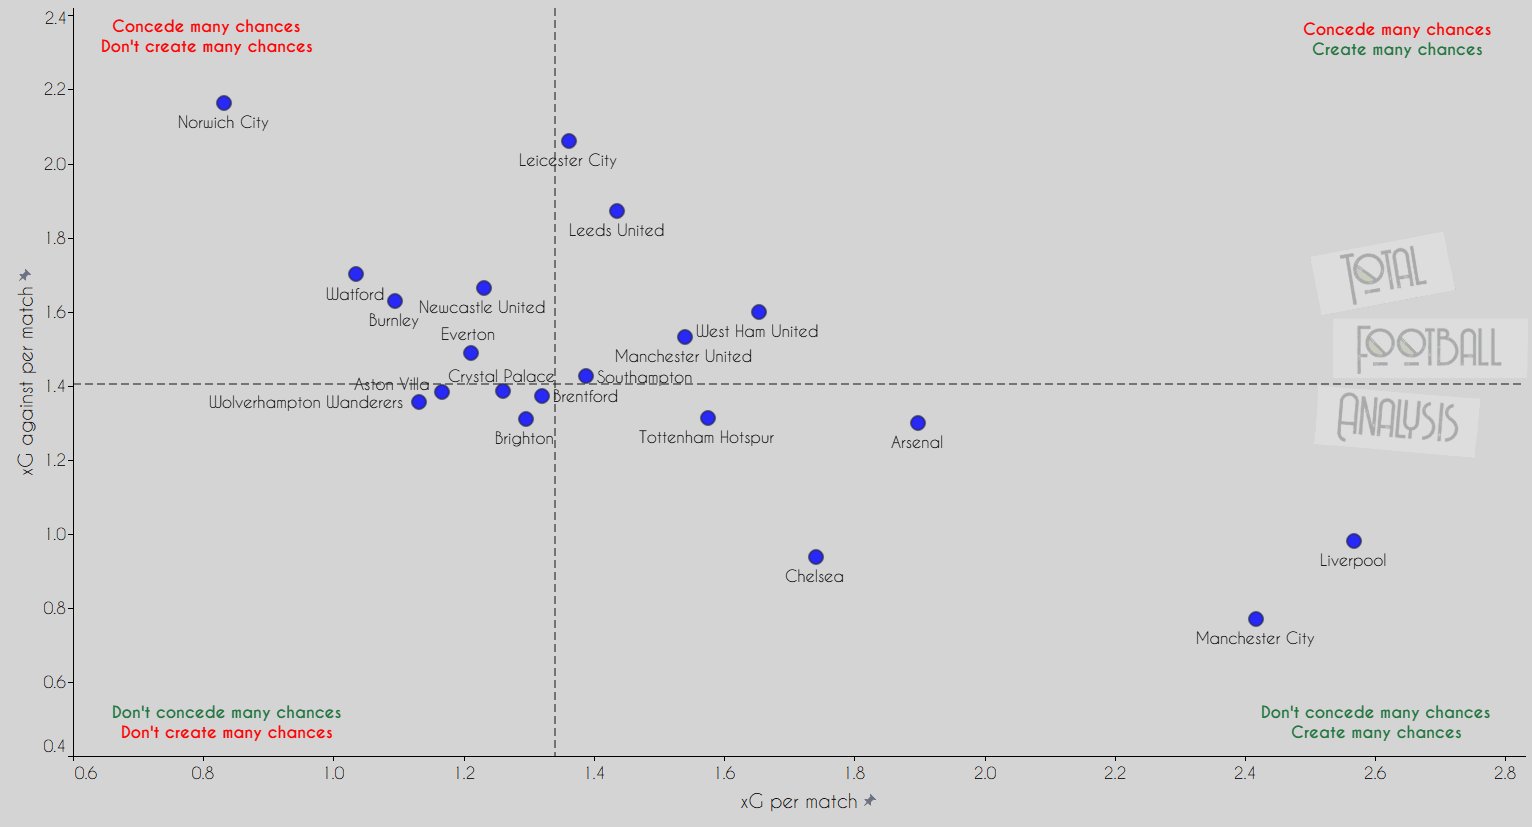
Clearly, Manchester City and Liverpool are in a league of their own; they create a lot of high-quality chances and allow a small number of chances for their opponents. Liverpool are the best attack based on the expected goals model, followed by Manchester City which is also the best defence while Chelsea are behind them when it comes to expected goals against. We can see that Arsenal and Chelsea look very good compared to the rest of the league. Interestingly, Manchester United, West Ham and Tottenham look quite similar on the graph and while West Ham can be satisfied with that, the other two teams are unhappy with their situations. Norwich City’s position on the graph mirrors their position on the table and they are the worst on both axes. It is very surprising to see Leicester City as the second-worst defence based on expected goals but their performances this season have been below-par quite often. Next to Norwich City, we see Burnley and Watford represented as being the least dangerous teams.
In the next graph, we will take a detailed look into teams’ shooting by looking at how often they shoot and what their average shooting distance is.
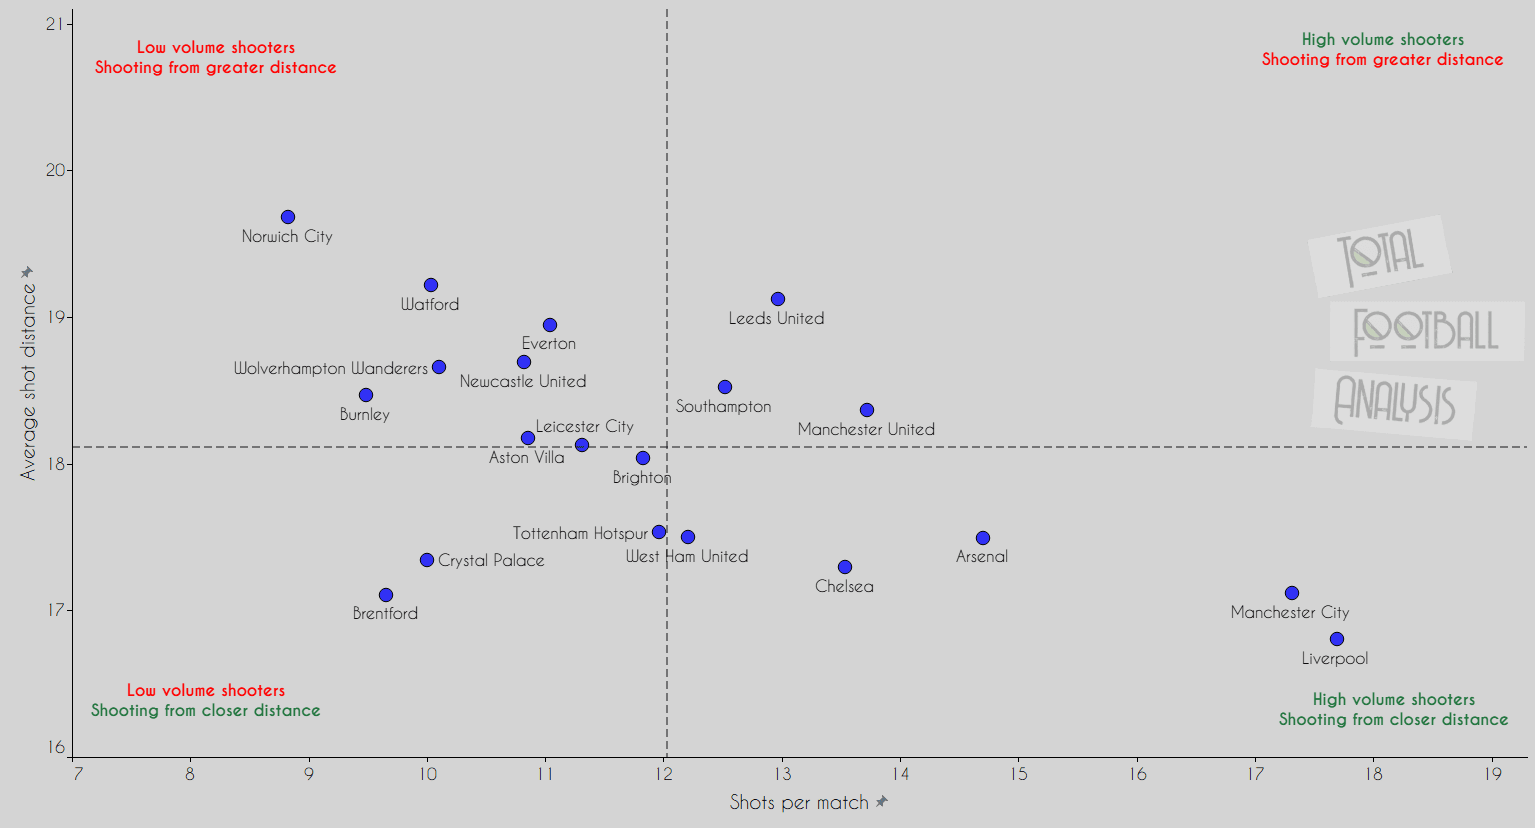
Using this graph we can explain team xG from the first graph. We can easily link why Liverpool and Manchester City showed impressive output in xG given the fact that both teams attempt at least two shots more per match and they shoot from a closer distance than the rest. Arsenal and Chelsea are the closest teams to the dominant duo. We can see why Norwich City, Watford and Burnley are scoring low xG, all of them shoot 10 times per match or less and shoot from a greater distance than the league’s average which scores lower on the xG model. Brentford are quite interesting since they shoot less and seem like a team that patiently look to get into promising situations rather than shooting whenever they have an opportunity based on their shooting from closer distances. A lot of teams have similar outputs where they shoot between 11 and 13 times per match.
The last graph in this section consists of created metrics called defensive and offensive performance. Both metrics are in percentage value and they represent the team variance between xG and goals.
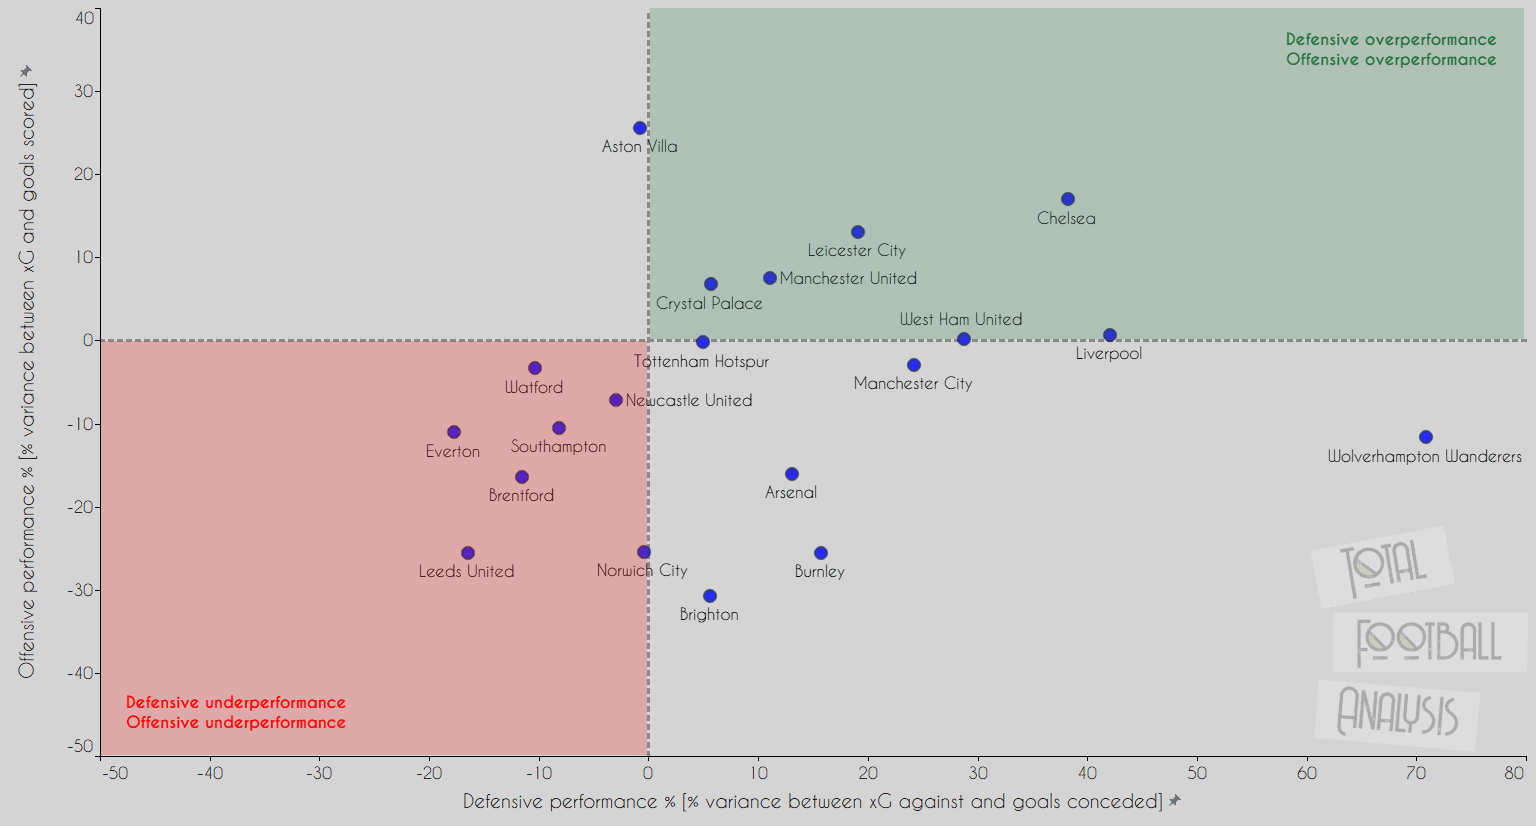
The green quarter represents the area where the team is overperforming their defensive and offensive expected goals while the red area is the opposite. A team that is showing the biggest variance in defensive performance is Wolves, they are overperforming their xG against by a significant margin. José Sá is performing at the top level this season which is one of the reasons why they are in that position on the graph. Aston Villa are the biggest offensive overperformer which also can be linked to the fact that they like to shoot from a greater distance or low-value xG positions and they have the quality to score from these positions. Chelsea are overperforming in both statistics and occupy the green area along with Leicester City, Manchester United, Crystal Palace, West Ham and Liverpool. In the red area, there are relegation candidates Norwich City, Leeds United, Everton, Watford, Brentford and also Southampton, who are safe from relegation.
Possession & set-pieces
In this section, we will take a look into possession numbers and also attacking set-pieces output. First, we will evaluate passing tendency and which teams are more direct and which teams tend to play more positional football. The size of a dot represents possession.
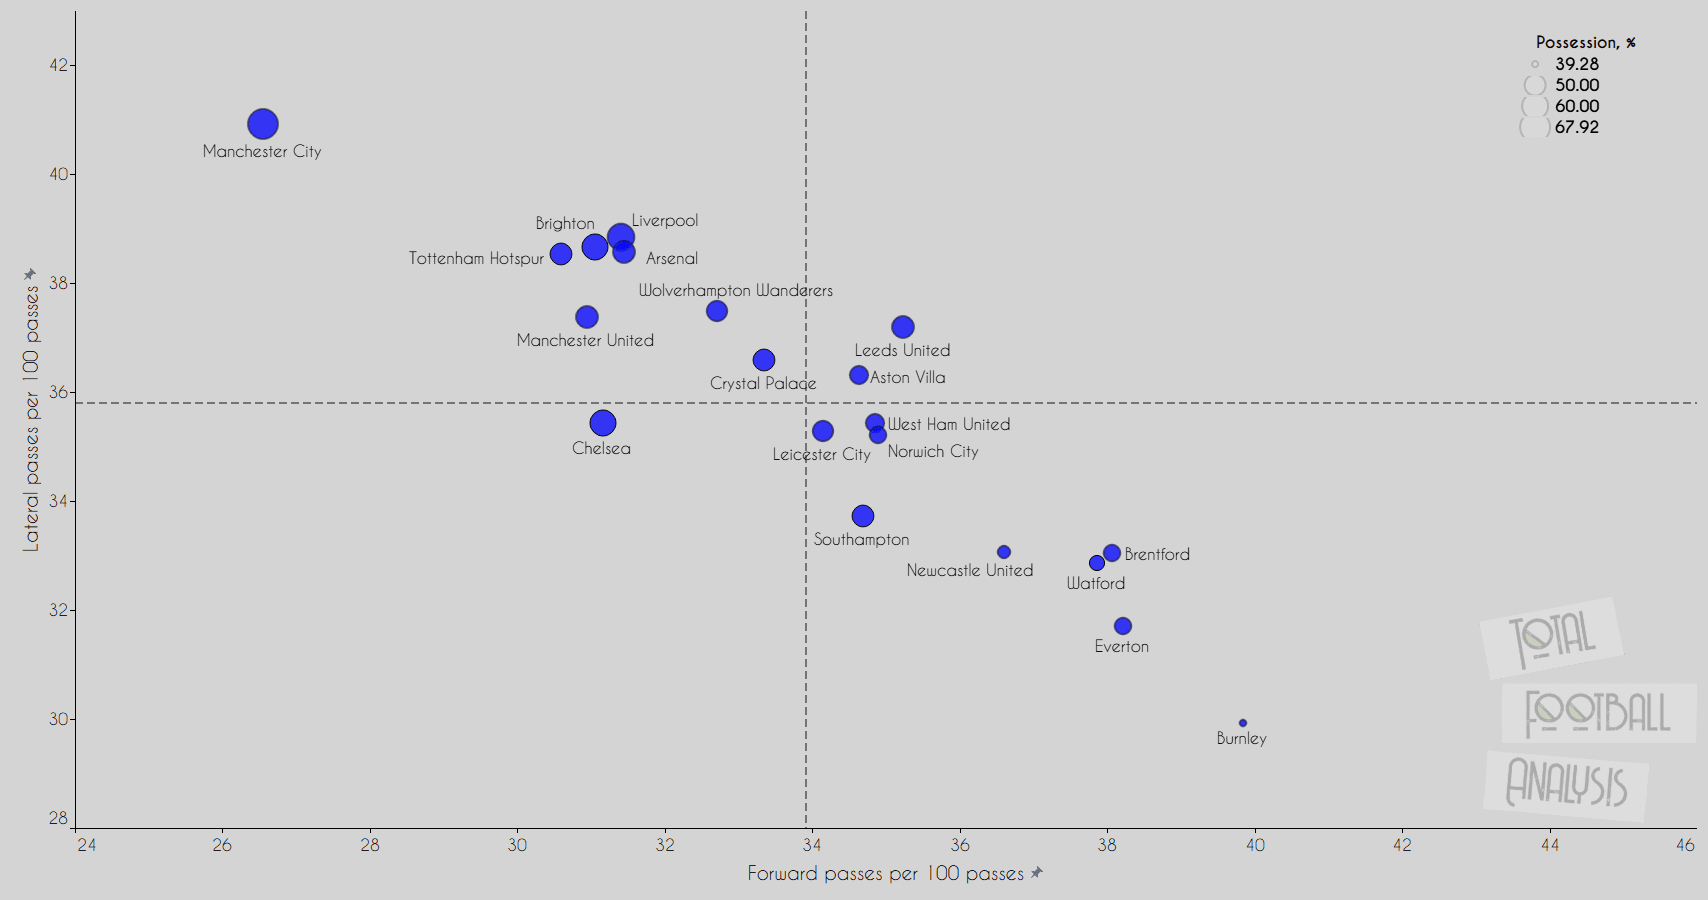
It is not surprising to see Manchester City as the most possession-based team in the league, while Chelsea and Liverpool are right behind them based on ball possession %. However, there is no team like Manchester City when it comes to patience and moving the ball from one side to another to spread the opposition defence before looking for a vertical pass. Burnley are, however, on the opposite side when it comes to playing style, they don’t take much time before attempting a pass forward, mostly long passes to their centre-forwards which suited Chris Wood’s playing style in the first half of the season and now they do the same but with Wout Weghorst upfront, acting as a like-for-like replacement for the New Zealand man who defected to Burnley’s relegation-battle rivals Newcastle United in January. Bottom tier clubs Everton, Watford, Brentford and the Toon follow a similar pattern since they have trouble keeping possession for very long.
The next graph in this section will show us how often teams have set-pieces and how dangerous they are from dead-ball situations.
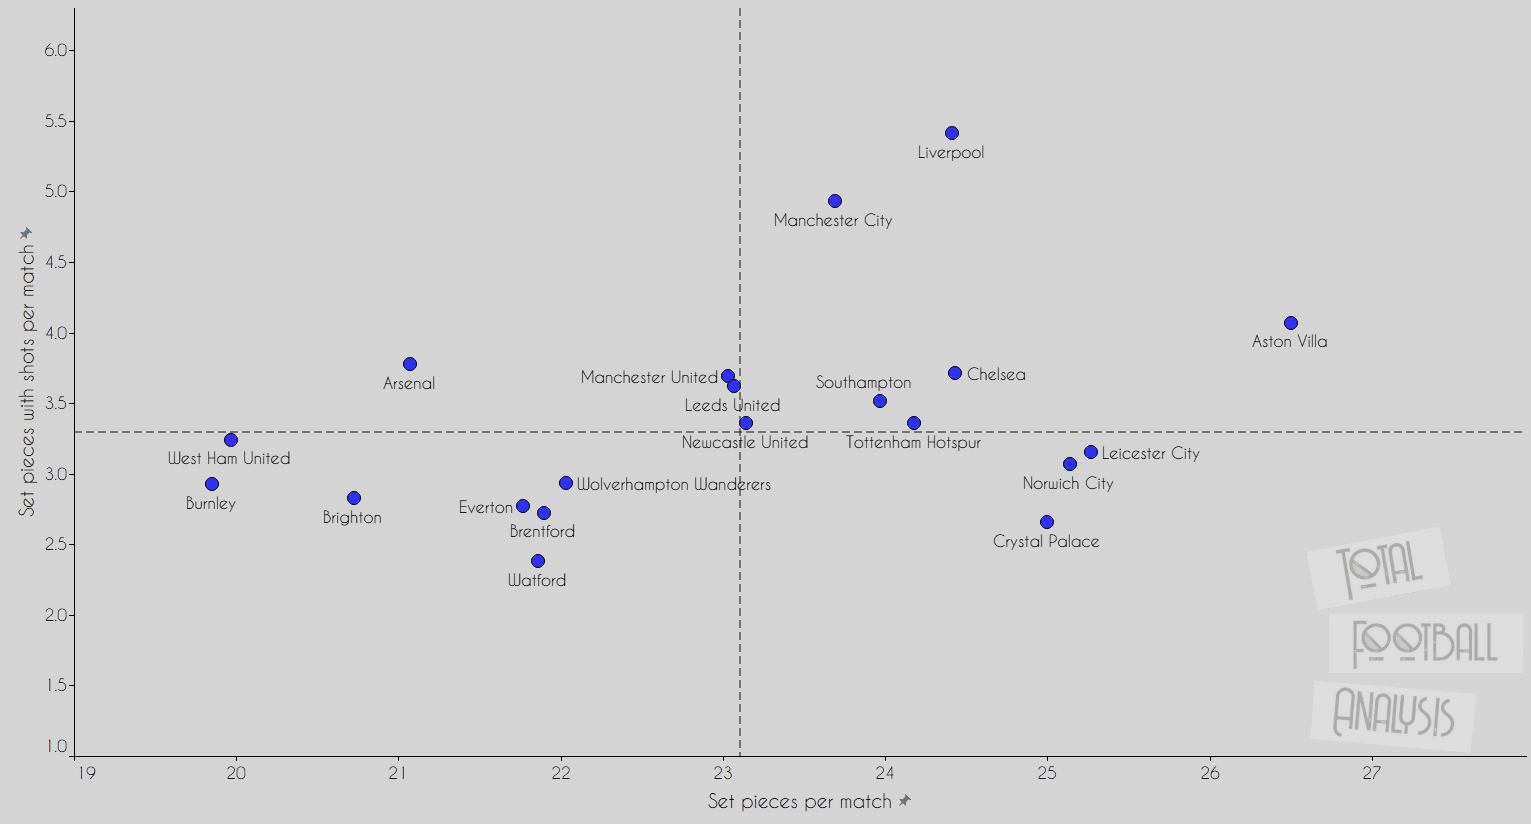
The most dangerous teams from set-pieces are the leading duo on the table: Manchester City and Liverpool. Once again, both teams are showing the top number with approximately every fifth set-piece leading to a shot towards the goal. Aston Villa are the third best when it comes to the number of shots after set-piece while they have the highest amount of set-pieces per match. Arsenal shows a good shot per set-piece ratio but doesn’t have many set-pieces and they are the fourth from the bottom in that statistic. Ironically, Burnley are the team that relies a lot on set-pieces and they have a team full of tall players, but their playing style leads to them having the fewest set-pieces in the league. Leicester City, Norwich City and Crystal Palace are having a lot of set-pieces but are not very effective and they combined have 12 goals from set-pieces (Leicester – 6) while the likes of Manchester City and Liverpool have 15 and 13 respectively.
Defending
In the last section, we will take a look into teams’ success in duels and also their tendency to press higher and work on regaining possession. First, we will look at pressing tendency through PPDA(opponent passes per defensive action) and recoveries in the final third.
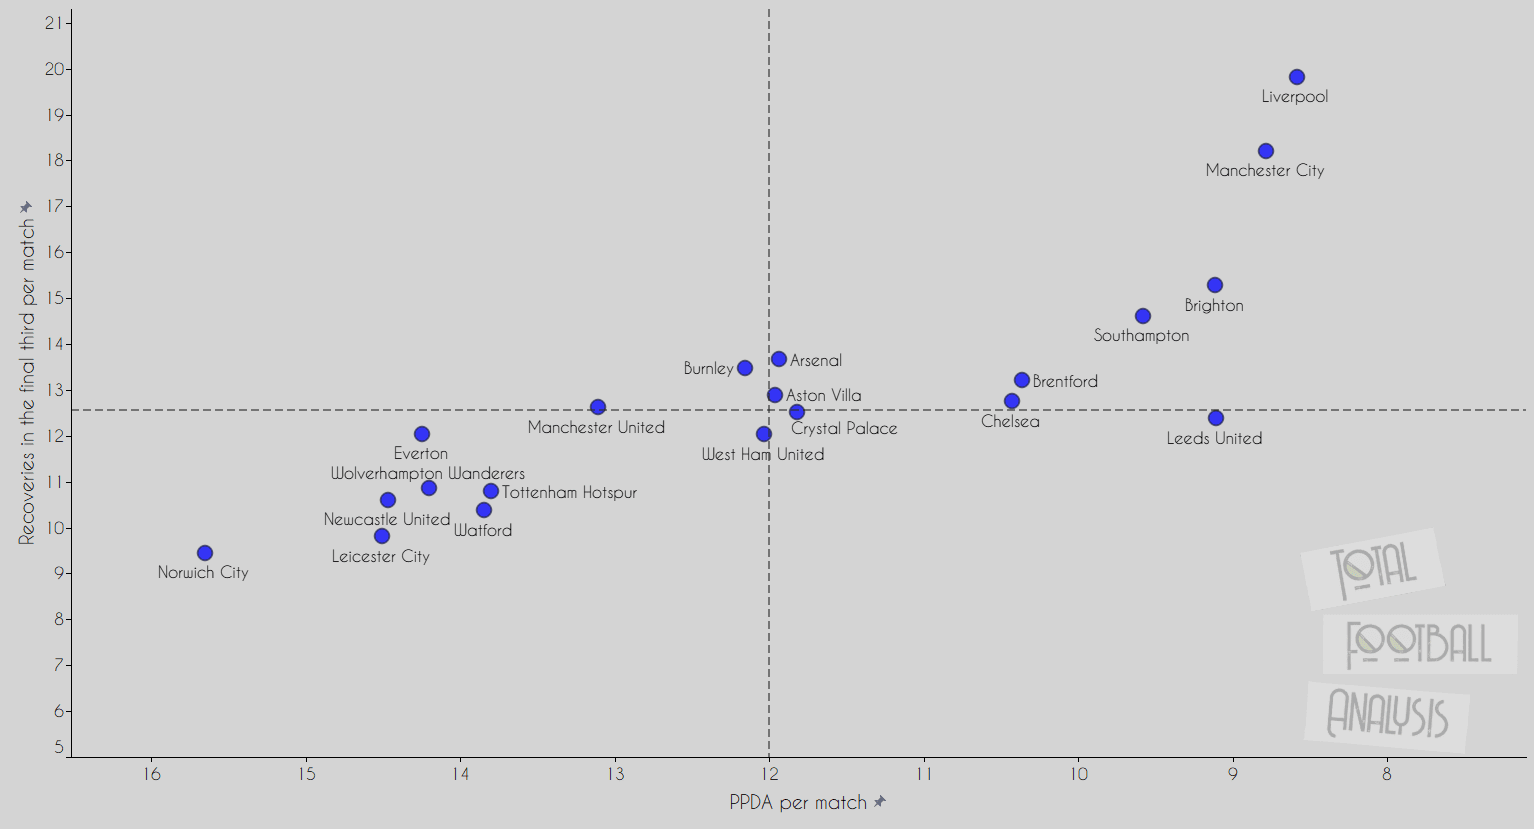
As expected, Klopp’s team is the best in this graph since they press with intensity high up the pitch and manage to recover an impressive amount of balls in the final third which often leads to good goalscoring opportunities for them. Just behind them is Manchester City which recovers a very high number of balls in the final third, but they have a different approach to Liverpool upon regaining possession they work on retaining it and keeping it safe rather than trying to score instantly. Brighton, Southampton and Leeds United have managers with similar approaches to Liverpool and they like to press high and play with high intensity. This style of football led Leeds to sack Marcelo Bielsa since he continuously stuck to his guns regarding the ultra high-octane playing style when it was clear that his team, at this current moment and with multiple injuries, wasn’t on the needed level to be very effective in high-intensity pressing. On the opposite side, we can see sides like Norwich City, Newcastle United, Watford, Leicester City, Wolves, Tottenham and Everton that take more time before attempting a defensive action and rarely recover the ball in the final third.
The last graph in this analysis shows how successful are teams in defensive duels and aerial duels in percentage.
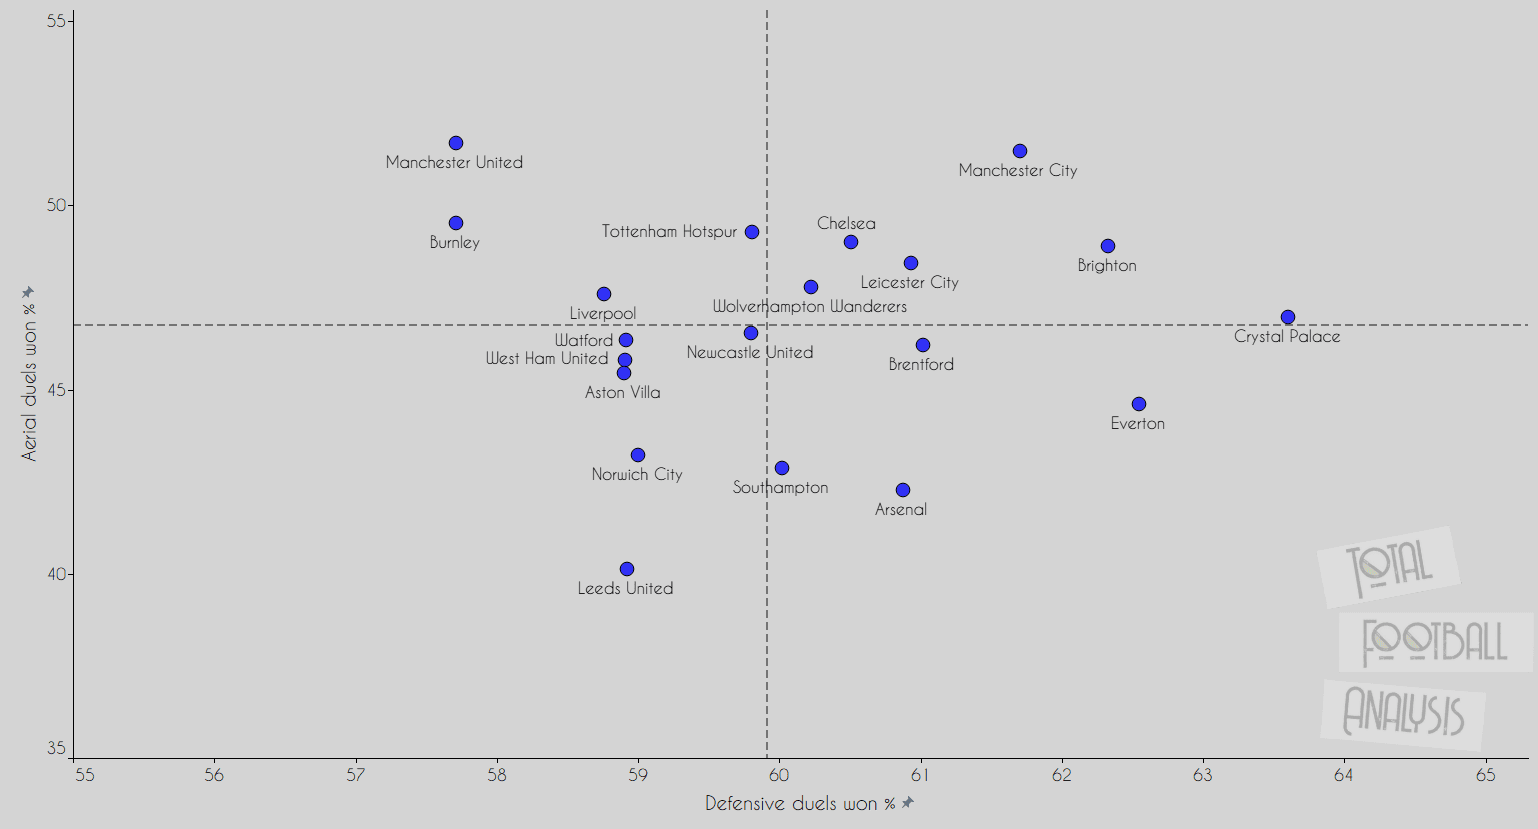
Manchester City and Brighton show very good balance in both defensive duels won% and aerial duels won% since they are on top right quarter. Manchester United are the best in the aerial duels won% but are the worst in defensive duels won% and share that place with the Burnley which is not very good output for the Red Devils. Crystal Palace are average in aerial duels won%, but they are the best in defensive duels won % which shows that Patrick Vieira players play matches with bravery and intensity in close encounters and it leads to good results for them. Leeds United and Arsenal are the worst in aerial duels won% and it isn’t surprising given the attributes of players that they have at their disposal.
Conclusion
This analysis led to some insights about the EPL teams and their performance so far this season, but it also showed some things which were obvious even without data. Manchester City and Liverpool dominate in most of the statistics and show why are they at the top competing for 1st place. Meanwhile, the numbers for Manchester United, Tottenham and Leicester City are mostly average and it can be seen on their performances that they often struggle and can’t keep the good performance level for multiple matches in a row, while Manchester United and Tottenham have a decent situation on the table — remaining in the hunt for top-four — Leicester are stuck in the middle of the table. It seems that Norwich City and Watford are destined for relegation based on their performances. Details will prevail whether Liverpool or Manchester City will win the title but what’s for sure is that the next couple of weeks are going to be interesting for Premier League fans.




Comments